
Food cost

Typical Restaurant Profit Margin: Why One Average Hides a Losing Site
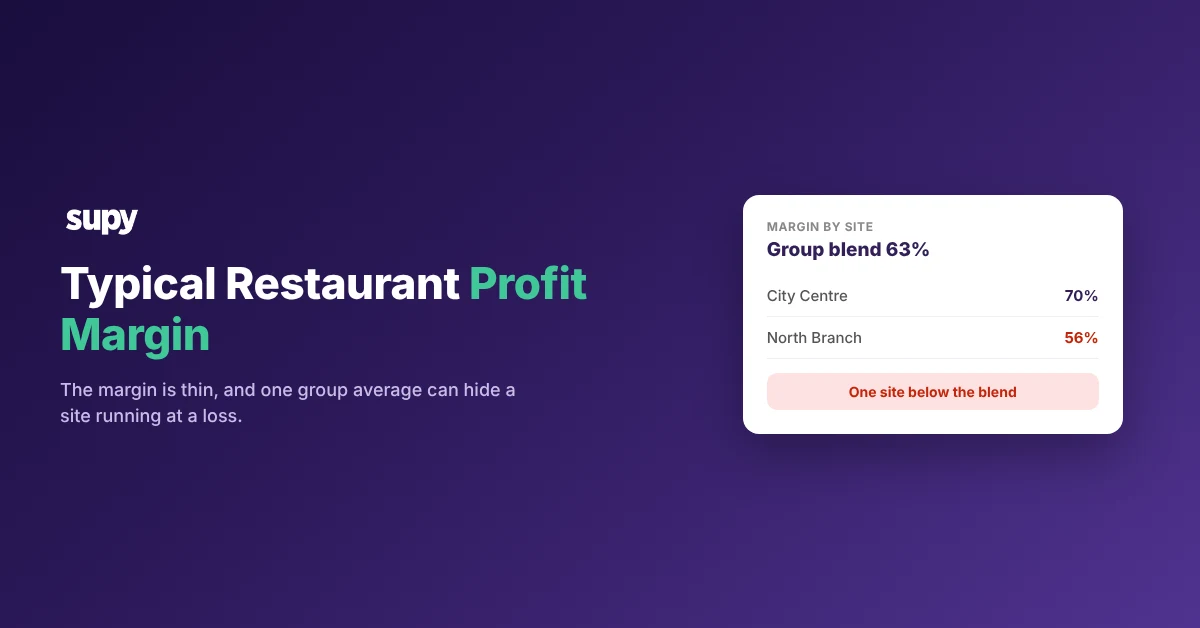
What a typical restaurant profit margin really is

A typical restaurant keeps only a few cents of net profit on each dollar of sales, so a single point of food cost decides the month. One multi-site QSR group spent about a third of sales on food and kept roughly 1% as net profit. At that margin, a 1-point error in reported food cost is the line between a profit and a loss. This article shows why the margin is thin, how a group total masks a losing site, and how to find the dishes that lose money.

  • Prime cost. Net profit is what remains after food, labour, rent, utilities and everything else. Food and labour together make up prime cost, the pair an operator watches first. Food is the largest variable cost of the two.
  • Understated food cost. Say the recipe cost on screen sits a point or two below what the kitchen actually pays. Every point you understate comes straight off the net margin. Sales can look healthy while the restaurant keeps nothing at the end of the month.
  • Match real cost. That is why reported food cost has to match real food cost. A margin of a few cents cannot absorb a recipe cost that nobody updated. Prices moved, nobody rechecked the recipe, and the kitchen kept costing the dish at the old price.
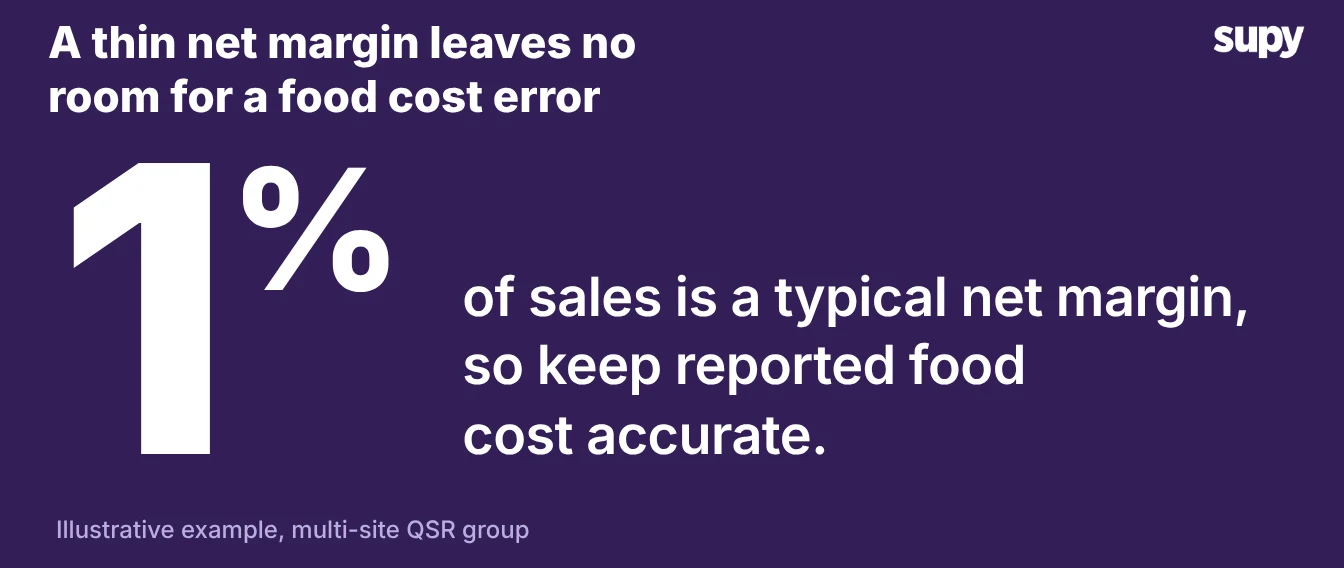
A big number showing a typical net margin of 1 percent of sales, with a note to keep reported food cost accurate

Why one average hides a site running at a loss

A blended margin across sites is an average, and an average hides its worst member. A group that reads one number for the whole estate cannot see the site dragging the rest down.

The strong sites carry it in the blend. The wider the estate, the more sites one figure blends, so a single weak site hides easily.

  • A real case. One casual-dining group reported a steady 63% margin across all its sites. A quarterly review found two of them running at 56% and 57%, below the blend for 3 months. Those sites paid more than the central recipe costs assumed. The group figure never moved, so nothing flagged the problem until someone looked site by site.
  • The fix. The fix is to read margin per site, not per group. Lay the sites side by side against the blended figure. You spot the low ones at a glance, weeks before a quarterly review would.
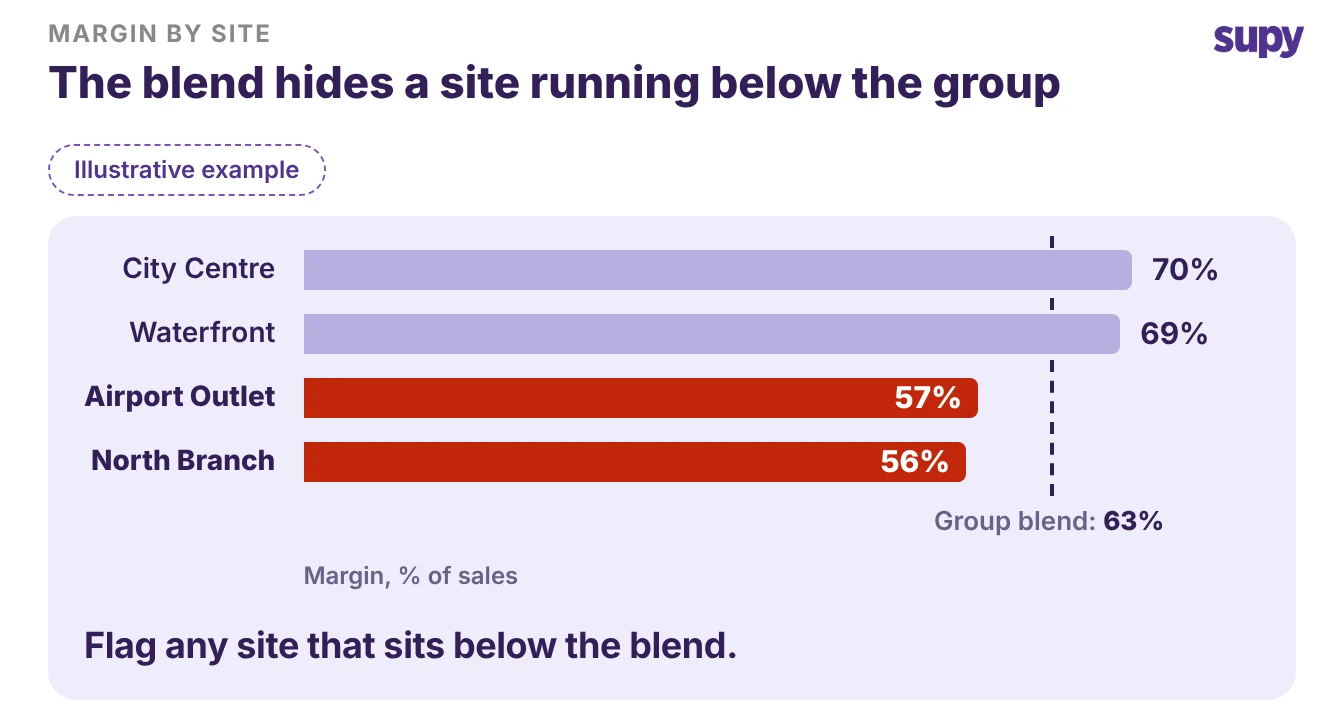
A bar chart of four site margins against a 63 percent group blend, two low sites highlighted below the blend

The dishes quietly losing money

The same blending happens one level down, on the menu. A healthy average food cost can sit on top of individual dishes that lose money on every plate.

  • The Spread data. The Spread finds that 1 dish in 7 runs a food cost of 40% or more. Across those 118,913 dishes, 1 in 40 loses money outright. Our guide to menu items sold at negative or zero margin shows how to find and fix each one.
  • How dishes turn. A dish turns negative the same way a site does. An ingredient price climbs, the menu price holds, and the recipe cost is never rechecked. The menu looks busy while the worst plates lose the margin the good ones earn. Across a long menu, a few negative plates sit unnoticed among dozens that pay their way.
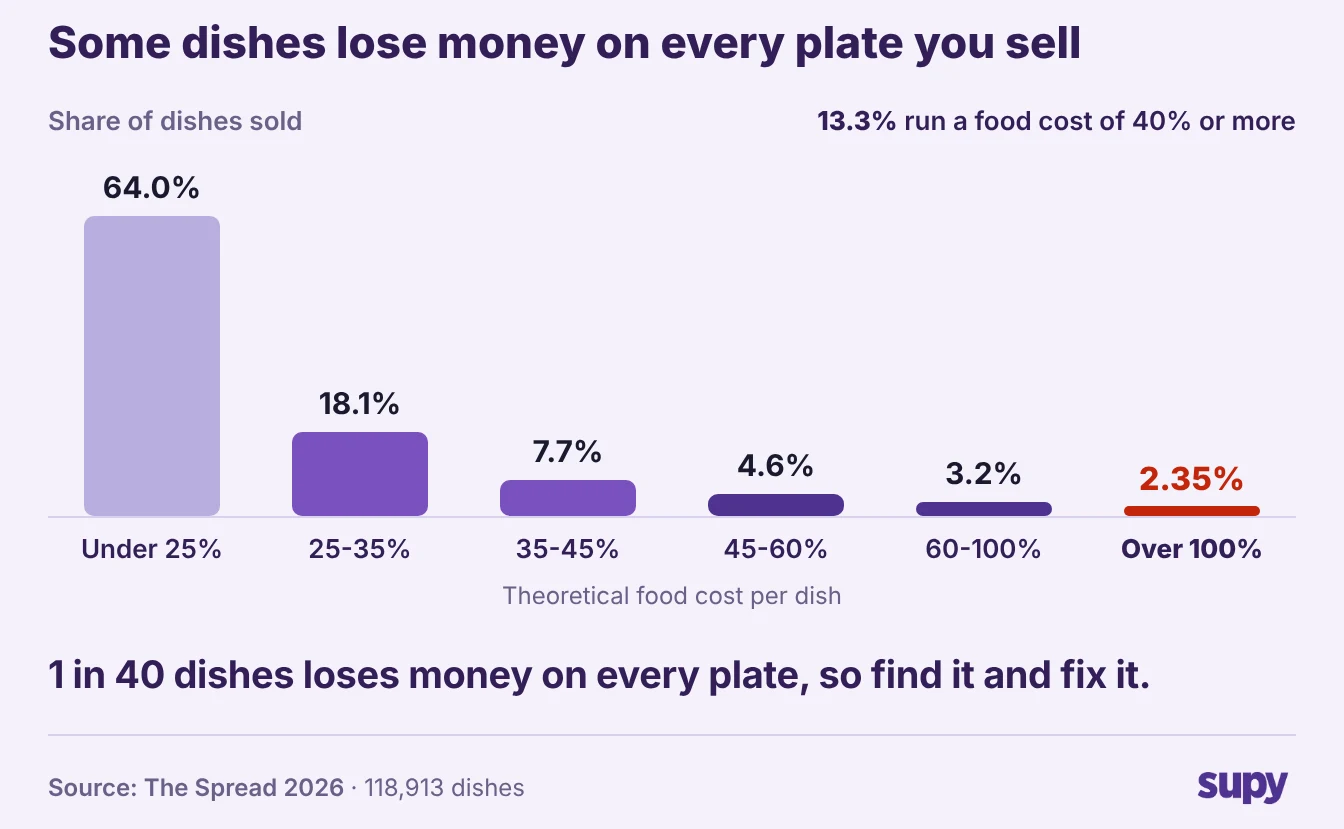
A chart of dishes by food cost showing 1 in 40 loses money on every plate

Read margin per site and per dish, every month

Read margin per site and per dish every month, not every quarter. A quarterly review finds the problem three sales-cycles late, after the loss has already run for weeks. A monthly read catches a drifting site or dish while you can still act on it.

What to readHow oftenWhat it catches
Margin per siteEvery monthA site running below the group blend
Food cost per dishEvery monthA dish that turned negative
  • A real operator. One operator targeting 30% cost of goods found his actual figure sitting at 43% to 47%. He could not explain the variance while his stock lived across WhatsApp, Excel and memory. The number existed; nobody could see it in time. Pull margin per site and per dish on a fixed monthly date, compare each against its target, and work the worst first.
  • What Supy shows. Supy shows your cost of goods and margin live, by group, site, category and dish. You see a losing site or dish the week it happens, not at the quarter's end. The restaurant analytics dashboards rank profitability by site, category and dish. Each recipe carries a target food cost that flags when the actual figure goes over it.

Start with one monthly read. Rank your sites by margin, then your dishes by food cost. Look first at anything below the group blend or above a 40% food cost.

A typical margin leaves no room to carry a loss you cannot see, so make that loss visible while there is still time to fix it.

Book a Demo with Supy - see every site's true margin

Ready to optimize your restaurant operations?

Blog

Our operational insights

How to calculate food cost percentage - professional kitchen during service
Food cost

How to Calculate Food Cost Percentage: Formula, Examples and Benchmarks

Analytics
F&B
Food cost

Supy x Revel : The Partnership Helping Multi-Site Businesses Cut Costs

F&B
Inventory
Pricing
Food cost

How to Increase Profit Margins in Restaurants with Integrated Inventory Solutions

Your questions 
answered

Everything you need to know about Supy — from setup to integrations, pricing, and daily use. If it’s not covered here, just ask.

What is a typical restaurant profit margin?
+
Most restaurants keep a thin net profit margin, often only a few cents on each dollar of sales. Gross margin looks healthier because it counts only the cost of food and drink, but net margin is what the business keeps after labour, rent, utilities and everything else. In one multi-site QSR group used as an example here, food ran near 34% of sales and net profit sat at roughly 1%. At a margin that thin, a single point of food cost can decide whether a month shows a profit or a loss, so the figure that matters is net, not gross.
What is a good net profit margin for a restaurant?
+
A good net profit margin depends on the format, but most restaurants work in a low single-digit to high single-digit percentage after every cost. The number matters less than the trend. A margin that holds steady month to month, with no site or dish dragging it down, beats a higher figure you cannot explain. Read net margin by site and by dish, not just one group average, because a healthy blended figure can hide a site running at a loss. Judge the business on the direction of the margin and the spread between your sites, not only the headline percentage.
Why are restaurant profit margins so thin?
+
Food is the largest variable cost in a restaurant, and it moves constantly as supplier prices change. Labour, rent and utilities take most of what is left, so net profit is a small slice of each sale. Because the margin is so small, a one-point error in reported food cost can wipe it out. When the recipe cost on screen sits below what the kitchen actually pays, you keep less than you think on every plate. The margin is thin by nature, which is why the costs behind it need to be measured accurately and often.
What food cost percentage should a restaurant aim for?
+
Most restaurants set a target food cost for each recipe and measure the real figure against it, rather than chasing one universal number, because the right percentage depends on the menu and format. The figure to watch is theoretical versus actual: what your recipes say a dish should cost against what the kitchen really spends. The gap between the two is where you lose margin. One operator targeting 30% cost of goods found his actual figure sitting at 43% to 47%, a gap he could not explain while his stock lived across WhatsApp, Excel and memory. Measuring the real figure by site and by dish is the first step to controlling it.
How can a group's average margin hide a site losing money?
+
A blended margin across sites is an average, and an average hides its worst member. When a group reads one number for the whole estate, the strong sites carry the weak ones, so a site running at a loss never shows up. One casual-dining group reported a steady 63% margin across all its sites, while a quarterly review found two of them at 56% and 57%, below the blend for three months. Nobody saw the problem until someone read the figures site by site. Read margin per site against the group blend, and the low ones stand out at once.
How often should a restaurant check its profit margin?
+
Read margin per site and per dish every month, not every quarter. A quarterly review finds a problem three sales-cycles late, after the loss has already run for weeks. A monthly read catches a drifting site or dish while you can still act on it. Pull the figures on a fixed date each month, compare each site and each dish against its target, and work the worst first. The point is to make a loss visible while there is still time to fix it, rather than finding it in the accounts long after the money has gone.
How do I find menu items that lose money?
+
Cost every dish on today's ingredient prices and compare that cost against its menu price. A dish turns negative when an ingredient price climbs, the menu price holds, and nobody rechecks the recipe. The scale is easy to underestimate: across 118,913 dishes in The Spread, 1 in 7 runs a food cost of 40% or more, and 1 in 40 loses money on every plate. Rank your dishes by food cost, look first at anything above 40%, and fix the price, the portion or the recipe. The busiest menu can still carry a handful of plates that lose money.

Ready to transform your operations?

Join 3500+ restaurant operators cutting costs, streamlining operations and making smarter decisions with Supy.