.jpg)


Restaurant Gross Profit Margin: How To Calculate It & What It Actually Measures
What Restaurant Gross Profit Margin Actually Measures
Gross profit margin is the percentage of revenue left after subtracting the cost of goods sold (COGS) - food and beverage costs - from total revenue:
GP% = (Revenue minus COGS) / Revenue x 100
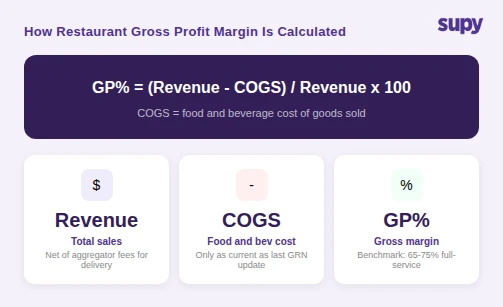
At a single site, this appears simple. If a location takes $100,000 in a month and spends $32,000 on food and beverage, gross profit margin is 68%. The challenge is that each of the three variables in that formula - revenue, COGS, and the relationship between them - carries assumptions that most restaurant management systems do not verify automatically.
Revenue looks like the fixed variable. It is not, particularly for operators running delivery alongside dine-in. More on that in the fourth section.
COGS in a management system is calculated by multiplying recipe quantities by ingredient costs. Those ingredient costs are only as accurate as the last goods receipt note (GRN) that updated them. If a supplier raised prices on a high-volume ingredient three invoices ago and those GRNs were not matched against the recipe cost model, every dish using that ingredient has been costed at the old price since.
The gap between the formula and the actual P&L result is where margin disappears without a clear line in any report.
Ask your system: does it update recipe costs automatically from confirmed GRNs, or does it require a manual cost-update cycle?
Why Theoretical GP% Is Consistently Higher Than Your P&L Figure
The gap between theoretical and actual gross profit margin has three main sources, and most operators experience all three simultaneously.
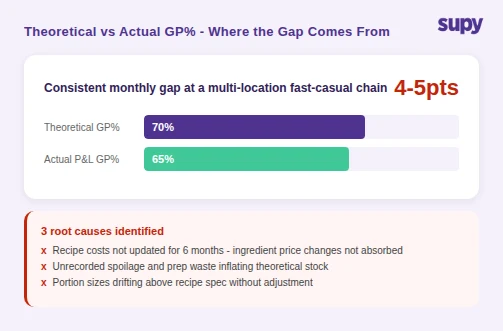
Stale recipe costs. Ingredient prices change with every delivery. A recipe cost model that is updated manually - monthly, quarterly, or whenever someone notices - is always working from historical prices. At a multi-location fast-casual chain, the head of operations identified this as the primary driver of a 4-5 percentage point gap between theoretical GP% and actual P&L results. Recipe costs had not been updated for 6 months. That window covered multiple commodity price movements the system never absorbed.
Unrecorded wastage. Spoilage, prep waste, and staff meals that are not logged do not reduce theoretical stock. They reduce actual stock. At month-end, the system closes with a theoretical stock figure higher than the physical count. COGS is understated, gross profit is overstated. The theoretical GP% includes ingredients that were never sold.
Portion inconsistency. A recipe specifying 180g of protein shows a different COGS per dish than one where kitchen staff are plating 195g. The system costs at 180g. The actual food cost is 195g. Across high-volume service, the gap is material - and invisible in the system until a physical stock count surfaces the variance.
Any one of these sources is enough to produce a 2-3 percentage point gap between theoretical and actual GP%. All three together produce the consistent 4-5 point gap that is common across multi-location groups that have not closed off these inputs.
Ask: does your system log waste by reason code - spoilage, prep waste, staff food - and automatically deduct logged waste from the theoretical stock calculation?
How Blended GP% Across Sites Masks Underperforming Locations
The third source of GP% error is structural for any operator running more than one site: the blended figure.
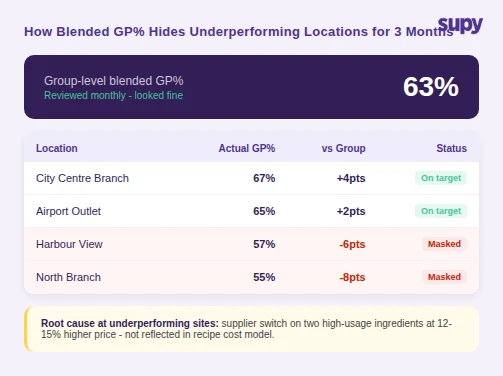
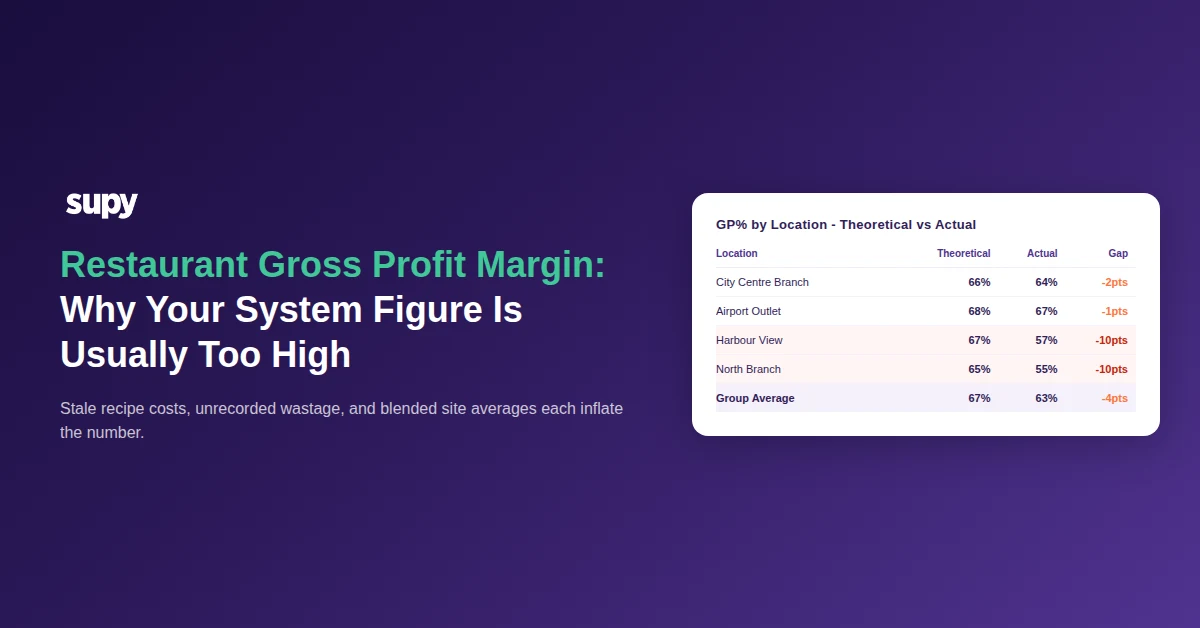
A multi-site casual dining operator's finance team reported a consistent 63% GP% in group-level reporting. No individual site was flagged. When a quarterly review disaggregated the figure to per-location level, two sites were running at 55-57% - a 6-10 point gap below the group average. The blended figure had masked the underperformance for 3 months. Root cause: the two underperforming sites had switched supplier for two high-usage ingredients and were paying 12-15% more per unit. That price change was not reflected in the recipe cost models at those locations, so the system continued to cost those dishes at the old price. Actual COGS was higher. Actual GP% was lower. The blended average absorbed the error.
This pattern is not unusual. A group-level GP% figure is a weighted average. If your highest-volume site runs at 67% and two smaller sites run at 55%, the blended figure might read 64% - and no one reviews the smaller sites because the group number looks fine.
Per-site GP% reporting, updated from live GRN data, is the control that catches this pattern before the quarterly review. It does not require a new finance process. It requires a system where actual purchase prices update recipe costs automatically as GRNs are confirmed - and where live food-cost-% by location is visible in a weekly review, not only at month-end.
Ask: does your reporting show GP% per individual site and flag locations where the figure has moved more than 2 points below the group average?
How Delivery Revenue Distorts Gross Profit Margin for Multi-Channel Operators
Operators running delivery through aggregator platforms face a specific GP% calculation problem.
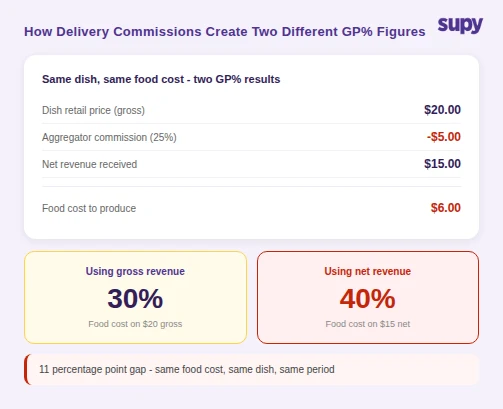
A restaurant group operating dine-in and delivery found that the finance team and operations team produced GP% figures that were 11 percentage points apart on the same delivery-heavy brand, for the same period. The difference was not a data error. Finance calculated GP% using gross revenue - the full order value before the aggregator commission was deducted. Operations calculated it using net revenue - the amount the restaurant actually received. Same food cost. Two GP% figures, 11 points apart. Neither team was wrong by the formula. They were measuring different things.
The correct denominator for food-cost-percentage calculations is the revenue the restaurant actually receives - net of aggregator commission, net of applicable taxes. Using gross revenue to calculate GP% on delivery orders inflates the figure because the denominator is larger than the actual payout.
An item that costs $6 to produce and retails at $20 (gross) with a $5 aggregator commission carries a food cost percentage of 30% on gross revenue and 40% on net. If your kitchen operates to a 30% food-cost target and your finance reporting uses gross revenue while your P&L reflects the net payout, the variance is structural - not a calculation error that will resolve itself.
For operators above 20% delivery mix, the difference between gross and net revenue GP% is material enough to drive decision errors: menu re-engineering, supplier negotiations, and site performance assessments that are based on a figure the P&L does not support.
Ask: does your system calculate food-cost-% on net revenue received, or gross order value? For operators with significant delivery volume, the distinction is not rounding.
The Operational Controls That Close the Gap Between Theoretical and Actual GP%
Closing a 4-5 point theoretical-vs-actual gap is primarily a data-pipeline problem, not a cost-cutting problem. The margin is already built into the menu pricing. The issue is that the cost model does not capture what was actually purchased and used.
Three controls address the main sources of the gap.
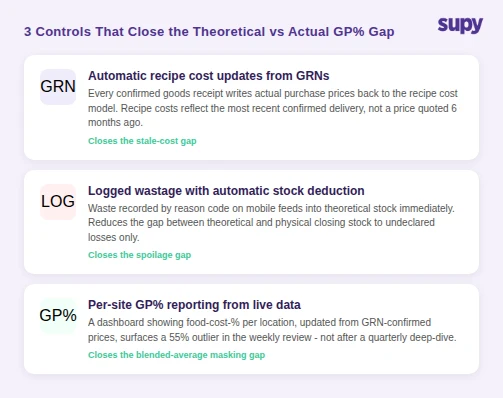
Automatic recipe cost updates from GRNs. Every confirmed goods receipt note contains actual purchase prices. A system that writes those prices back to the recipe cost model as GRNs are approved eliminates the staleness problem. Recipe costs reflect the most recent confirmed delivery price, not a rate quoted six months ago.
Logged wastage with automatic stock deduction. Waste recorded at the point of disposal - on mobile, by reason code - feeds into the theoretical stock calculation immediately. The gap between theoretical and physical stock narrows to what cannot be observed (undeclared waste, theft), which is a smaller and more stable number.
Per-site GP% reporting from live data. A dashboard showing each site's food-cost-% - updated from GRN-confirmed prices and logged wastage - gives operations managers a signal within days of a price change or waste spike, not at month-end. Two underperforming sites at 55% appear immediately against the group average, not after a quarterly review.
These controls interact. Automatic GRN-to-recipe cost updates close the stale-cost problem. Logged wastage closes the spoilage gap. Per-site reporting surfaces blended-average masking. Each control is useful independently, but their combined effect on theoretical-vs-actual alignment is larger than the individual contributions.
Check whether this is happening in your operation
Run these three diagnostics before making any system changes.
First: when were recipe costs last updated for your five highest-cost ingredients? If the answer is more than 30 days ago, stale costs are contributing to your theoretical-vs-actual gap.
Second: compare last month's theoretical closing stock against your physical count. If the gap exceeds 1-2% of total stock value, unrecorded wastage is a factor.
Third: pull GP% by individual site for the past three months. If any site is more than 3 points below the group average without a clear operational explanation, blended averaging is masking a real margin problem.
The pattern of the gap tells you which cause is dominant. A consistent month-on-month gap points to stale recipe costs. A gap that spikes and recovers points to wastage. A stable group figure with high per-site variance points to blended-average masking.
Supy brings these controls into one system: automatic GRN-to-recipe-cost updates, per-site COGS dashboards, and wastage logging that feeds directly into the theoretical stock calculation. The interactive reporting module surfaces food-cost-% at group and individual site level, updated from live GRN data throughout the week, with 75+ POS and accounting integrations so sales figures flow in without a manual export.