
From big picture to the smallest detail in seconds.
Supy’s dashboards turn your operational data into clear insights. Start with a high-level overview, then drill down to site, category, or item level - all in the same screen. Beautifully designed for clarity and speed to help teams not only report on performance but act on it.
Real-time performance
Track costs, margins, and wastage without waiting for month-end.
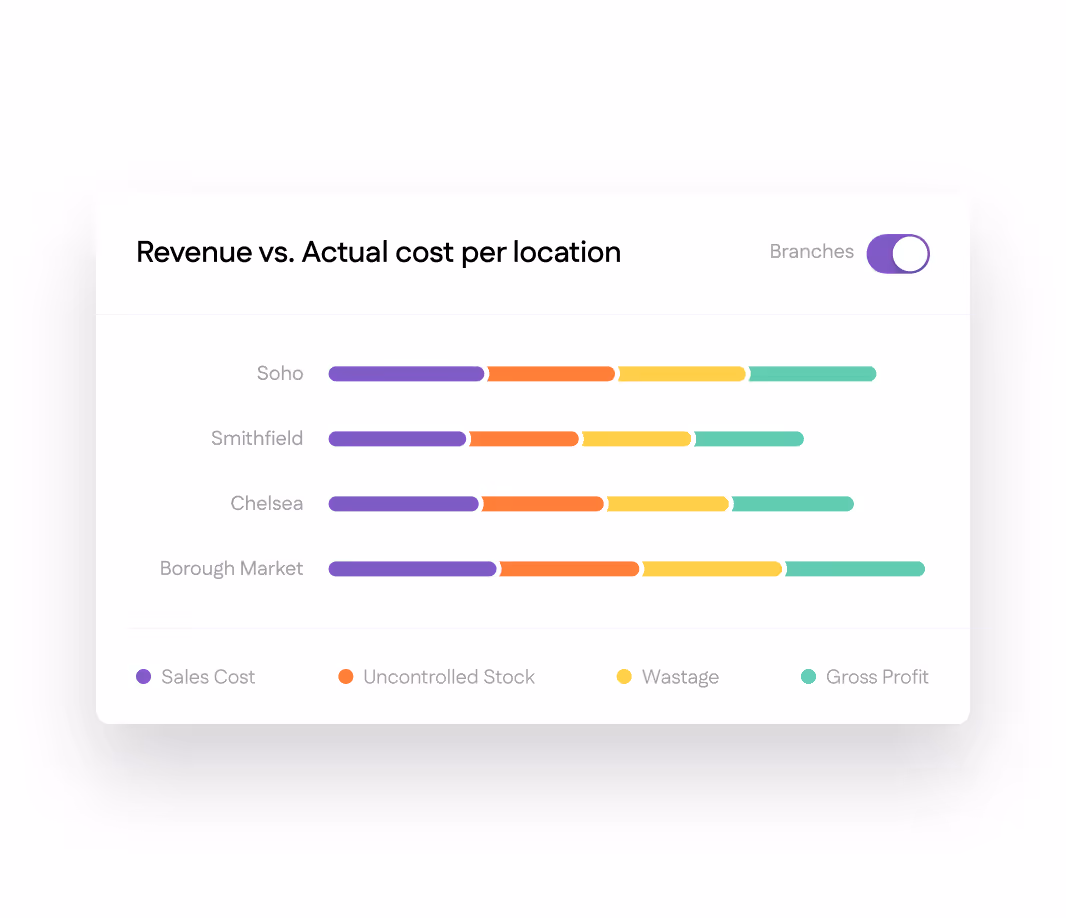
Location comparisons
Identify your best and worst performers instantly.
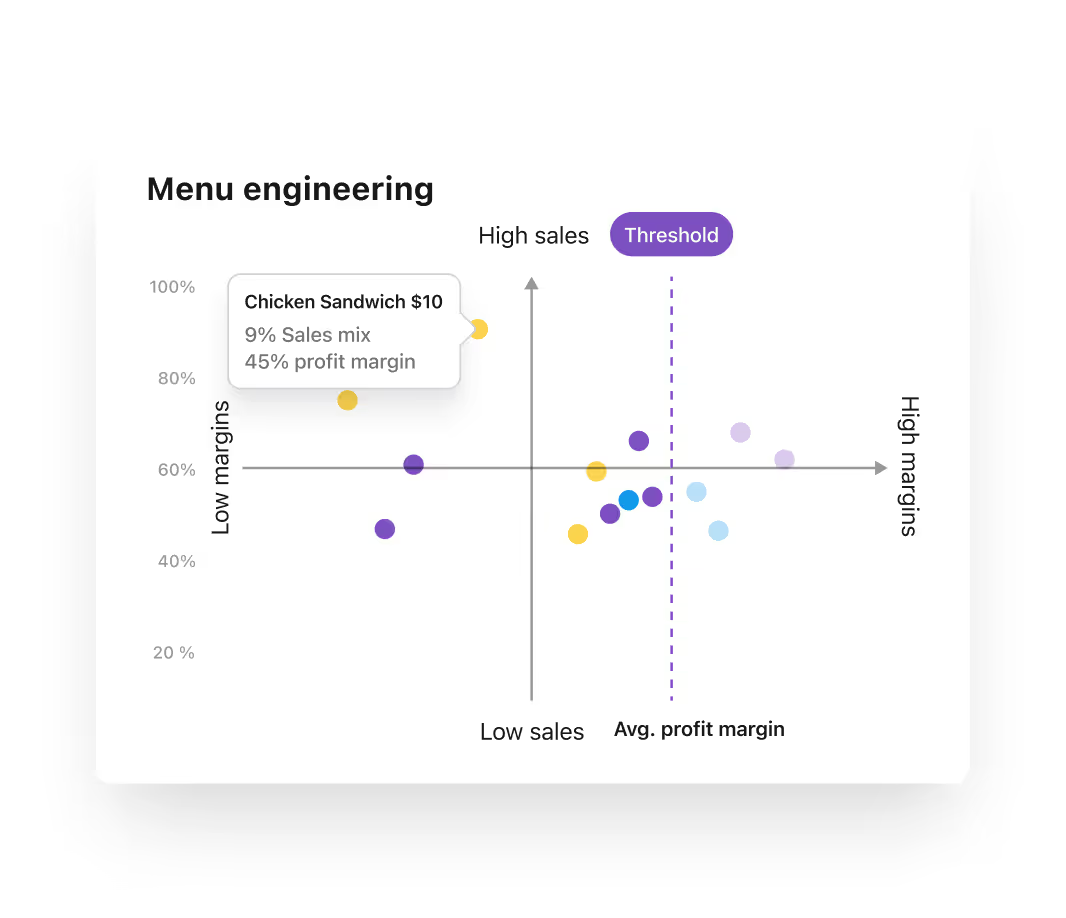
Root cause analysis
Drill into categories, dishes, and ingredients to see what’s driving results.
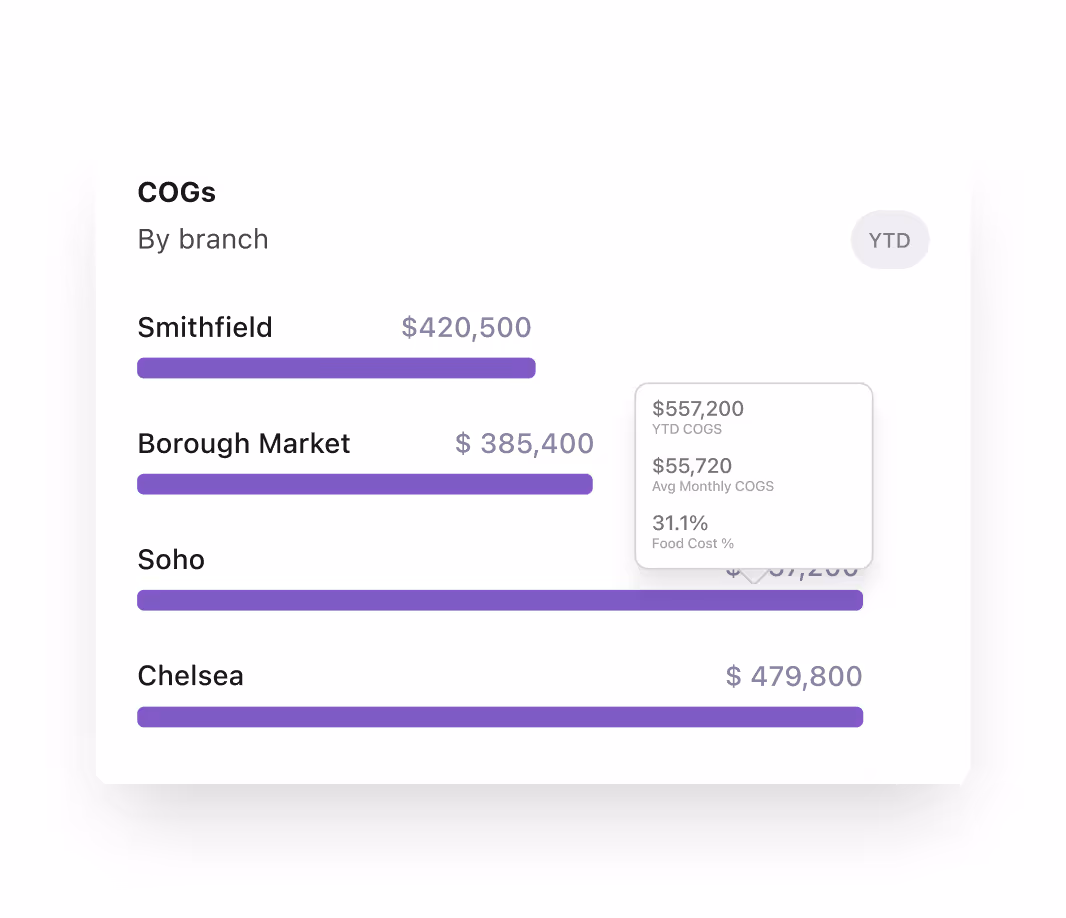
COGS & food cost dashboards
- Live visibility of cost of goods sold (COGS) and food cost percentage.
- Track in real time at group, site, or menu category level.
- Identify sudden cost spikes and act before they impact margins.
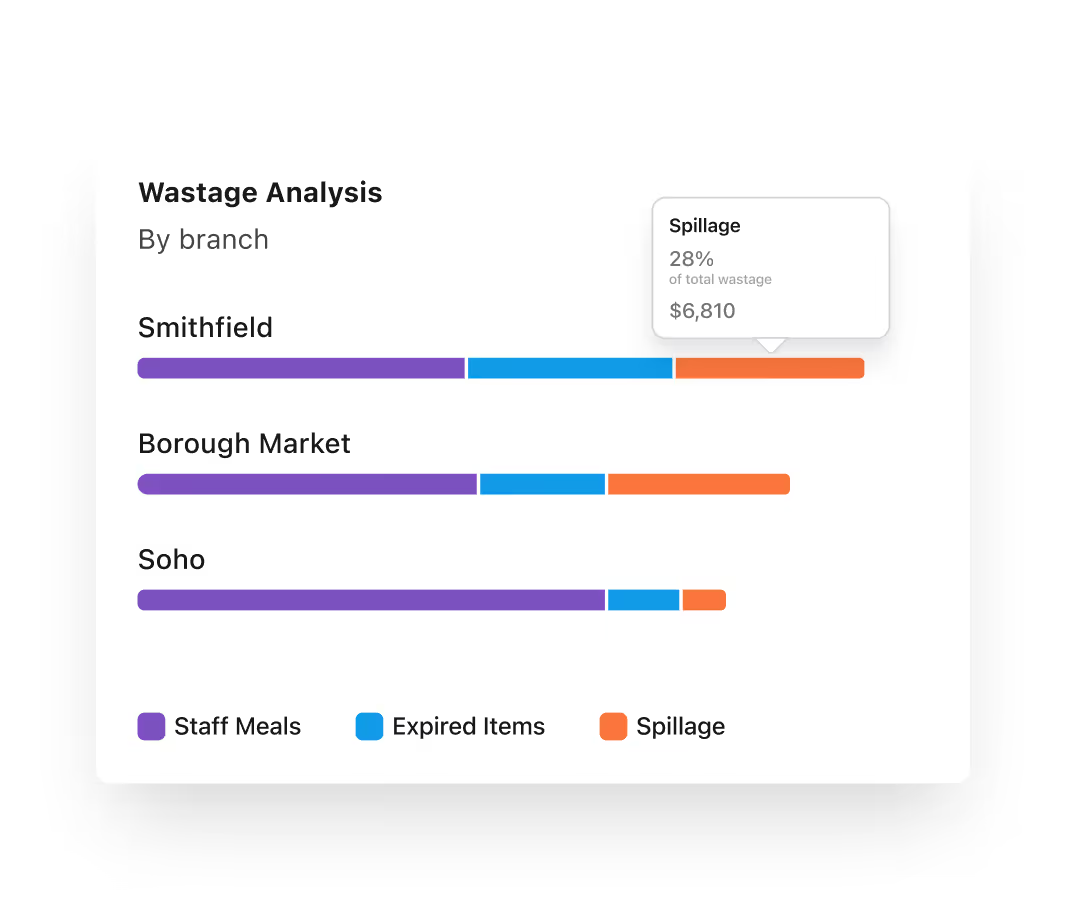
Variance & wastage insights
- See variances between theoretical and actual stock usage.
- Breakdown of wastage by type, site, and item, all visualised for quick understanding.
- Pinpoint high-cost waste and target operational fixes.
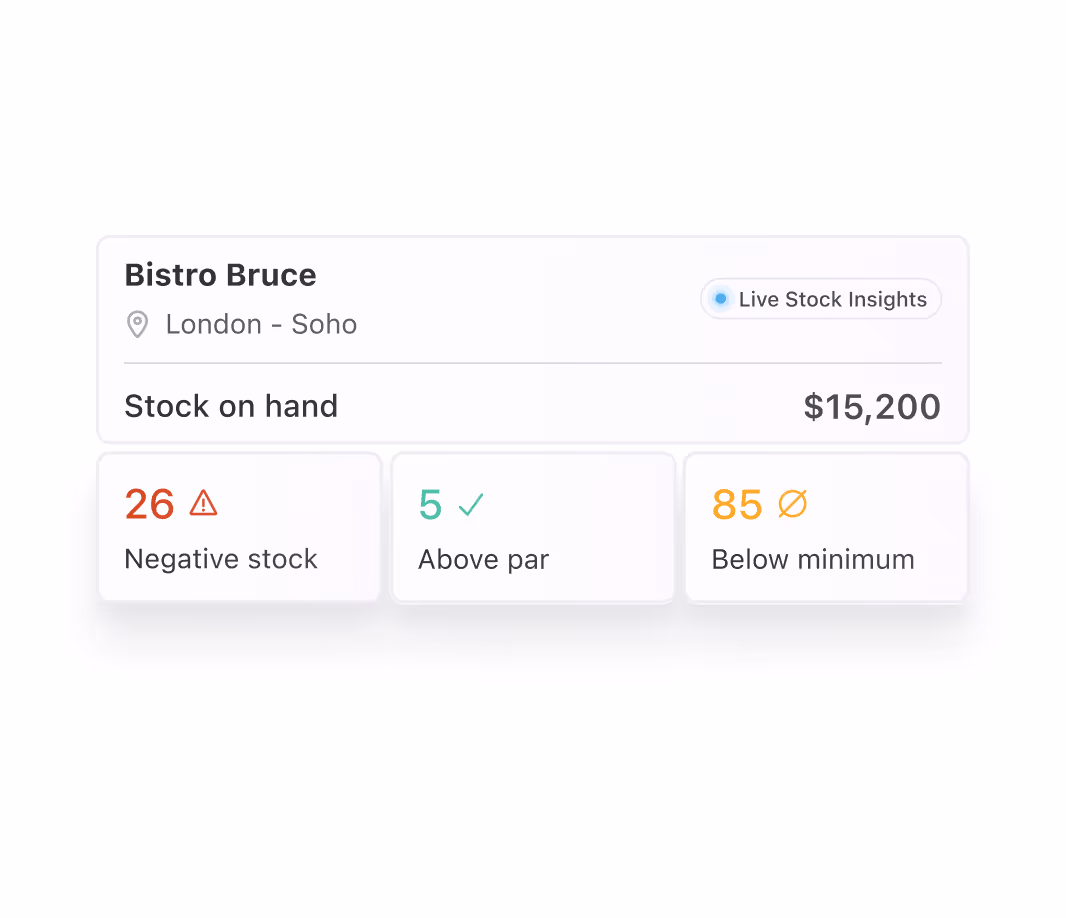
Usage & stock movement analytics
- Get a clear view of stock movement and usage across all locations.
- Identify slow-moving items by site or menu category.
- Spot trends over time to improve forecasting and menu planning.
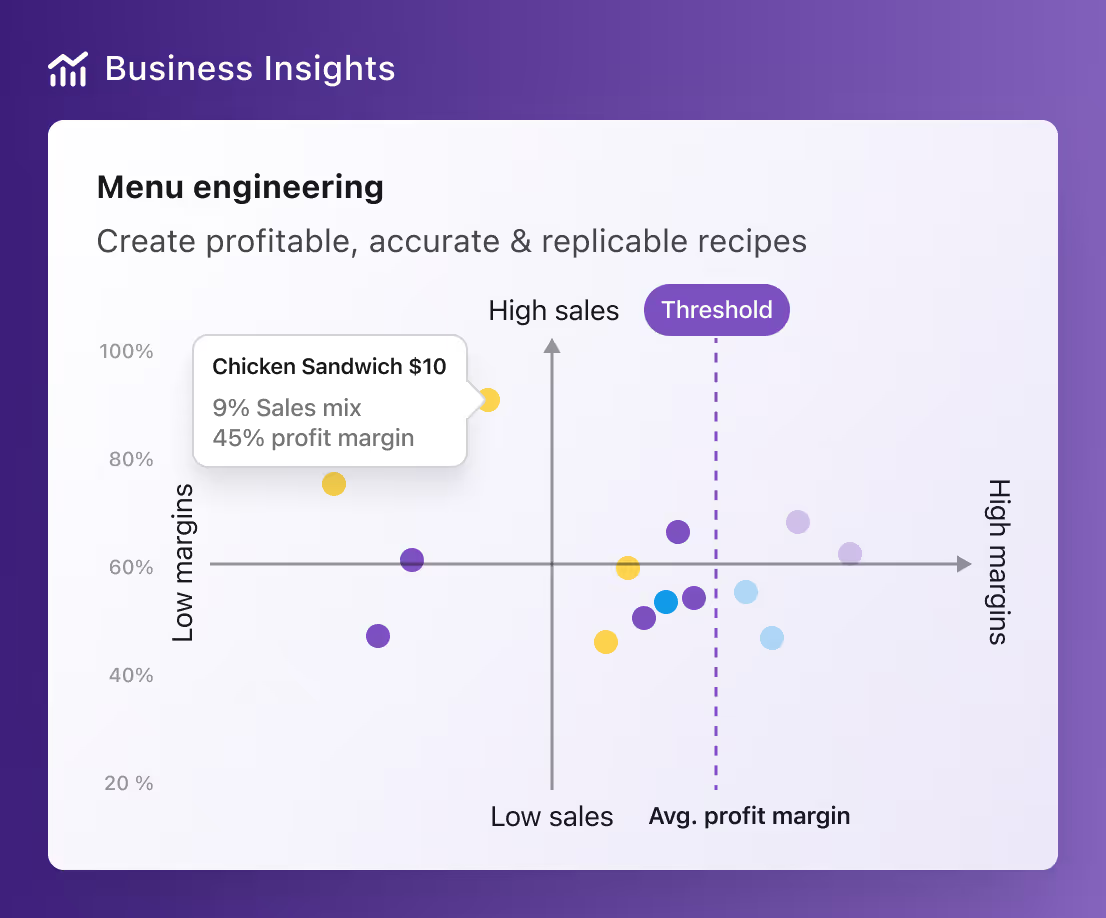
Profitability by site & category
- Compare site-by-site profitability at a glance.
- Drill down into menu category and dish-level margins.
- Use filters to see performance for specific time periods, brands, or regions.
Drill-down navigation & data export
- Start from a high-level KPI view, then click down to branch, category, or dish details.
- Export filtered views directly to spreadsheets for further analysis or sharing.
- Perfect for management meetings or quick decision-making.
COGS & food cost dashboards
- Live visibility of cost of goods sold (COGS) and food cost percentage.
- Track in real time at group, site, or menu category level.
- Identify sudden cost spikes and act before they impact margins.
Variance & wastage insights
- See variances between theoretical and actual stock usage.
- Breakdown of wastage by type, site, and item, all visualised for quick understanding.
- Pinpoint high-cost waste and target operational fixes.
Usage & stock movement analytics
- Get a clear view of stock movement and usage across all locations.
- Identify slow-moving items by site or menu category.
- Spot trends over time to improve forecasting and menu planning.
Profitability by site & category
- Compare site-by-site profitability at a glance.
- Drill down into menu category and dish-level margins.
- Use filters to see performance for specific time periods, brands, or regions.
Drill-down navigation & data export
- Start from a high-level KPI view, then click down to branch, category, or dish details.
- Export filtered views directly to spreadsheets for further analysis or sharing.
- Perfect for management meetings or quick decision-making.

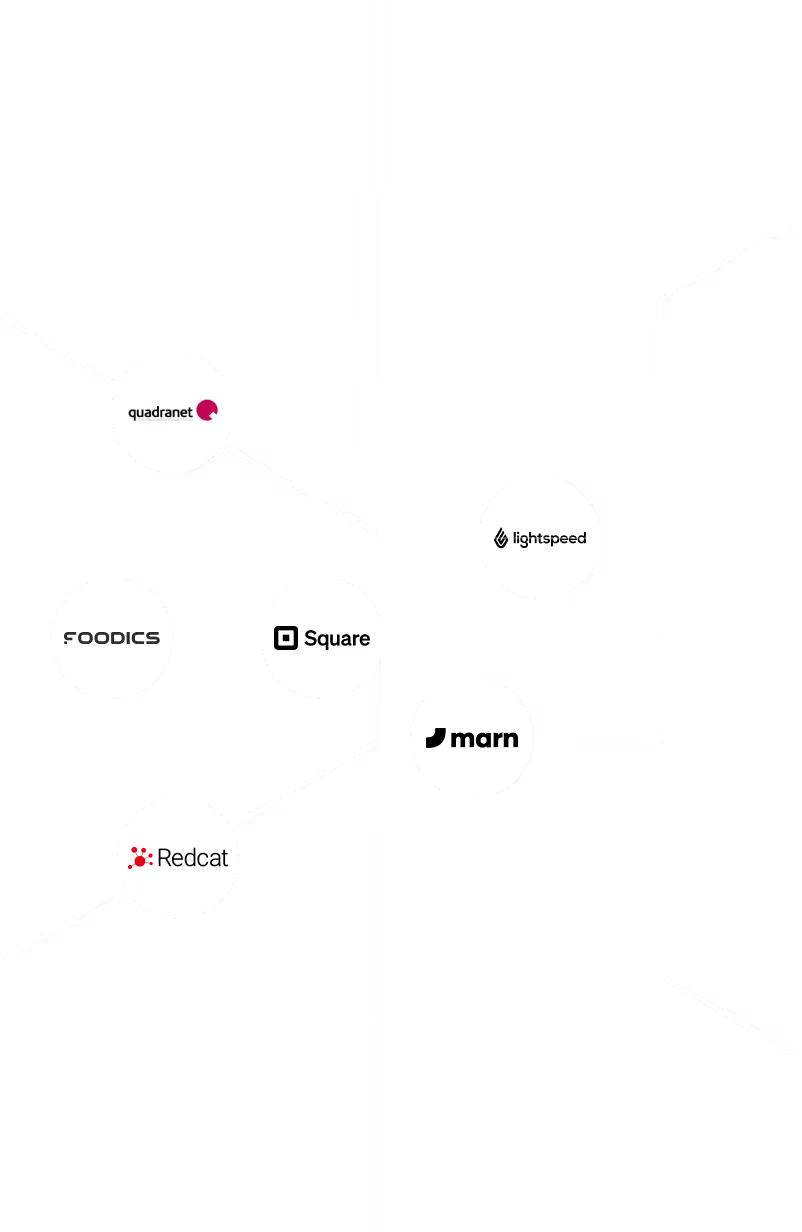
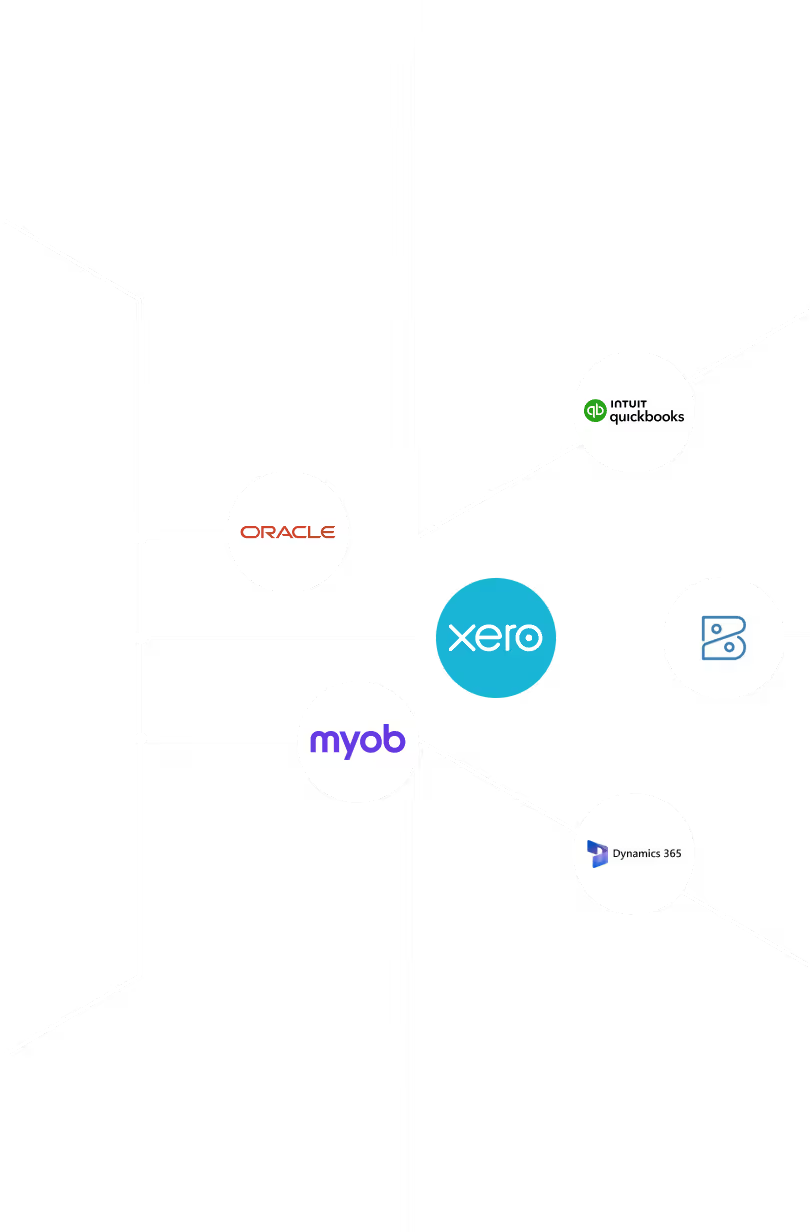
Over 75 integrations and counting
Connect Supy with all your favourite tools

Why our customers love us

.avif)


Why our customers love us


.jpg)


.png)


Our operational insights


Our operational insights


.png)
Ready to transform your operations?
Join 3500+ restaurant operators cutting costs, streamlining operations and making smarter decisions with Supy.
Your questions answered
Everything you need to know about Supy — from setup to integrations, pricing, and daily use. If it’s not covered here, just ask.
Yes, supy tracks ingredient costs and registers food waste. Not only that, Supy showcases the price fluctuations per ingredient and per
Yes, Supy has a mobile for both iPhone and Android.
Procurement is just the start
Supy is a full back-of-house platform — built to give multi-branch restaurants control over stock, data, and connected systems.
Seamlessly connect Supy with your existing tools and workflows.
Reduce waste, stop variance, and take charge of food costs across every site with real-time inventory tracking and live recipe cost visibility.
Raise requisitions, manage approvals, send Purchase Orders, order to central kitchen, and monitor price variances - on mobile or portal.