.jpg)


A Practical Guide to Menu Engineering for Multi‑Unit Operators
Running a restaurant isn’t just about great recipes; it’s about making sure every item you serve earns its place on the menu. That’s where menu engineering comes in. It’s the practice of analyzing each dish’s performance cost, popularity, margin and adjusting pricing, portions, promotions, or even removing items to maximise profits. When you operate multiple sites, menu engineering isn’t a nice‑to‑have; it’s essential for sustainable growth.
What is menu engineering, and why does it matter?
Menu engineering is a data‑driven process to optimize a menu’s profitability. It goes beyond listing dishes and prices. You look at what each item costs to produce (ingredients, prep time, waste) versus how much revenue it generates. Popular dishes with strong margins become stars; items that sell well but have thin margins are puzzles; low‑margin, low‑volume dishes are dogs and candidates for removal or rework.
For multi‑unit operators, menu engineering helps you:
- Standardize costs and margins across locations.
- Identify hidden losses due to waste or mis‑priced items.
- Make informed menu changes, like promoting high‑margin dishes or bundling slow movers with popular items.
- Improve ordering and production, since every recipe is tied to actual usage and forecasted demand.
Measuring menu item profitability
Operators typically start with contribution margin, the revenue from a menu item minus its direct food cost. For example, if a burger sells for $12 and costs $4 to make, its contribution margin is $8. The higher the contribution margin, the more that item contributes to covering labour, rent and other overheads.
However, contribution margin is only one lens. You should also track:
- Food cost percentage (cost divided by selling price). Lower percentages mean better margins.
- Sales volume: a high‑margin item that rarely sells contributes less than a modest‑margin bestseller.
- Prep time and complexity: dishes that require lots of labour or equipment tie up kitchen resources.
- Gross profit per labour minute: helpful for evaluating time‑consuming specials.
Combining these metrics gives you a balanced view of profit and operational efficiency.
Where manual analysis goes wrong
If you’re still looking at spreadsheets or gut feel, you’re likely missing opportunities. Common mistakes include:
- Ignoring real usage: many operators base cost on theoretical recipe quantities, but actual portioning, waste and prep loss can be very different.
- Treating all locations the same: a dish may be a star downtown but a dog in a suburban store due to local tastes or supplier pricing.
- Focusing only on percentage margins: a dish with a 65 % margin but low sales might earn less total profit than a 55 % margin dish that sells ten times more.
- Missing overhead costs: prep labour, packaging or kitchen space aren’t in the food cost but affect profitability.
- Lack of integration: sales data, purchases and recipes live in different systems, making it hard to see the full picture.
Sales and food cost data: identifying stars and dogs
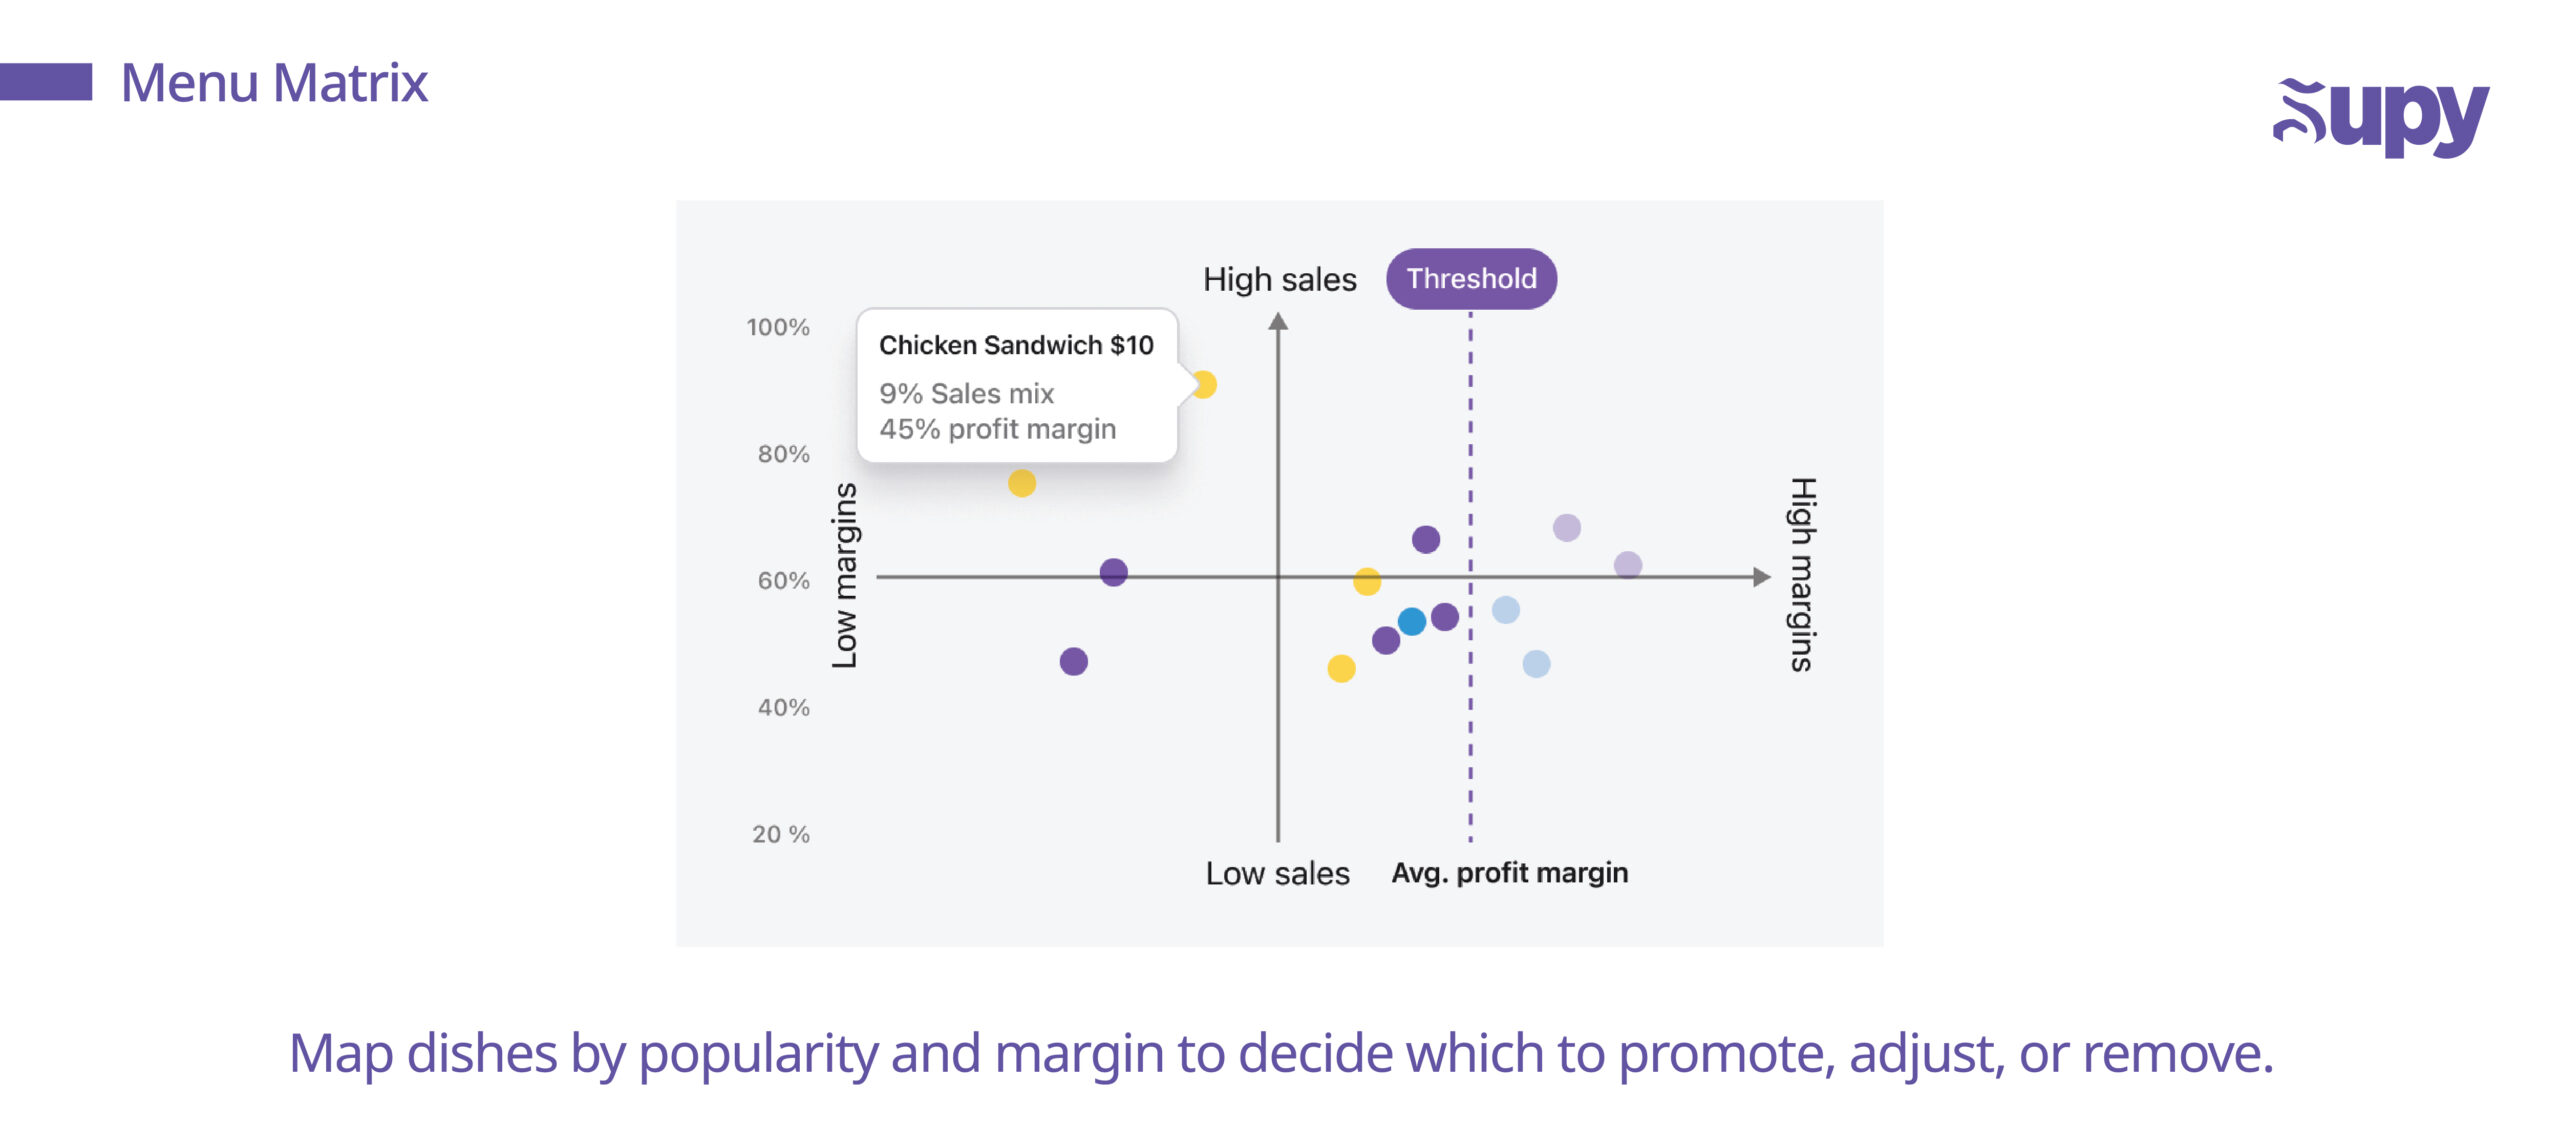
The classic menu matrix plots contribution margin on one axis and popularity on the other. Items in the top‑right corner (high margin, high popularity) are stars. Top‑left are puzzles (high margin, low popularity), bottom‑right are plow‑horses (low margin, high popularity), and bottom‑left are dogs. Sales data shows popularity; food cost data shows margin. When you overlay these two datasets, patterns emerge:
- A “puzzle” dish might need repositioning on the menu or a promotional push.
- A “plow‑horse” could be redesigned—reduce portion size or increase price to improve margin without hurting sales.
- A “dog” might be removed unless it’s critical for variety or guest satisfaction.
Why contribution margin matters
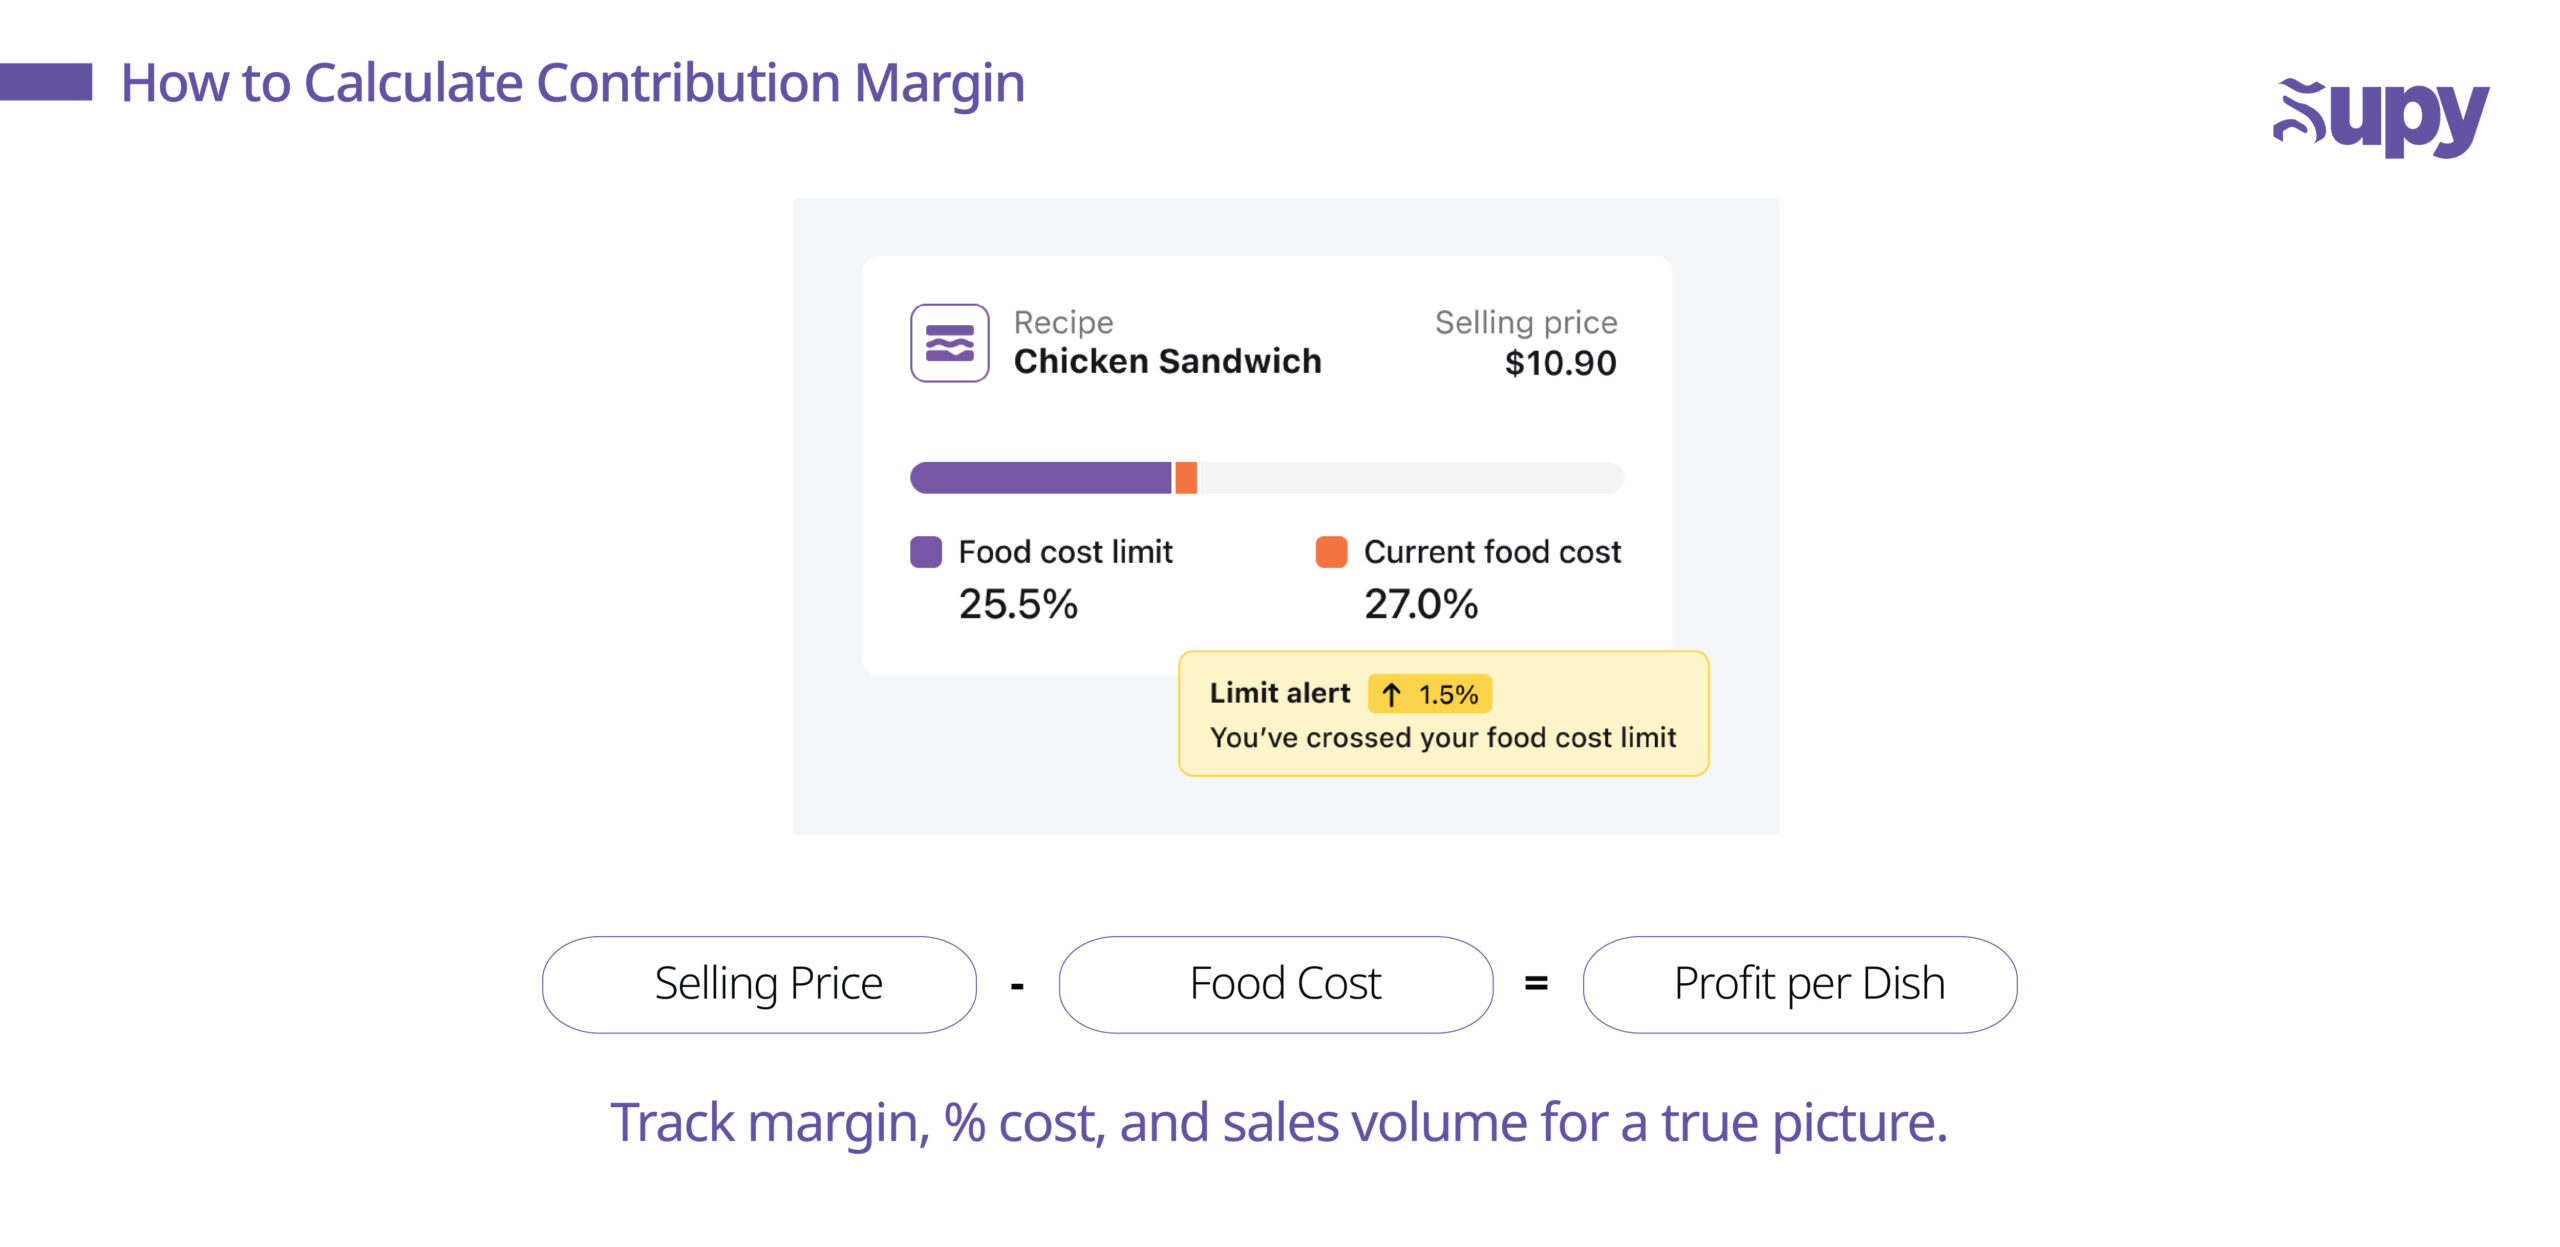
Contribution margin tells you how much each sale adds to the pot after paying for ingredients. Without it, you’re guessing. It helps answer questions like:
- Can we afford to include that new seafood dish?
- Should we bundle side dishes to encourage add‑on sales?
- What’s the profitability impact of switching to a higher‑quality ingredient?
When margins dip because of supplier price hikes, you see it immediately and can renegotiate, change recipes, or adjust prices. You also avoid under‑pricing items simply because competitors charge less.
Scaling menu engineering from 5 locations to 50
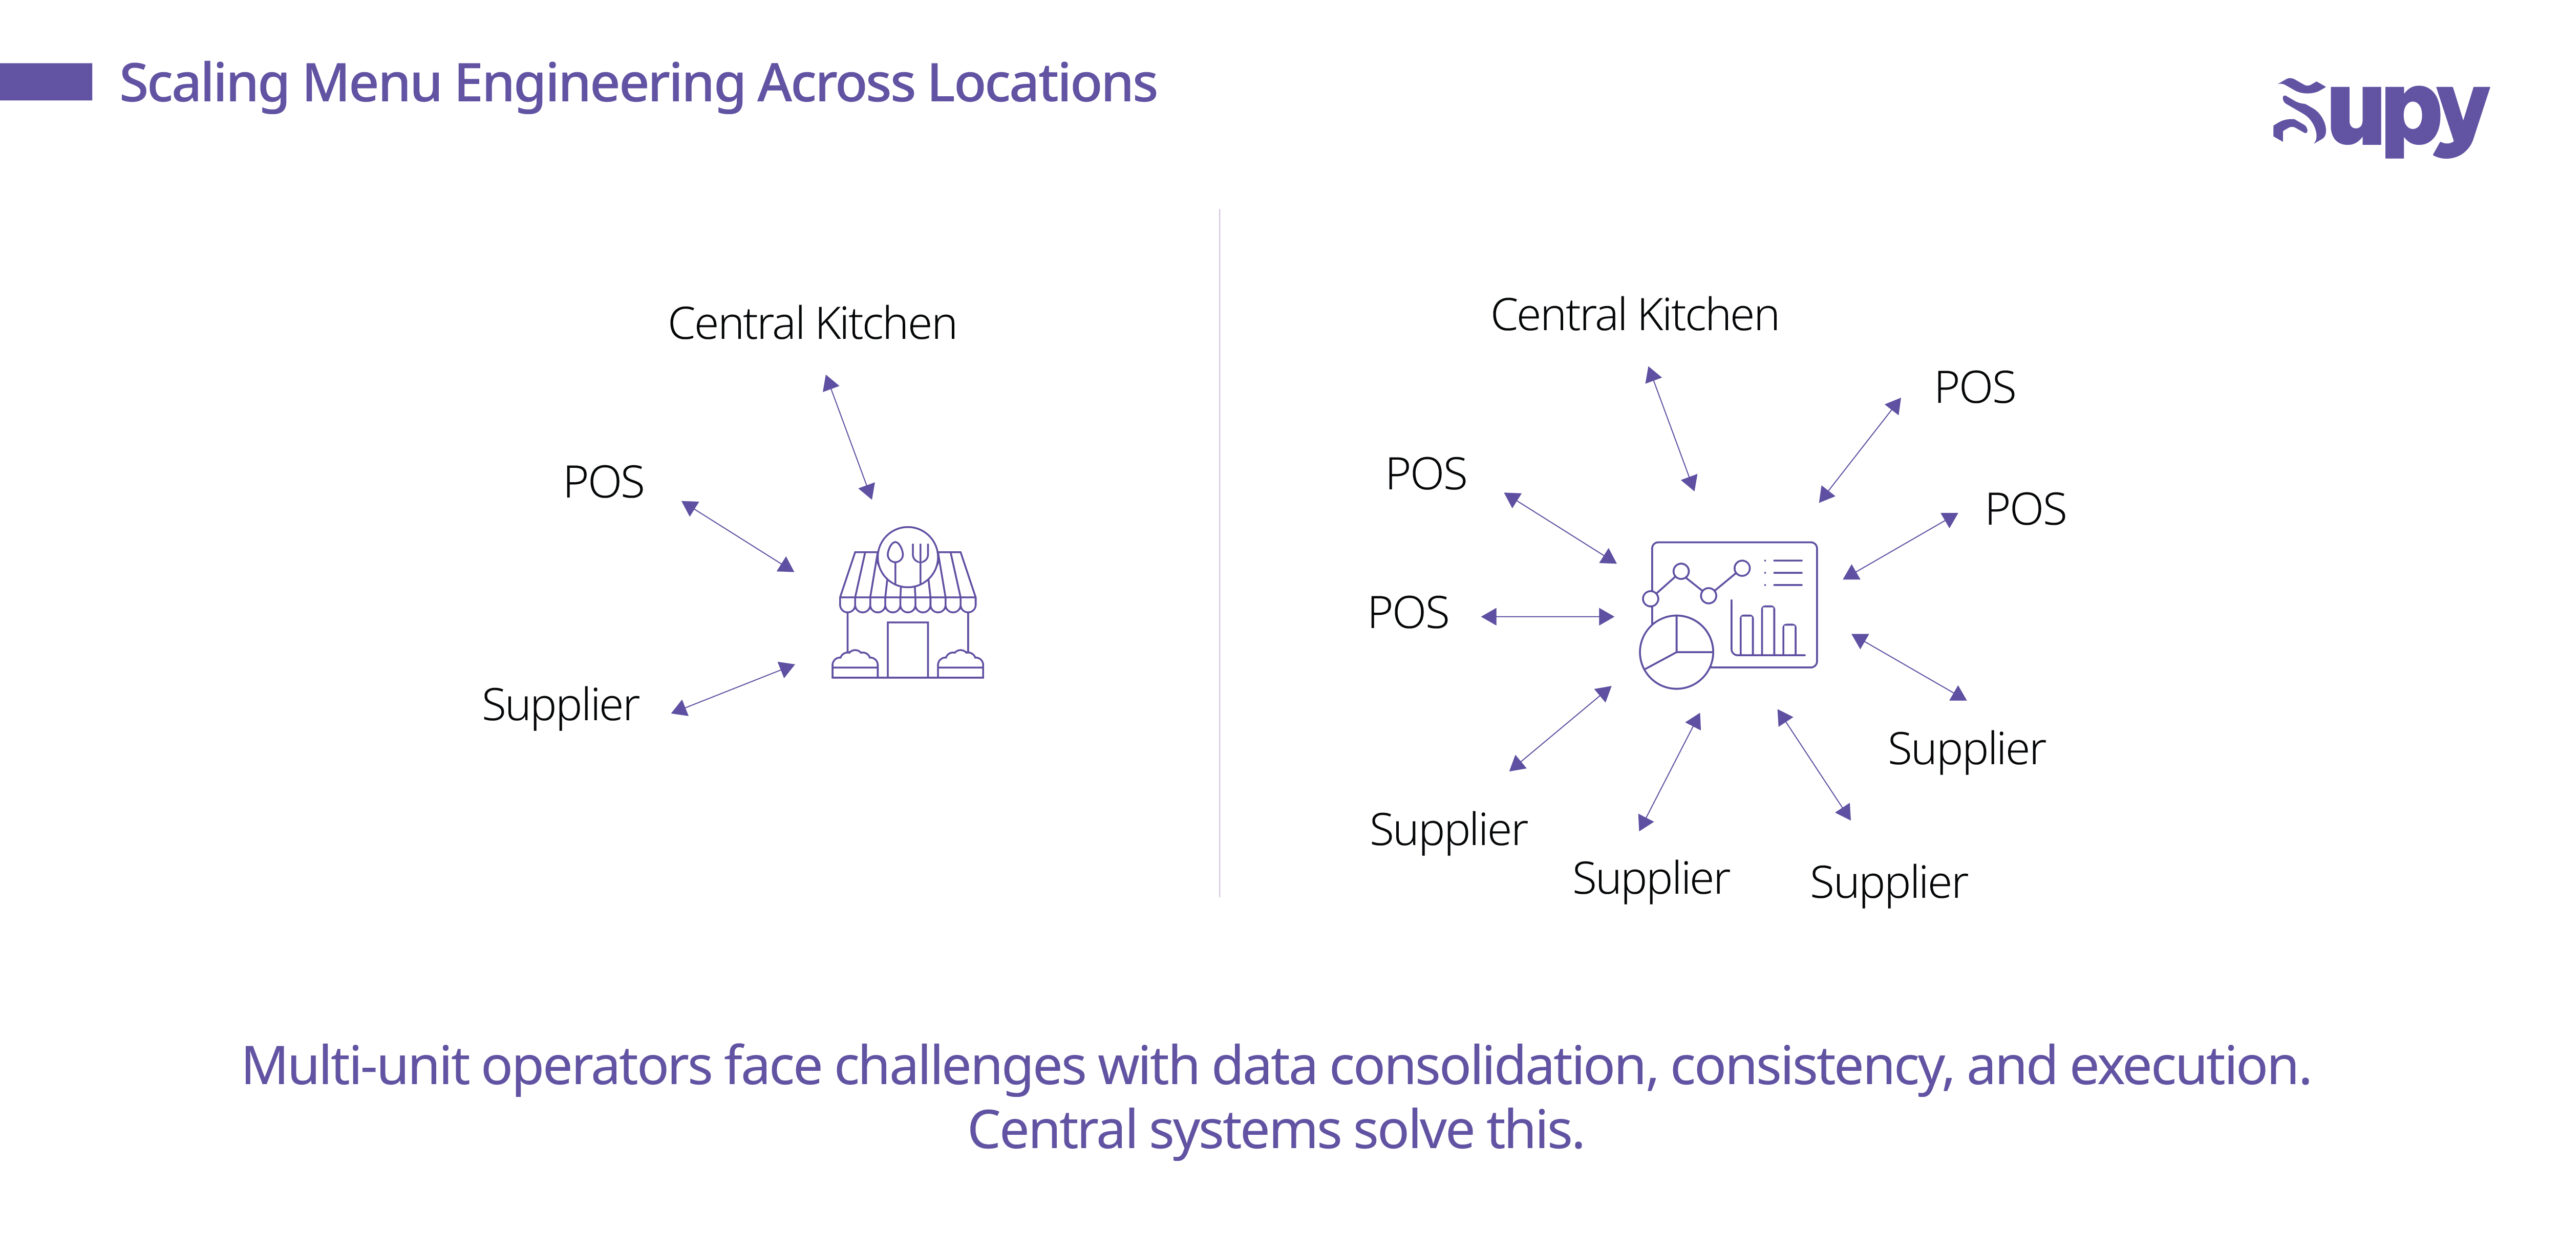
At five locations, you might manage menu data in spreadsheets. At 50, manual processes break. Challenges include:
- Data consolidation: bringing together sales, recipe and cost data from multiple POS systems and suppliers.
- Consistency vs. localisation: balancing brand standards with regional tastes or cost variations.
- Change management: rolling out price or recipe changes across dozens of sites without errors.
- Monitoring execution: ensuring staff follow updated recipes and portion sizes.
Platforms like Supy automate data capture and provide dashboards that highlight anomalies. For example, if one location’s food cost spikes for a menu item, you can investigate whether it’s due to supplier pricing, over‑portioning, or errors in inventory counts.
Practical examples of menu engineering
Here’s how operators use menu data to drive action:
- Adjusting portion sizes: One chain realized its chicken caesar salad used twice the recipe amount of Parmesan. Reducing it by 10 g saved thousands annually without guest complaints.
- Bundling items: By pairing a low‑selling side (acai bowls) with a popular brunch main, a café increased average check value and sold through slow inventory.
- Promoting high‑margin add‑ons: Servers were encouraged to suggest premium toppings on burgers, adding $2 per sale at negligible cost.
- Removing dogs: A sushi bar dropped a labour‑intensive roll that barely sold. Removing it freed prep time for bestsellers.
Using forecasting for seasonal menus and LTOs
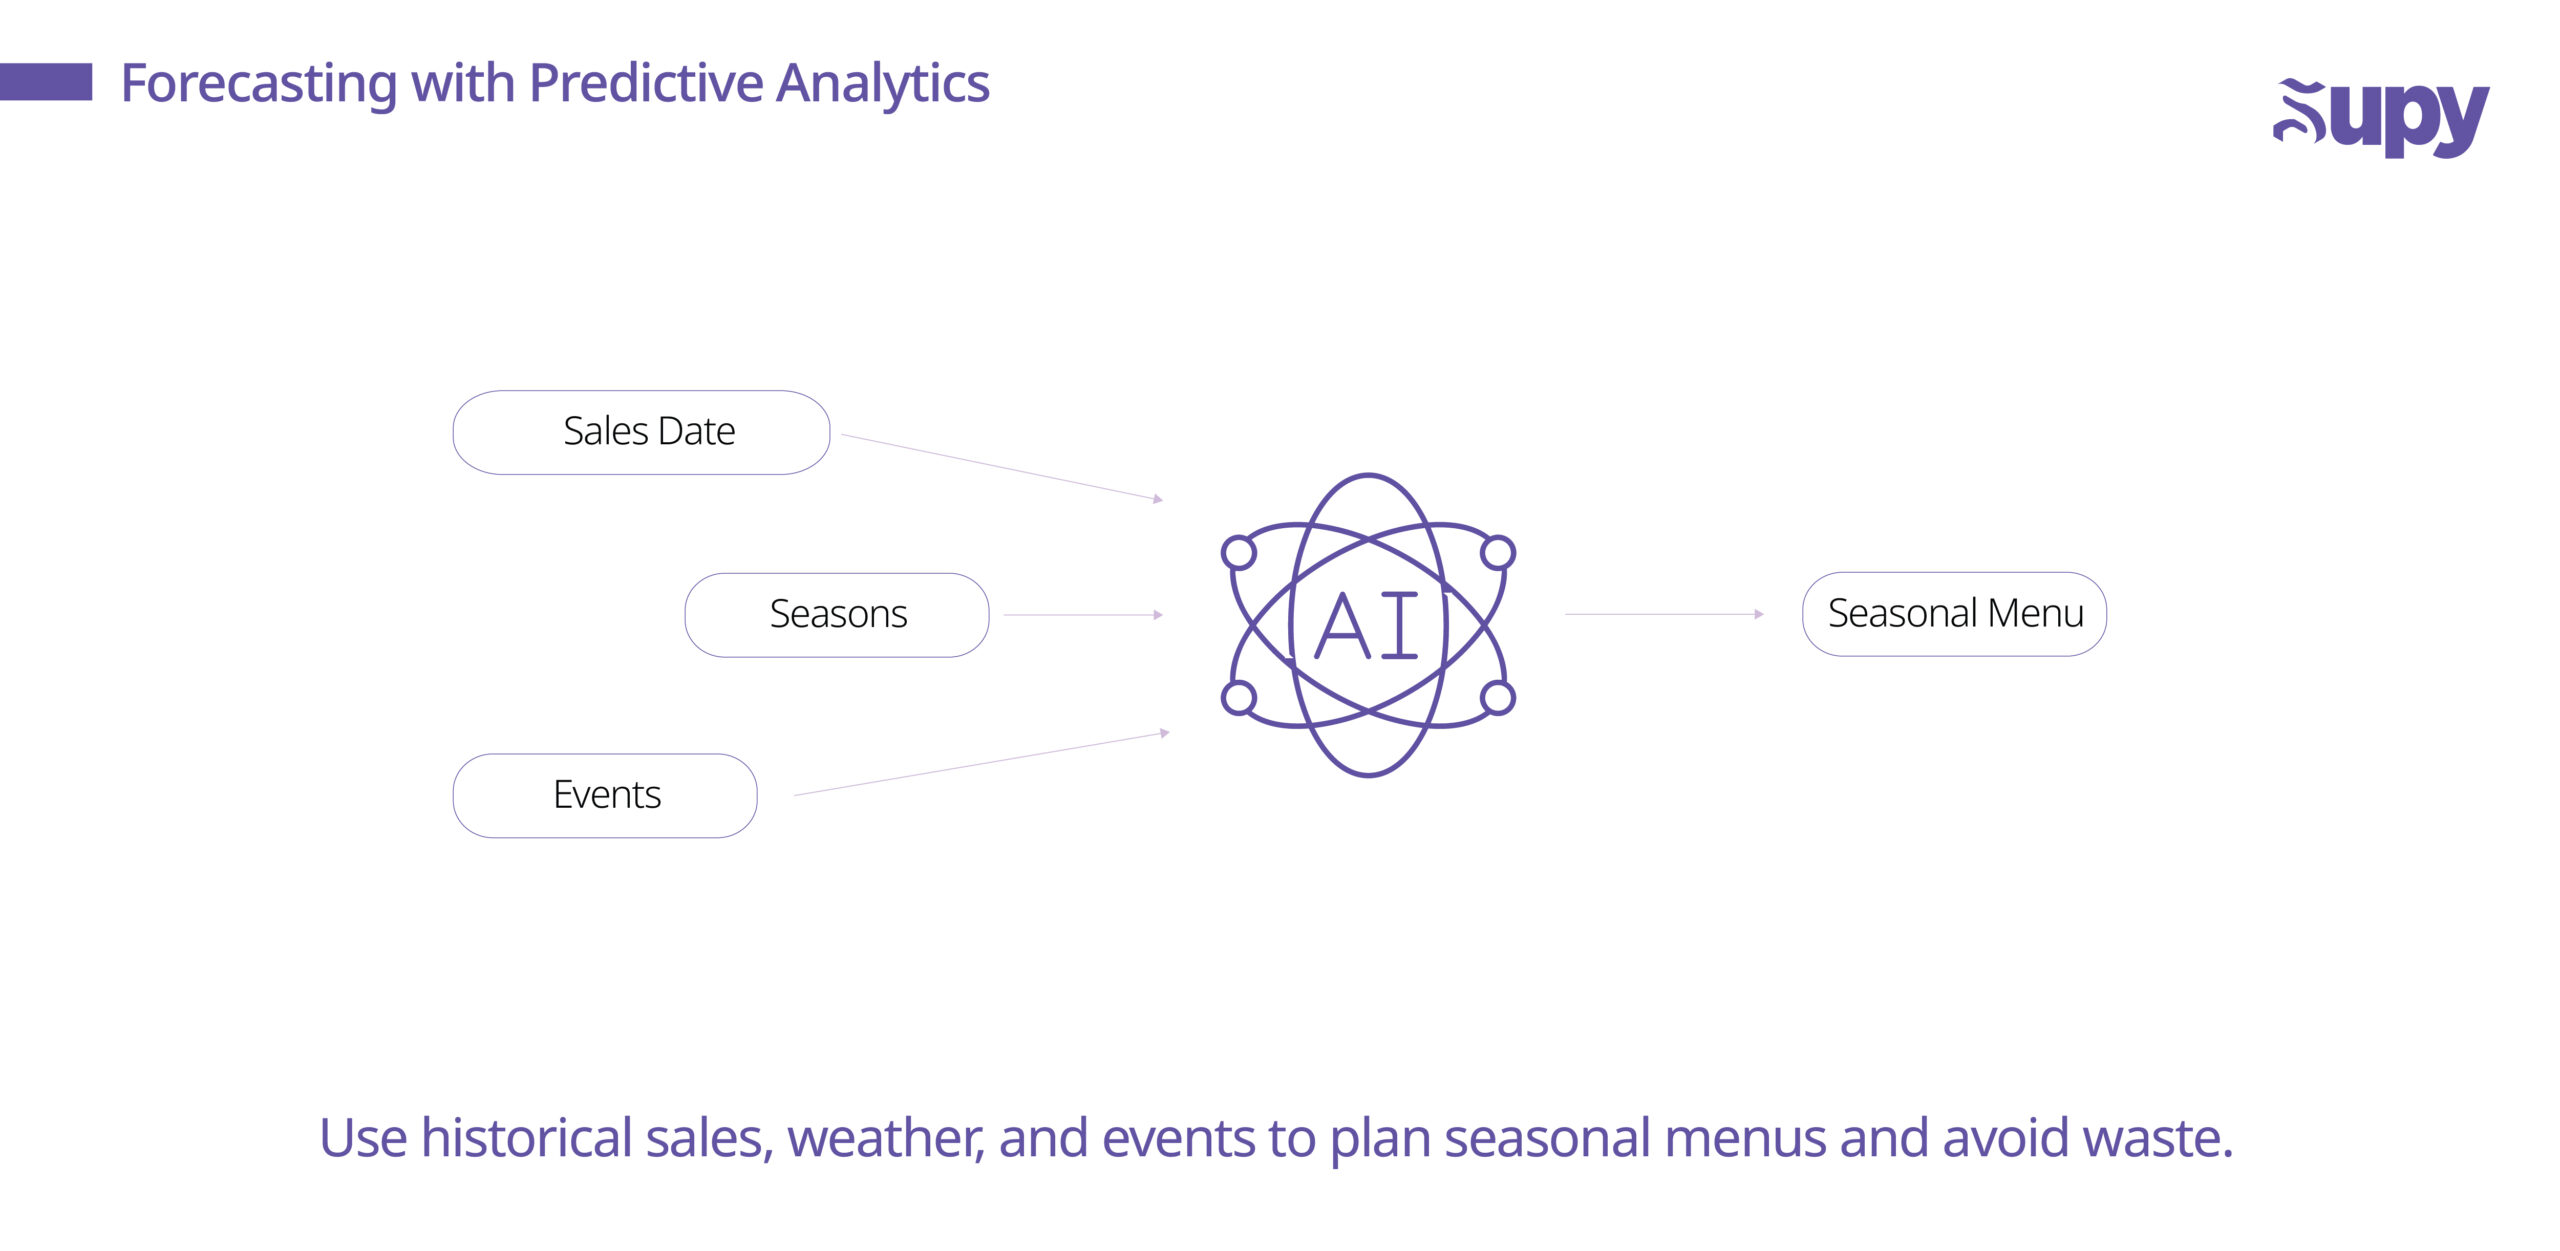
Predictive analytics help you plan for seasonal spikes or limited‑time offers (LTOs). By analyzing historical sales, weather, holidays and local events, you can forecast demand and adjust prep accordingly. For example:
- A smoothie chain uses forecasts to prep more tropical blends in summer and warm drinks in winter, reducing waste.
- A burger concept tests an LTO spicy chicken sandwich, using predictive models to set inventory levels so they don’t run out or over‑produce.
Forecasting isn’t just about volumes; it helps with pricing and marketing. If a limited‑time item performs well, you know whether to make it permanent or bring it back next year.
KPIs to track beyond sales and food cost
Refining a menu requires a holistic view. Consider tracking:
- Gross profit per dish: contribution margin multiplied by sales volume.
- Average check value and attachment rate for add‑ons.
- Waste percentage per ingredient or dish.
- Prep time vs. revenue: dishes that tie up kitchen capacity without commensurate revenue can reduce throughput.
- Menu mix variance: how the sales mix deviates from your ideal, affecting overall food cost.
- Customer feedback: star dishes may still need tweaks if guests complain about value or portion size.
The future of menu engineering
Looking ahead, menu engineering will become more automated and integrated:
- AI‑driven insights will predict profitability for new menu concepts before you launch them.
- Dynamic pricing could adjust based on demand, daypart or supply costs.
- Sustainability metrics (e.g., carbon footprint per dish) may influence menu design and marketing.
- Real‑time monitoring will alert managers to portion discrepancies as they happen, reducing shrinkage.
- Guest personalisation may tailor menus based on loyalty data or dietary preferences.
To stay competitive, operators need systems that consolidate sales, recipes and costs into one clear view. That’s where Supy shines. Instead of juggling spreadsheets and guessing, you have a single source of truth, plus forecasting, variance alerts and integration with your POS and suppliers.
Conclusion
Menu engineering isn’t just a buzzword, it’s a roadmap to healthier margins and happier guests. If you’re juggling spreadsheets or making decisions on gut feel, it’s time to upgrade your toolkit.
- Listen to our latest operator interview on X — real talk from an owner who increased margins by 12 % after re‑engineering their menu.
- Book a demo with Supy: see how our platform helps you analyze menu data across multiple sites, forecast demand and automate inventory. Schedule your demo now and start turning data into profit.