Food cost

Multi-Site Restaurant Gross Profit Reporting: See Each Site, Not the Group

Cost Per Location report showing food cost by site for a multi-site restaurant group

Start With the Group Number, Then Stop Trusting It

Multi-site gross profit reporting lets you see the number for every location at once and act on the one site that needs it. It starts with a single group figure, then deliberately takes it apart, because a blended food cost percentage can sit on target while one restaurant runs well over. The group average tells you the group is fine. The per-site view tells you where to work.

Supy's Cost Overview report gives you that first read: a single-sheet, group-level cost of goods summary across every selected location. It is the fast health check before you drill in. The trap is stopping there. Say your group target is 30% and the blended figure lands at 31%. That looks like a rounding error, not a problem. Underneath it, one outlet can be running at 40% while the others sit near target, and the average buries it. If your reports show the wrong cost of goods for a different reason, that is a separate fix covered in why your restaurant P&L shows the wrong COGS.
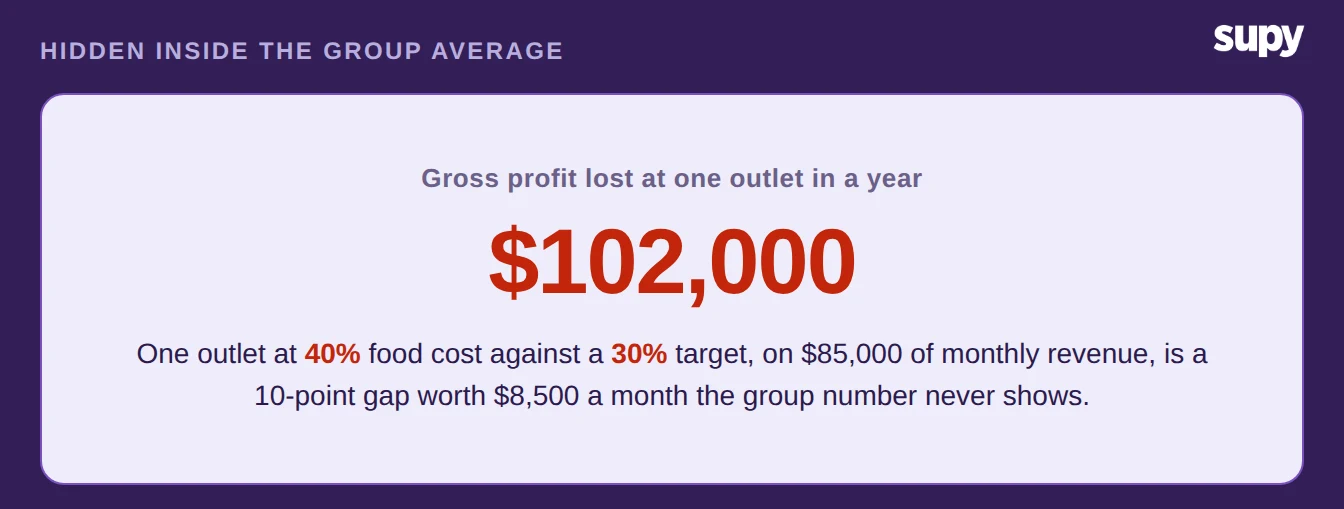
Annual gross profit hidden inside a healthy group food cost average

Read Food Cost as a Share of Revenue, Site by Site

The group number becomes useful the moment you split it per location. Supy's Cost Per Location report does this across five tabs. They cover a group cost of goods overview, a per-item breakdown, quantities consumed, a category summary, and per-location detail. For each site it calculates actual food cost as a percentage of total revenue, so you can benchmark every location against the same line.

Now the hidden site shows itself. In the example group, City Centre sits at 29%, North Branch at 28%, and Harbour View at 31%, all near the 30% target. The Airport Outlet reads 40%. That is the site to work on, and you found it in one sorted view rather than by feel. You can sanity-check a single site's number against its recipes with a food cost calculator before you dig deeper.
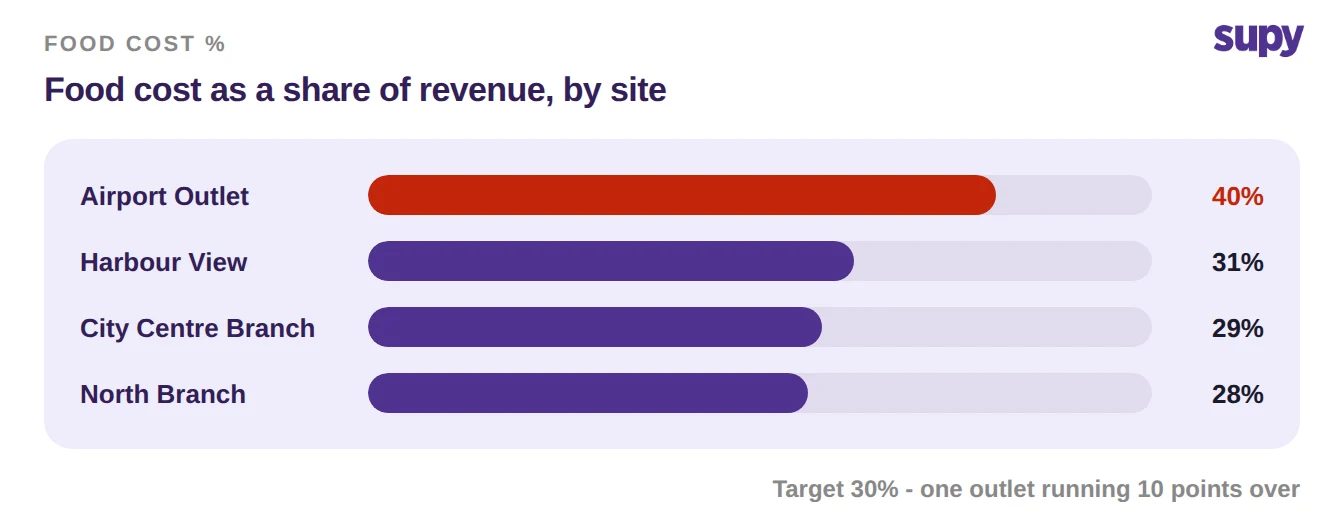
Food cost as a percentage of revenue by branch with one outlet over target

Drill From the Site Into the Dishes and Channels

Finding the site is the start, not the answer. Supy's Sales and Menu Engineering report analyses recipe-level profitability across locations. It shows which dishes carry margin and which do not, split by sales type such as dine-in versus delivery. So you take the flagged Airport Outlet and open its menu, one dish at a time.

The channel split is where a lot of gross profit leaks. Delivery carries commission, so the same dish earns less through an app than across the pass. When a site skews to delivery, its blended margin falls even though the kitchen is doing nothing wrong. Reading margin by dish and by channel tells you whether the fix is a recipe, a price, or the channel mix.

DishDine-in gross marginDelivery gross margin
Signature Burger68%54%
Grilled Chicken Bowl71%61%
Loaded Fries74%58%

Report Off Stock-Count Dates, Not the Calendar

A per-site number is only worth acting on if it is true. Supy's cost reports use stock-count dates as the reporting boundary, not calendar dates, so the figures reflect what was actually counted and used between counts. That is what makes a reported gross profit trustworthy rather than a calendar estimate.

This matters because two numbers move at different speeds. Theoretical cost of goods is available daily, from recipes and sales, and it is your early warning. Actual cost of goods needs a physical stock count to confirm it. If you count monthly, your actual figure can be up to 30 days old between counts. So you watch the theoretical number day to day and lock the truth to each count. Reading a site against its own latest count keeps the comparison honest.
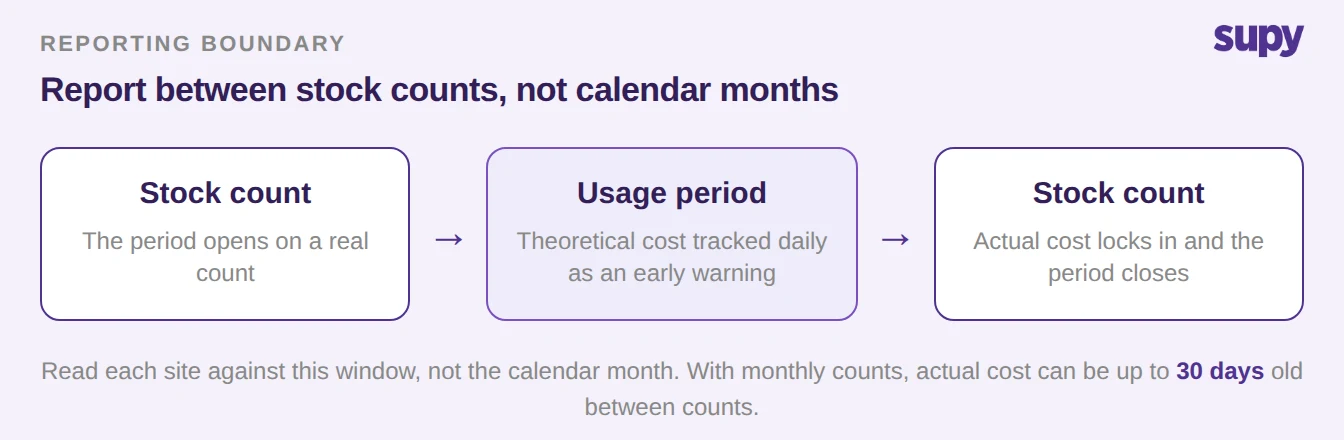
Reporting window between two stock counts with theoretical cost running daily

Start this week with the group. Pull the Cost Overview, then open Cost Per Location and sort by food cost as a percentage of revenue. If a site sits more than a couple of points above your target, that is where gross profit is leaking. In the example, the Airport Outlet at 40% against a 30% target is a 10-point gap worth about $8,500 a month, or $102,000 across a year on $85,000 of monthly revenue.

Then narrow to that one site. Open the Sales and Menu Engineering report for it, compare dine-in against delivery margin on its top sellers, and confirm the numbers are anchored to its latest stock count. One site, one report, one number to move beats staring at a healthy group average that never tells you where to look. For what a healthy result looks like across a group, see average restaurant profit margin, and to run the whole read in one place, see Supy's restaurant analytics.


Book a Demo with Supy for restaurant gross profit reporting

Ready to optimize your restaurant operations?

Blog

Our operational insights

No items found.

Your questions 
answered

Everything you need to know about Supy — from setup to integrations, pricing, and daily use. If it’s not covered here, just ask.

What is multi-site gross profit reporting?
+

Multi-site gross profit reporting is the practice of reading gross profit for each restaurant in a group separately, rather than as one blended figure. You start with a group-level cost of goods summary for the quick health check, then split it per location to see food cost as a percentage of revenue at every site. The point is to find the one outlet running over target that a group average hides. It turns a single reassuring number into an actionable per-site view that tells you exactly where to work first.

Why can a healthy group food cost percentage still hide a problem?
+

Because a blended average smooths out the sites that are running well against the one that is not. If most locations sit near a 30% target and one runs at 40%, the group figure can still land around 31%, which looks like a rounding error. The strong sites are quietly subsidising the weak one in the reporting. Only when you read food cost per location does the outlier appear. A group number confirms the group is broadly fine; it never tells you which restaurant is dragging the average down or by how much.

How do you find which location is running over on food cost?
+

Open a report that calculates actual food cost as a percentage of total revenue for each site, then sort the locations by that figure. Supy's Cost Per Location report does this across five tabs, from a group overview down to per-location detail, so every site is measured against the same line. The outlet sitting well above your target is the one to work on. In the worked example, three sites sit near 30% and the Airport Outlet reads 40%, so it surfaces in a single sorted view instead of by guesswork.

How does delivery change gross profit dish by dish?
+

Delivery carries channel commission, so the same dish earns a lower margin through an app than it does across the pass. A dish that returns a 68% gross margin dine-in can drop to 54% on delivery once the commission is applied. When a location skews heavily to delivery, its blended margin falls even though the kitchen and the recipe are unchanged. Reading margin by dish and by sales type separates a recipe or pricing problem from a channel-mix problem, which are fixed in completely different ways.

Why report off stock-count dates instead of calendar months?
+

Because a reporting period that ends on a stock count reflects what was actually counted and used, while a calendar month ends on an estimate. Supy's cost reports use stock-count dates as the reporting boundary for exactly this reason. Tying gross profit to real counts is what makes the figure trustworthy rather than a projection. If you close a period on the last day of the month but only count stock a week later, the two never line up, and the variance you see is partly a timing artefact rather than a genuine cost movement.

What is the difference between theoretical and actual cost of goods?
+

Theoretical cost of goods is what your recipes and sales say you should have used, and it is available daily as an early warning. Actual cost of goods is what a physical stock count proves you really used, and it needs that count to confirm. If you count monthly, the actual figure can be up to 30 days old between counts, so the two numbers move at different speeds. The practical approach is to watch the theoretical number day to day for drift, then lock the truth to each stock count.

Which Supy reports show gross profit across every location?
+

Three reports work together. The Cost Overview gives a single-sheet, group-level cost of goods summary for a fast cross-site health check. The Cost Per Location report breaks that down across five tabs and shows actual food cost as a percentage of revenue for each site. The Sales and Menu Engineering report then drills into recipe-level profitability by location and by sales type, such as dine-in versus delivery. Together they take you from one group number, to the site running over, to the specific dishes and channels behind it.

Ready to transform your operations?

Join 3500+ restaurant operators cutting costs, streamlining operations and making smarter decisions with Supy.