.jpg)


How to Calculate Food Cost Percentage: Formula, Examples and Benchmarks

Food cost percentage measures how much of your revenue is consumed by the cost of the food you serve. To calculate it, you need three numbers from a given period: opening stock value, total purchases, and closing stock value. The formula is:
Food Cost % = (Opening Stock + Purchases - Closing Stock) / Food Sales × 100
For most restaurant formats, a well-managed food cost percentage sits between 28% and 35%. Operators above 38% are losing margin on every plate - those below 25% are either running a highly beverage-led operation or controlling costs with unusual precision. This guide walks through the full calculation with a worked restaurant example, industry benchmarks by format, and the common errors that inflate your number even when your suppliers have not changed their prices.
What Is Food Cost Percentage?
Food cost percentage is a profitability metric that expresses your ingredient spend as a proportion of food revenue. If you spent $4,700 on food and earned $14,280 in food sales during the same period, your food cost percentage is 32.9%.
The metric sits at the centre of restaurant financial management because it is the most direct measure of whether your purchasing, portion control, and menu pricing are aligned with your margin targets. A restaurant can be busy and still unprofitable if food cost percentage runs unchecked. Understanding the calculation is the first step; understanding why it sits at a particular level - and how to bring it down without compromising quality - is the harder, more valuable work.
Before you can calculate food cost percentage accurately, you need reliable inventory data. A consistent stocktake process and an accurate record of every purchase during the period are prerequisites. Our free restaurant inventory management template is a practical starting point for operators building this discipline from scratch.
The Food Cost Percentage Formula
The standard calculation has two components.
Step 1 - Calculate Total Food Cost:
Total Food Cost = Opening Stock + Purchases - Closing Stock
Step 2 - Calculate the Percentage:
Food Cost % = (Total Food Cost / Total Food Sales) × 100
The opening stock is the value of stock you held at the start of the measurement period. Purchases include all food items acquired during the period - supplier invoices, direct deliveries, and cash market purchases. Closing stock is the value of stock remaining at the end. The difference between what you started with plus what you bought, minus what remains, represents what was consumed in service during the period.
You should calculate food cost percentage on a consistent cadence. Monthly gives cleaner comparisons and aligns with accounting periods; weekly calculation is more operationally useful because it lets you identify problems and correct them within the same trading period rather than discovering them weeks later.
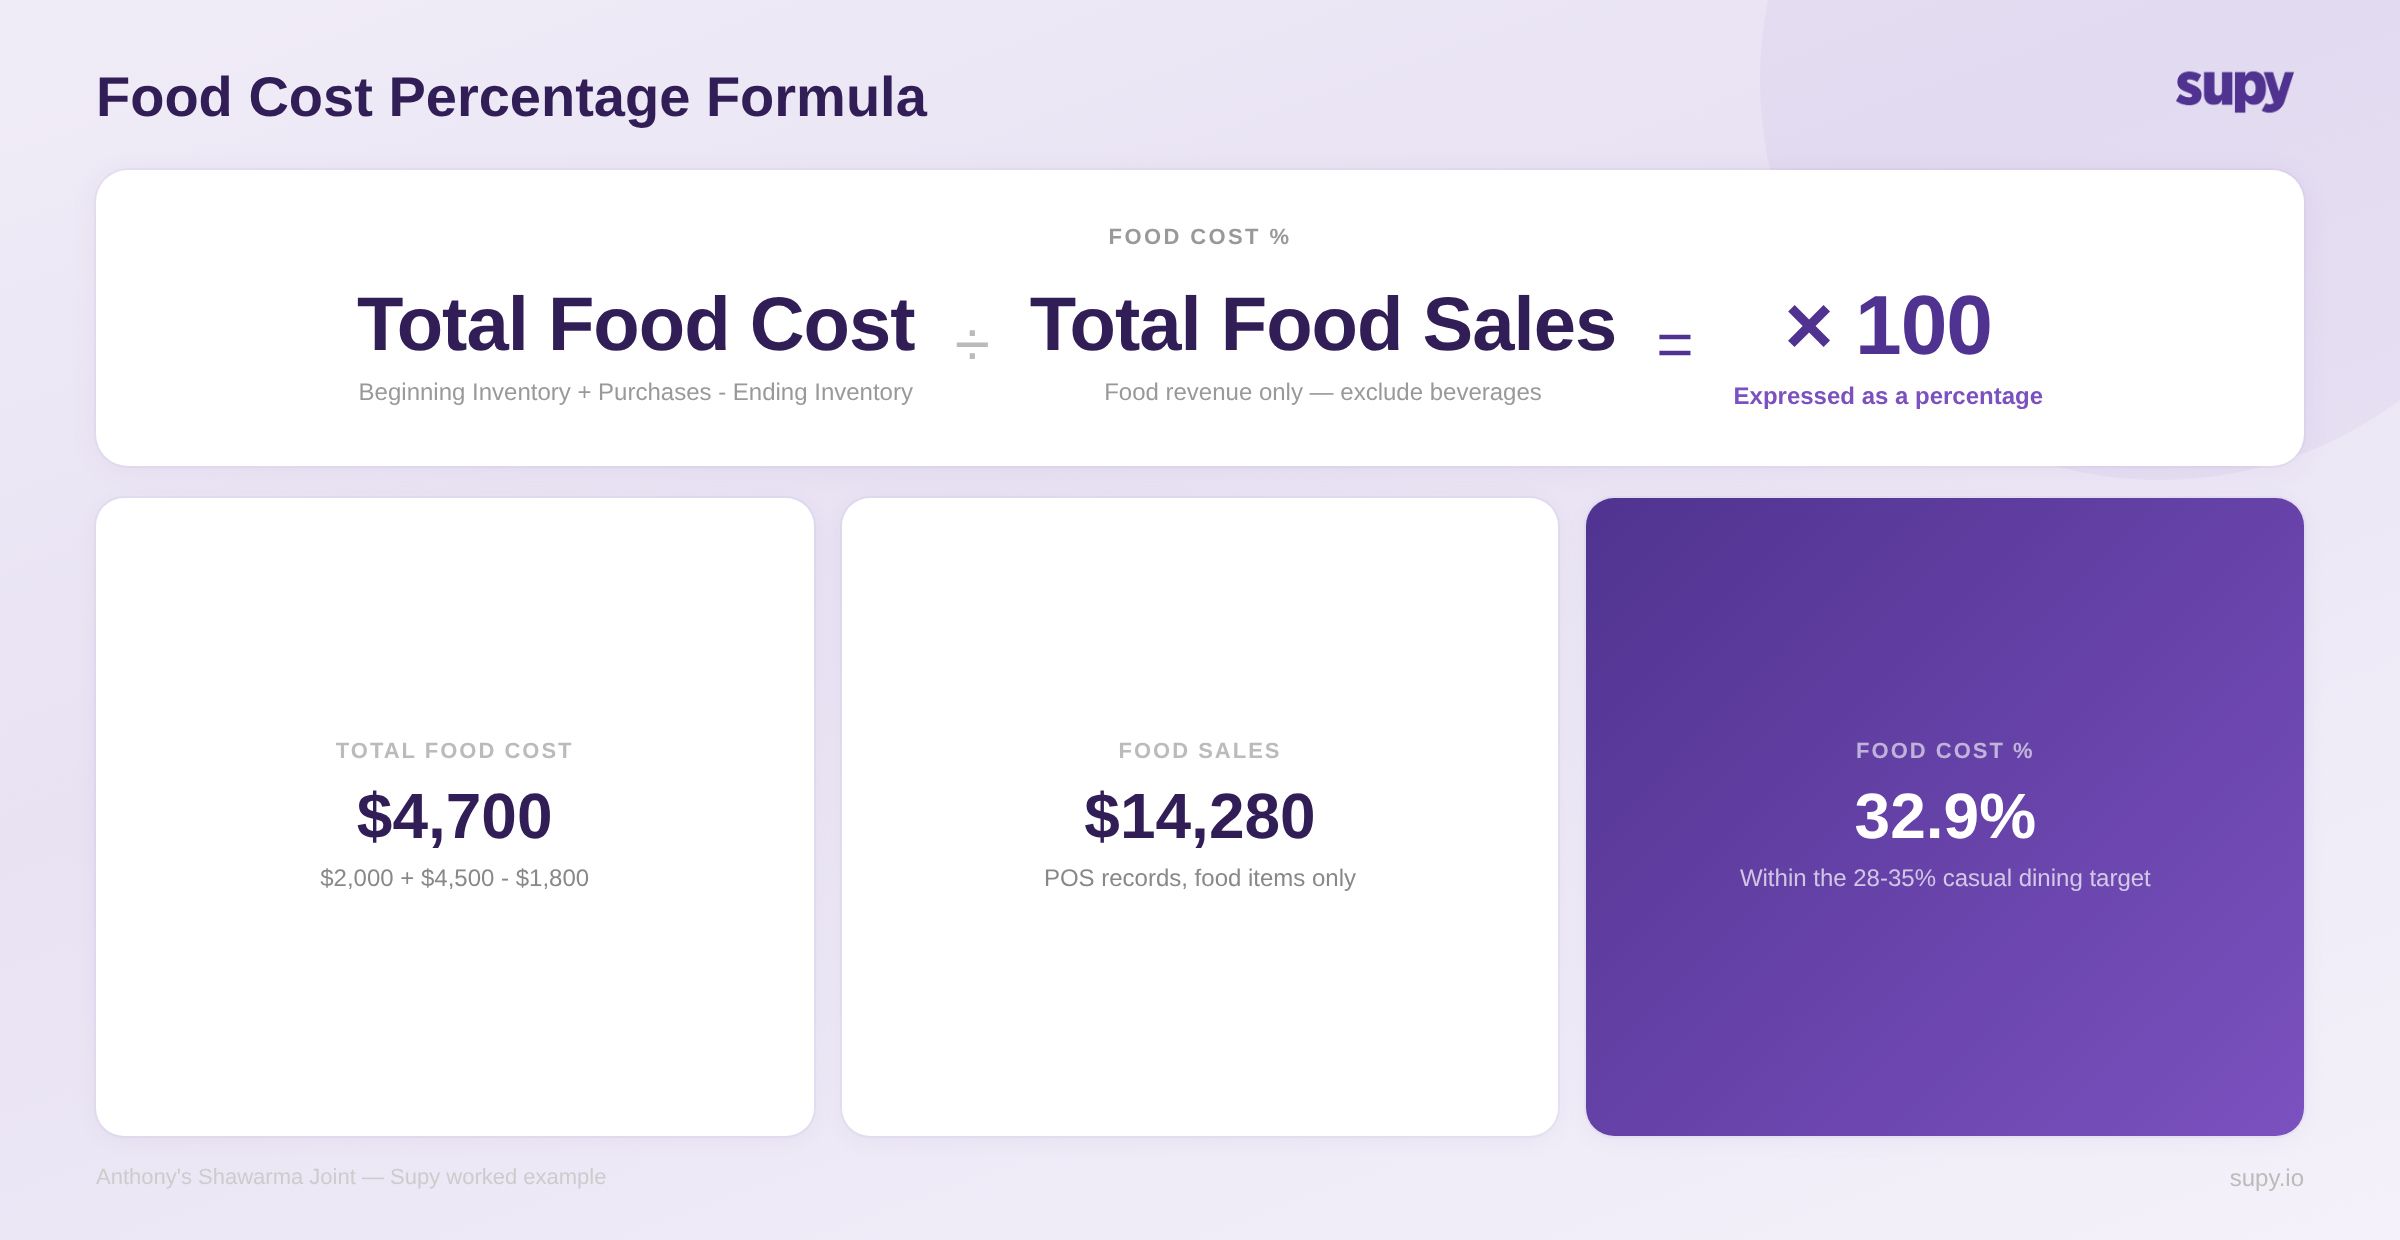
Step-by-Step Worked Example: Anthony's Shawarma Joint
To make this concrete, here is how Anthony - who runs a casual shawarma restaurant - calculates his food cost percentage for March.
Opening Stock (1 March): $2,000
Meat, wraps, vegetables, sauces, and condiments - valued at purchase cost.
Purchases During March: $4,500
Weekly deliveries from two main suppliers, plus a cash purchase from the local produce market.
Closing Stock (31 March): $1,800
Stock count taken at close of business on the last day of the month.
Total Food Cost:
$2,000 + $4,500 - $1,800 = $4,700
Total Food Sales for March: $14,280
Taken directly from POS reports - food items only, beverages excluded.
Food Cost Percentage:
($4,700 / $14,280) × 100 = 32.9%
For a casual dining shawarma restaurant, 32.9% falls within the 28-35% target range. Anthony's margins are healthy - but to know whether that is improving or deteriorating month on month, he needs to run this calculation every period, not once a quarter.
Recipe-Level Food Cost: Calculating Per Dish
The percentage above tells you how the operation is performing in aggregate. Recipe-level food cost tells you whether an individual dish is contributing to or eroding your margin.
Cost Per Serving = Total Recipe Cost / Number of Servings
Menu Item Food Cost % = Recipe Cost / Selling Price × 100
Using Anthony's signature chicken shawarma wrap as an example:
- Chicken (180g): $1.40
- Wrap: $0.15
- Garlic sauce (30g): $0.25
- Vegetables and garnish: $0.40
- Packaging: $0.20
Total recipe cost: $2.40 | Selling price: $8.50 | Recipe food cost %: 28.2%
That is a strong margin on Anthony's flagship item. But if a supplier raises chicken prices by 15%, this calculation changes immediately - his recipe cost rises to approximately $2.61, pushing the dish food cost percentage to 30.7%. Whether that is still acceptable depends on his overall margin targets and whether other items on the menu carry room to absorb the variance.
Recipe-level costing needs to be connected to live ingredient prices to be useful. A spreadsheet updated quarterly gives you a snapshot, not a management tool. One franchise operator summarised the gap clearly after seeing this feature in action: "That's really good. That's what we need, and that's what we're missing." For a broader view of how recipe costing connects to inventory and procurement, see how restaurant inventory management software handles this integration.
Industry Benchmarks by Restaurant Type
Food cost percentage targets vary significantly by format. A quick-service restaurant operating on high volume and standardised portions works under very different economics to a fine dining kitchen where premium ingredients are a deliberate part of the offer.
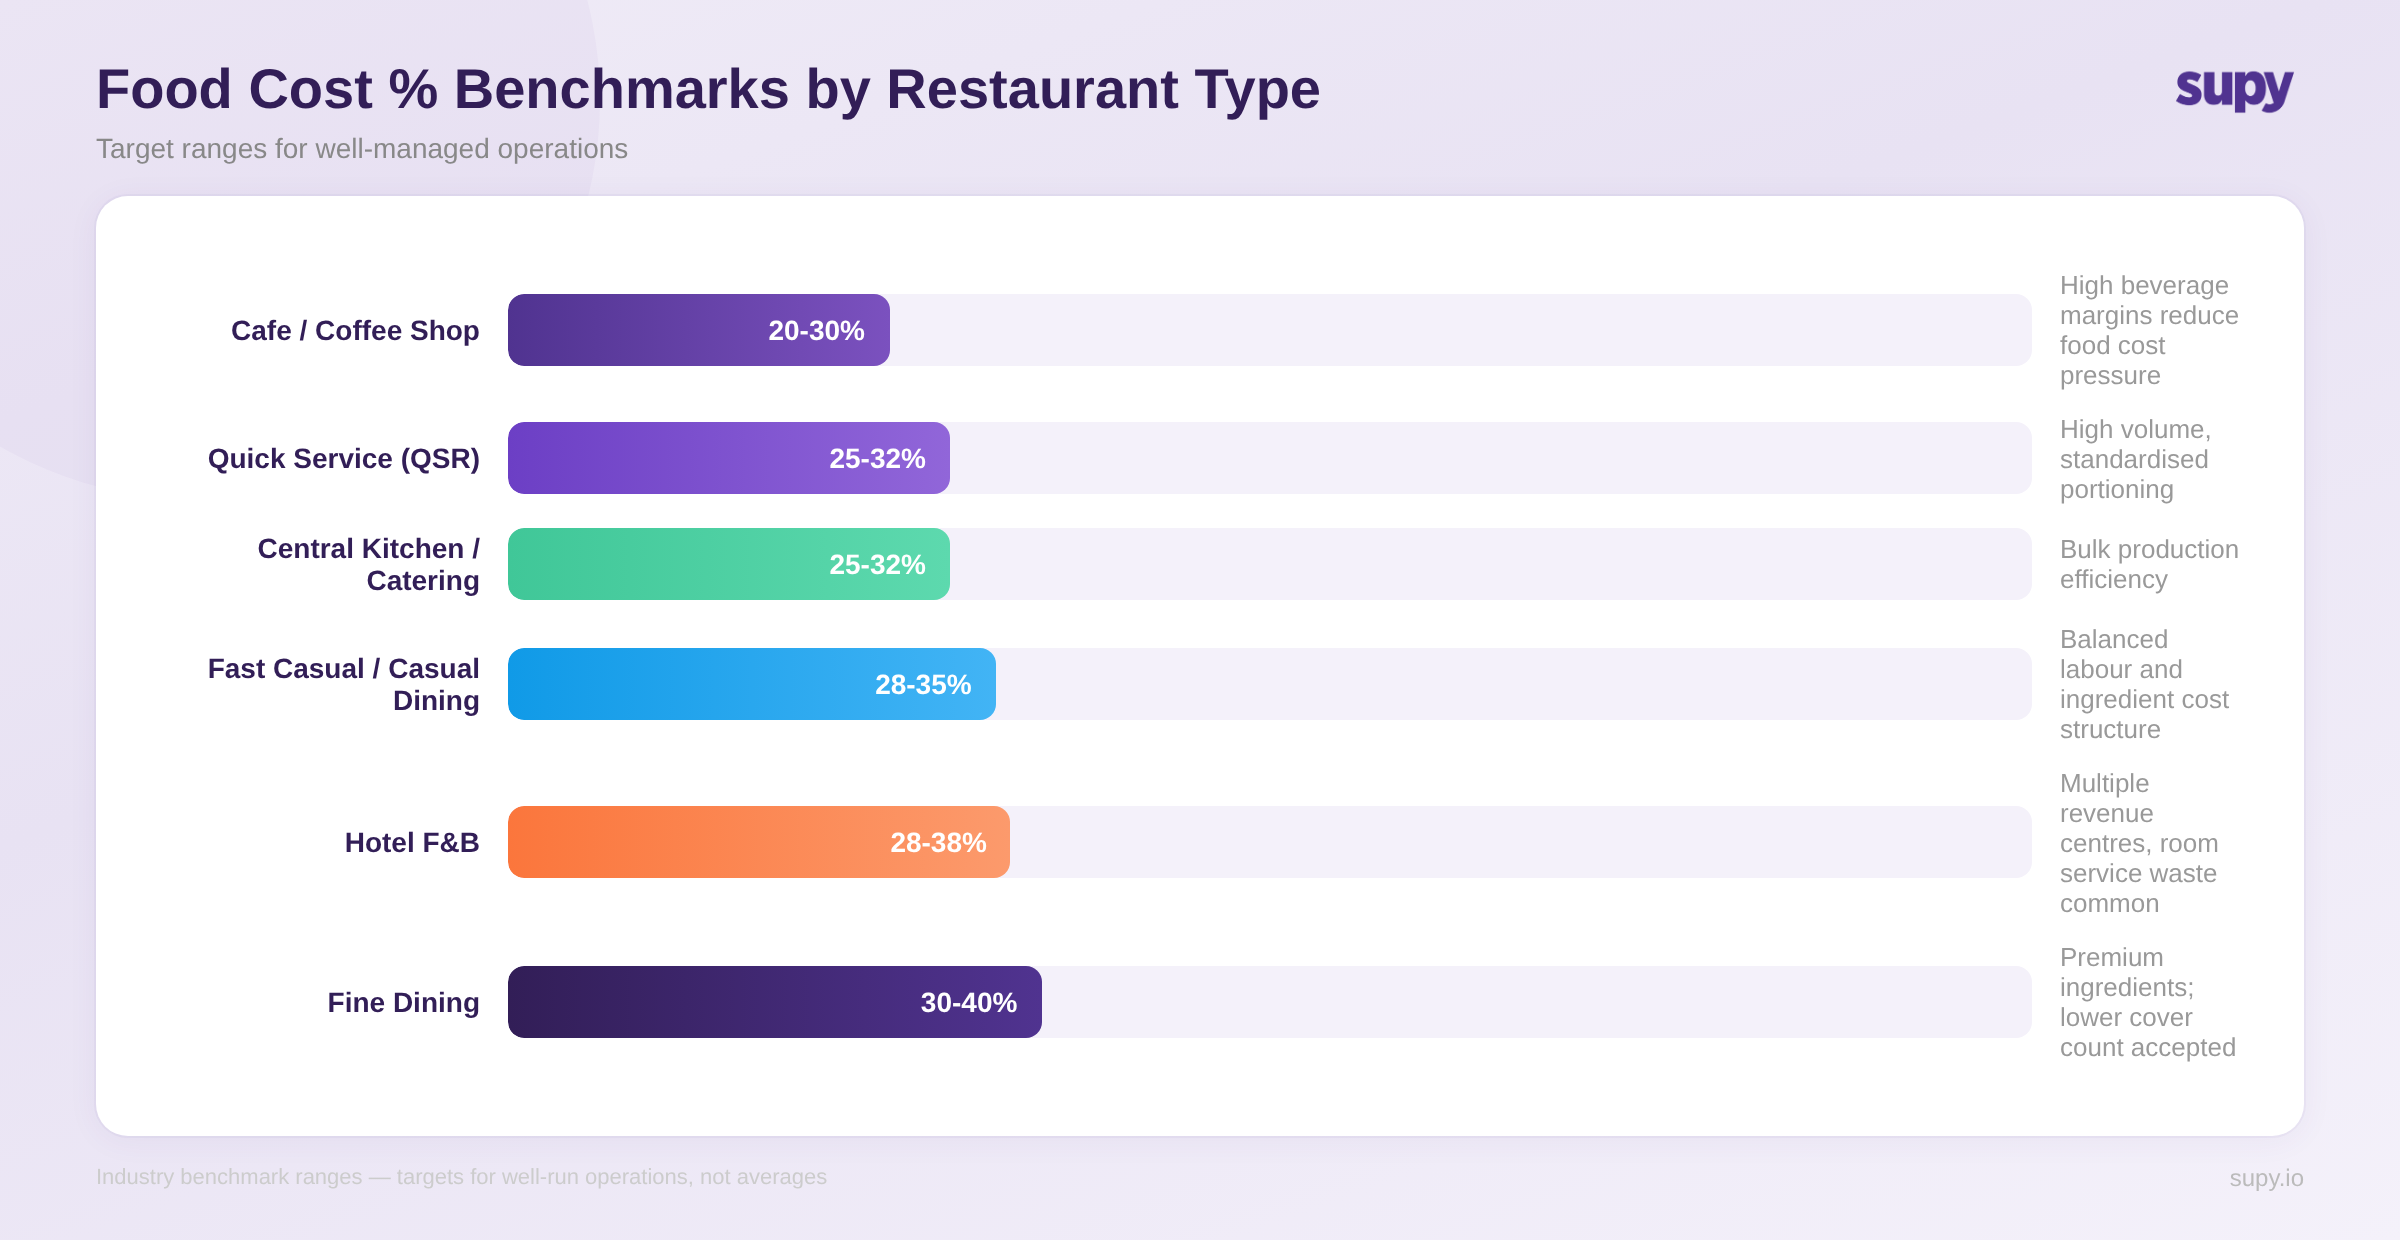
| Restaurant Type | Target Food Cost % | Why |
|---|---|---|
| Quick Service (QSR) | 25-32% | High volume, strict portion control, standardised recipes |
| Fast Casual | 28-35% | Fresher ingredients, moderate throughput |
| Casual Dining | 28-35% | Balanced labour and food cost structure |
| Fine Dining | 30-40% | Premium ingredients accepted; lower volume per cover |
| Cafe / Coffee Shop | 20-30% | High beverage margins offset food cost on food items |
| Hotel F&B | 28-38% | Multiple revenue centres; room service waste is common |
| Central Kitchen / Catering | 25-32% | Bulk production efficiency; less per-portion waste |
These are target ranges for well-run operations, not industry averages. Many operators - particularly those without structured food cost tracking - run above them. One multi-unit operator described their situation plainly: "My goal is to get us down to about 30%, and we're still skating at around 40%... I think we need something like this to get our portion control right." The gap between where they were and where they wanted to be was not a supplier problem - it was a measurement and enforcement problem.
For multi-location operators, it is worth calculating food cost percentage per venue rather than purely in aggregate. A blended 32% across three locations could mask one site running at 40% and dragging down two well-managed kitchens. Identifying that kind of variance is where food cost percentage becomes a management tool rather than just an accounting metric.
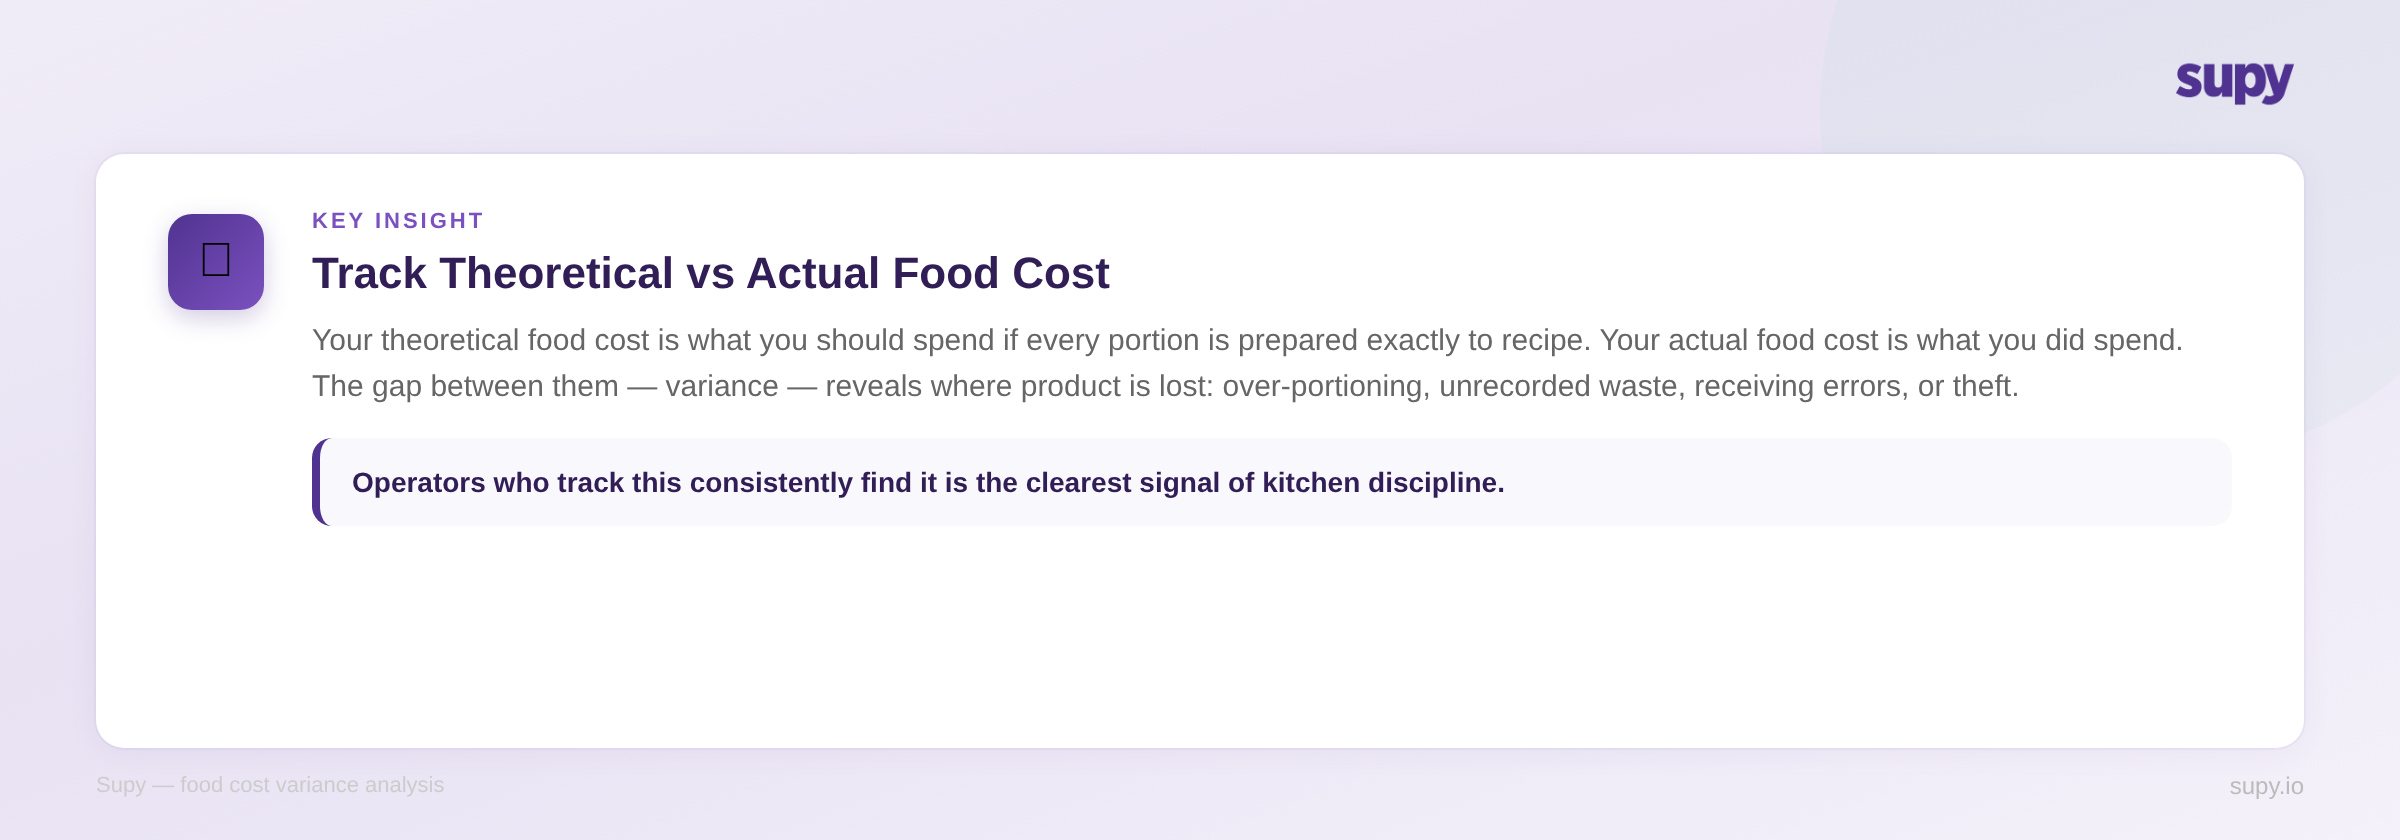
Theoretical vs Actual Food Cost: The Variance That Matters
Understanding the gap between your theoretical food cost and your actual food cost is one of the most operationally useful analyses any restaurant can run.
Theoretical food cost is what your food cost should be if every portion were prepared exactly to recipe specification, with zero waste or over-portioning.
Actual food cost is what your food cost actually was, based on inventory movements and purchase records.
The gap between the two - called variance - reveals where product is disappearing. Common causes include over-portioning at the pass, staff meals not recorded separately, spoilage not tracked during stock counts, receiving errors where items were charged for but not delivered, and in some cases, theft.
Operators who track this consistently describe it as the most reliable signal of kitchen discipline. One head of operations put it directly: "The biggest thing we need to work on is always making sure our theoretical margin is right, because that's something I find we struggle with." When theoretical and actual food cost align, you know your kitchen is operating to standard. When they diverge, the variance points you to the problem.
Setting accurate par levels is one lever that reduces theoretical versus actual variance by preventing over-ordering and the spoilage that follows. See our guide on what par level is and how to calculate it for a practical framework.
Common Mistakes That Inflate Your Food Cost Percentage
Even operators who know the formula often calculate food cost percentage inaccurately. These are the most frequent errors that lead to a misleadingly high or low number.
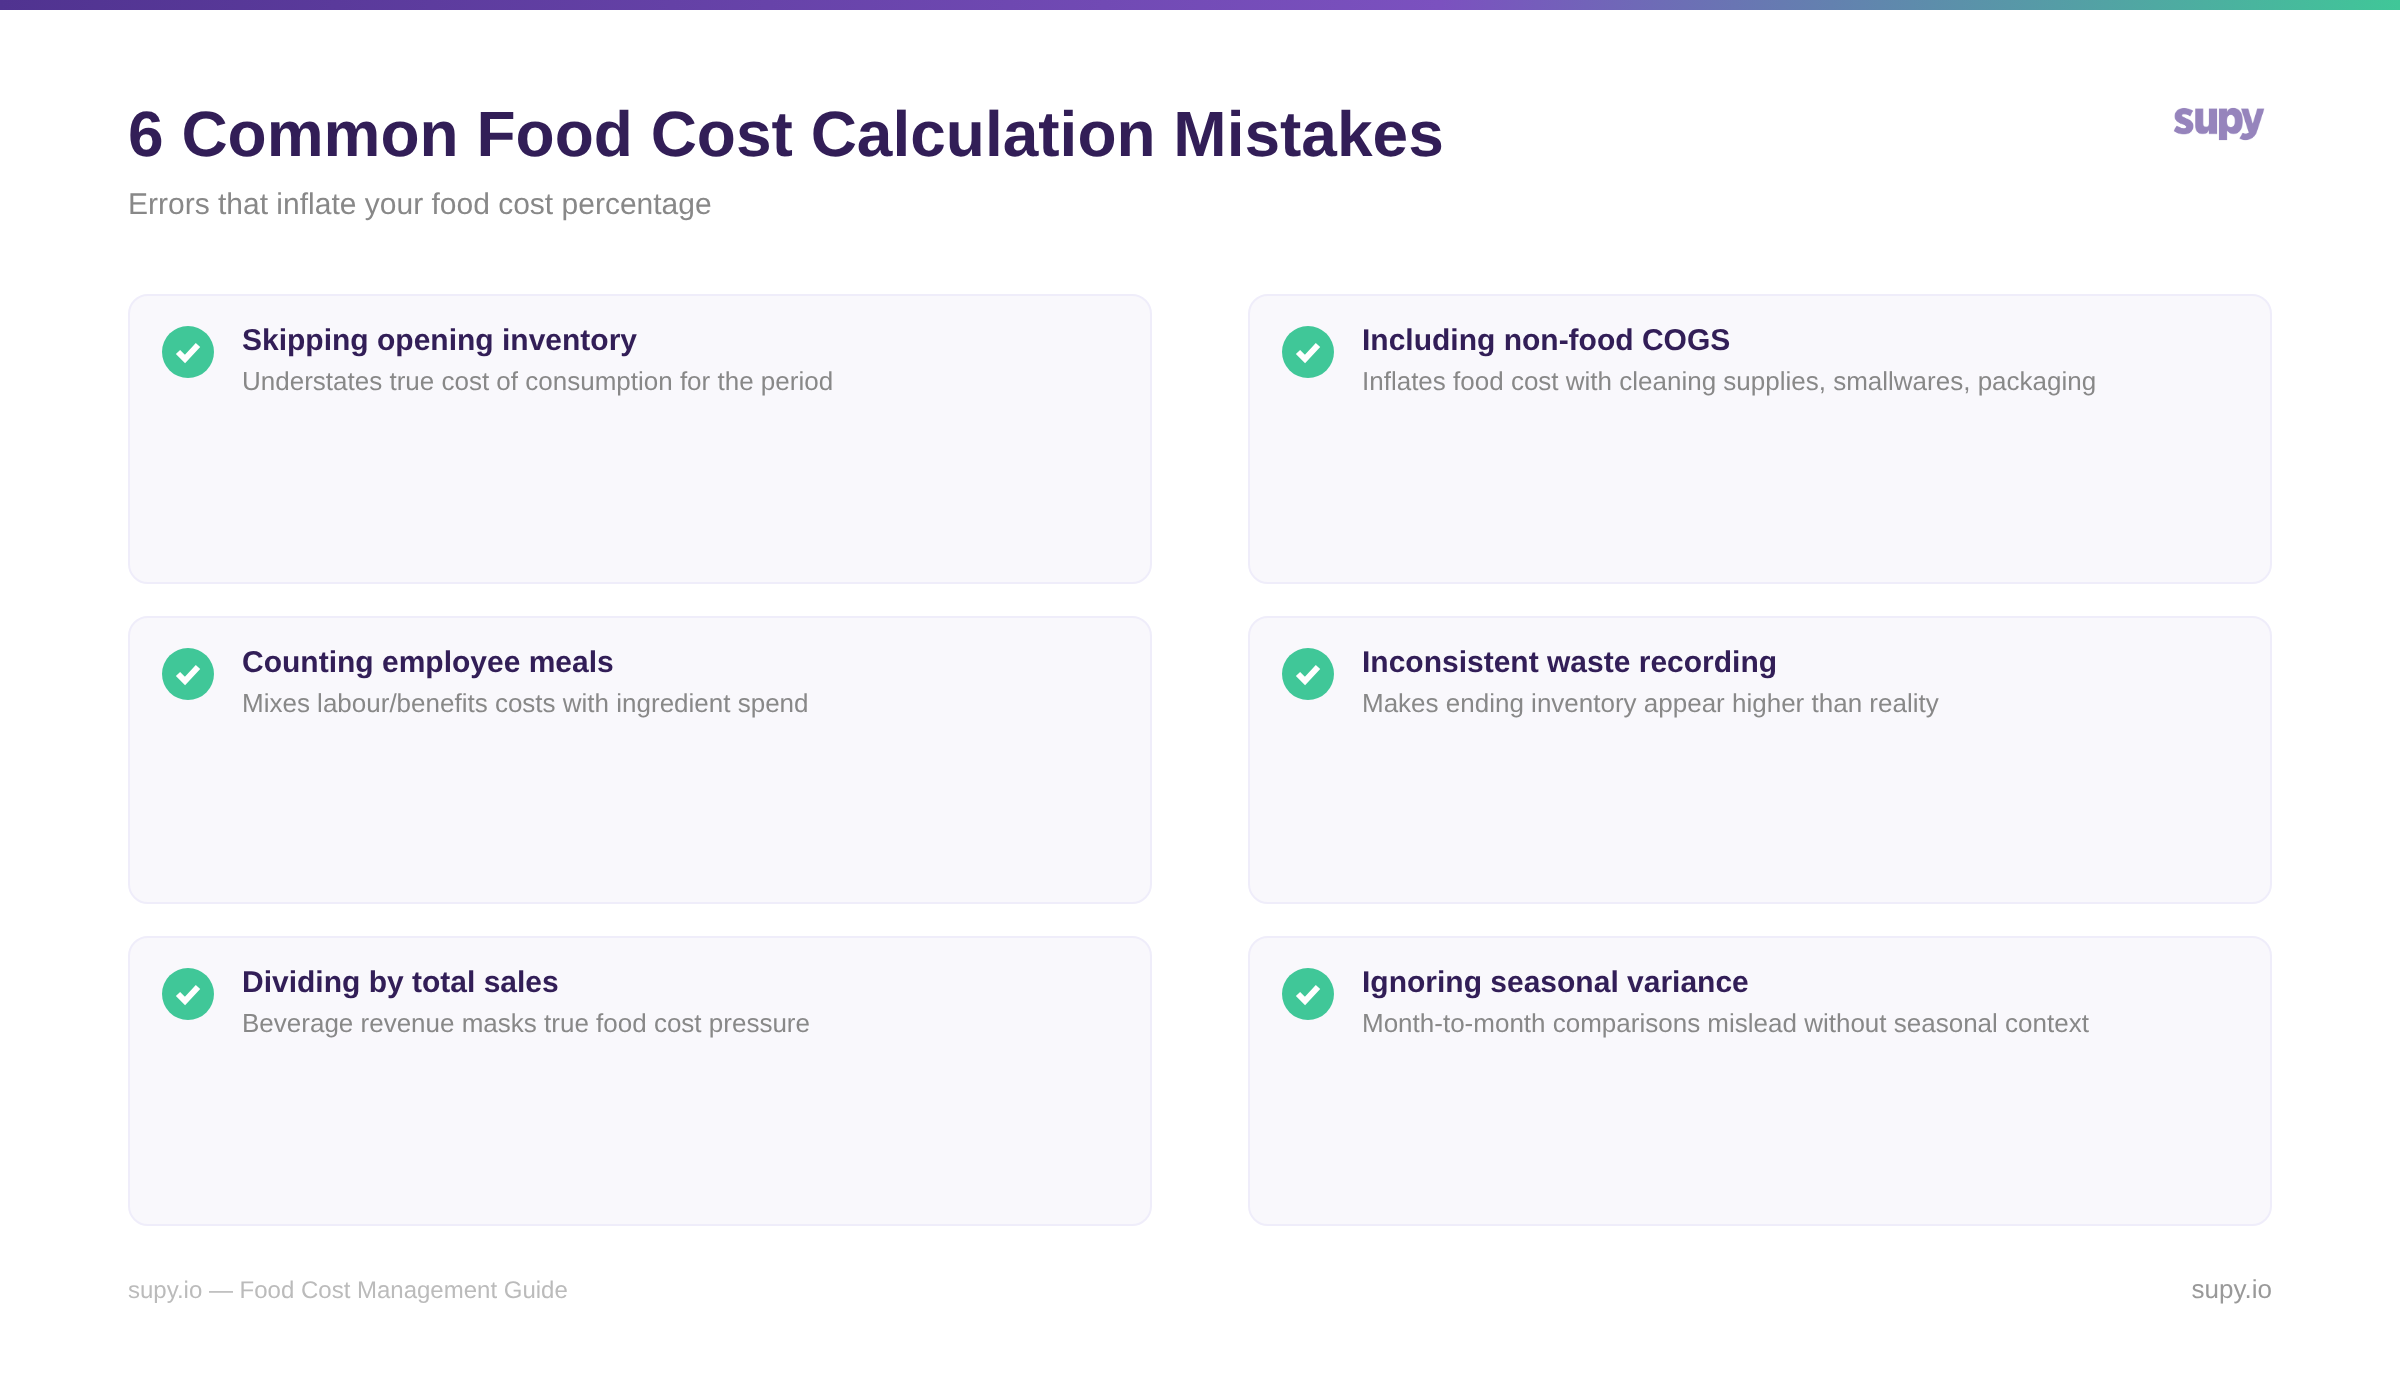
1. Skipping opening inventory. You must include the stock value at the start of the period. Forgetting this step understates the true cost of consumption, because food purchased in the previous period and consumed now does not appear in your purchases figure.
2. Including non-food COGS. Smallwares, napkins, cleaning supplies, and packaging should be tracked separately. Including them inflates your food cost percentage and makes it impossible to isolate ingredient cost trends.
3. Counting employee meals as food cost. Staff meals should be tracked under labour or benefits. Including them in food cost mixes operational categories and makes the metric harder to benchmark against industry standards.
4. Inconsistent waste recording. If spoilage is not counted during your stock take, closing stock appears higher than it should be, which makes food cost appear lower. Both figures are incorrect. Waste must be recorded accurately to get an honest result.
5. Dividing by total sales instead of food sales. If your operation generates significant beverage revenue, use food sales only as your denominator. Including beverage revenue artificially lowers the percentage and masks ingredient cost pressure on food items.
6. Ignoring seasonal variance. Comparing March to August without accounting for seasonal ingredient cost changes leads to false conclusions. Track trends across the same period year-on-year before drawing conclusions from month-to-month movements.
How Software Automates Food Cost Tracking
Calculating food cost percentage manually once a month is a useful starting point - but it is a retrospective, not an operational system. By the time you run the numbers at month end, any portioning drift or purchasing errors from the first two weeks are already locked in.
Software changes the calculation from a monthly exercise into a near-real-time view. When your inventory system captures every delivery, every stock transfer between locations, and every recipe's ingredient consumption automatically, it can calculate food cost continuously - flagging variances before they compound across weeks of trading.
For multi-location operators, this is the difference between knowing your group-level food cost percentage and knowing it per venue, per menu category, and per ingredient line. Operators who reach this level of visibility consistently describe it as a shift from reacting to cost problems to preventing them.
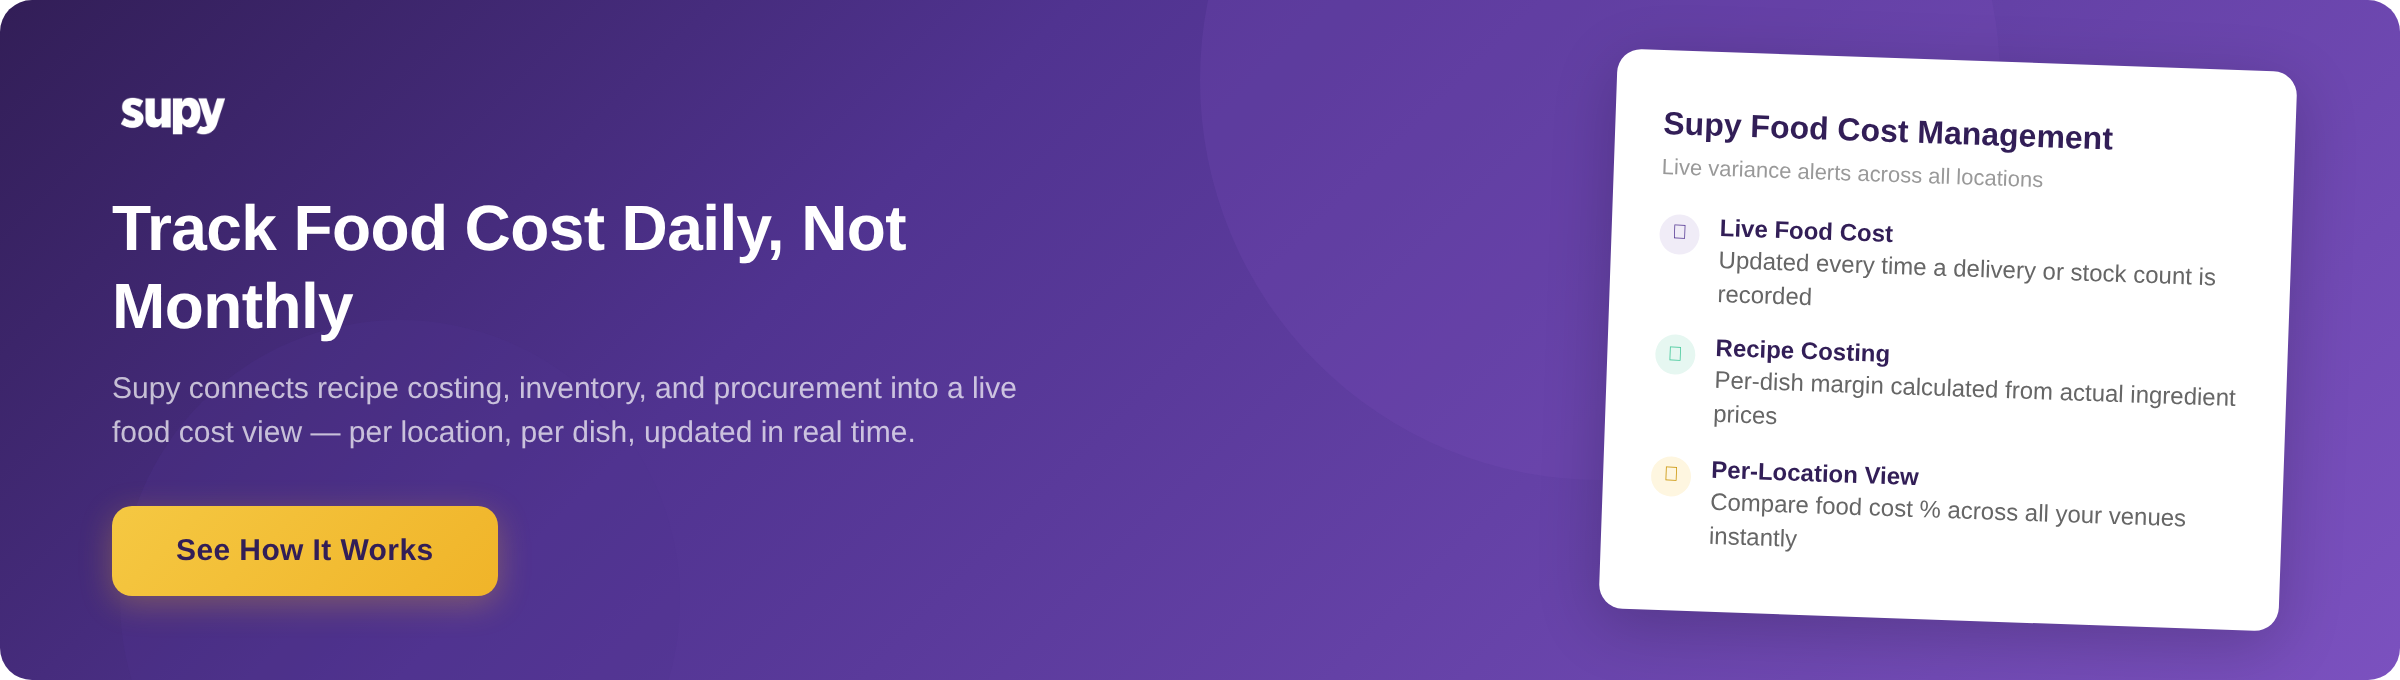
Supy connects inventory movement, recipe costing, and procurement data into a unified view of food cost and margin. Teams can compare actual versus theoretical food cost across locations, trace cost increases to their source - whether a supplier price change, a portioning issue, or a receiving error - and take action within the trading period rather than at the next board meeting.
For a broader view of how operational discipline and cost control connect across a multi-unit restaurant group, see our guide on restaurant operations management.
About Supy
Supy is a back-of-house operations platform built for multi-location restaurant operators. It covers procurement, inventory management, recipe costing, and business intelligence - connecting purchasing data, stock movements, and recipe costs into a unified view of food cost and margin by location. Operators use Supy to move from monthly manual food cost calculations to live visibility across every venue, with variance alerts that surface portioning and waste issues before they compound.

