Typical Restaurant Profit Margin: Why One Average Hides a Losing Site
What a typical restaurant profit margin really is
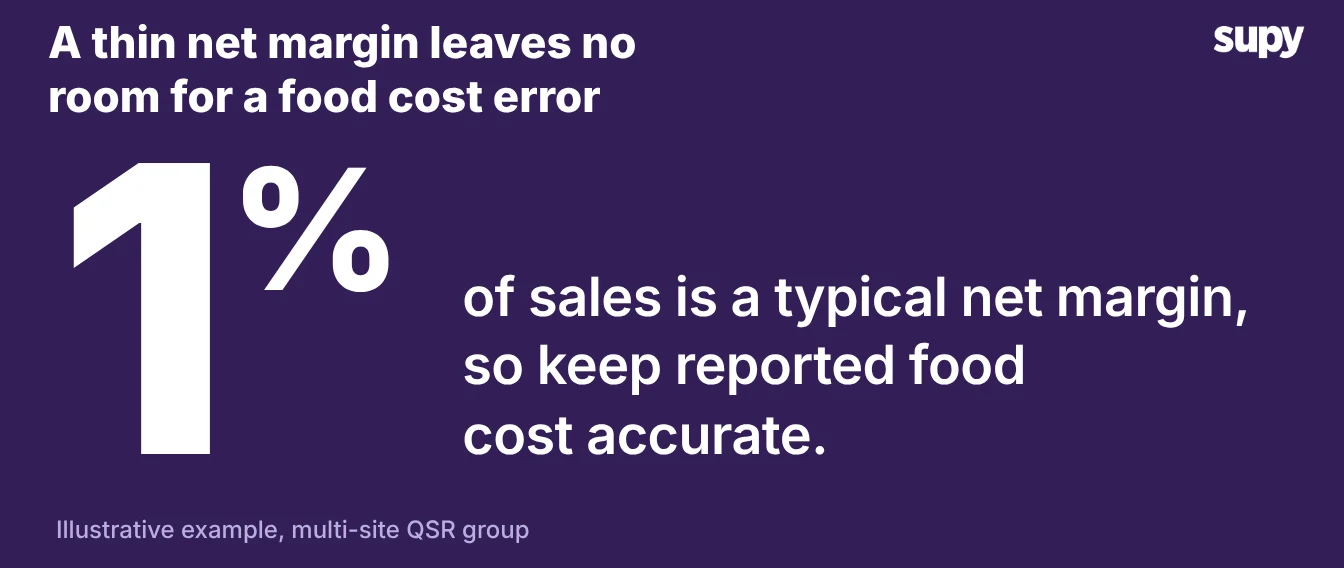
A typical restaurant keeps only a few cents of net profit on each dollar of sales, so a single point of food cost decides the month. One multi-site QSR group spent about a third of sales on food and kept roughly 1% as net profit. At that margin, a 1-point error in reported food cost is the line between a profit and a loss. This article shows why the margin is thin, how a group total masks a losing site, and how to find the dishes that lose money.
- Prime cost. Net profit is what remains after food, labour, rent, utilities and everything else. Food and labour together make up prime cost, the pair an operator watches first. Food is the largest variable cost of the two.
- Understated food cost. Say the recipe cost on screen sits a point or two below what the kitchen actually pays. Every point you understate comes straight off the net margin. Sales can look healthy while the restaurant keeps nothing at the end of the month.
- Match real cost. That is why reported food cost has to match real food cost. A margin of a few cents cannot absorb a recipe cost that nobody updated. Prices moved, nobody rechecked the recipe, and the kitchen kept costing the dish at the old price.
Why one average hides a site running at a loss
A blended margin across sites is an average, and an average hides its worst member. A group that reads one number for the whole estate cannot see the site dragging the rest down.
The strong sites carry it in the blend. The wider the estate, the more sites one figure blends, so a single weak site hides easily.
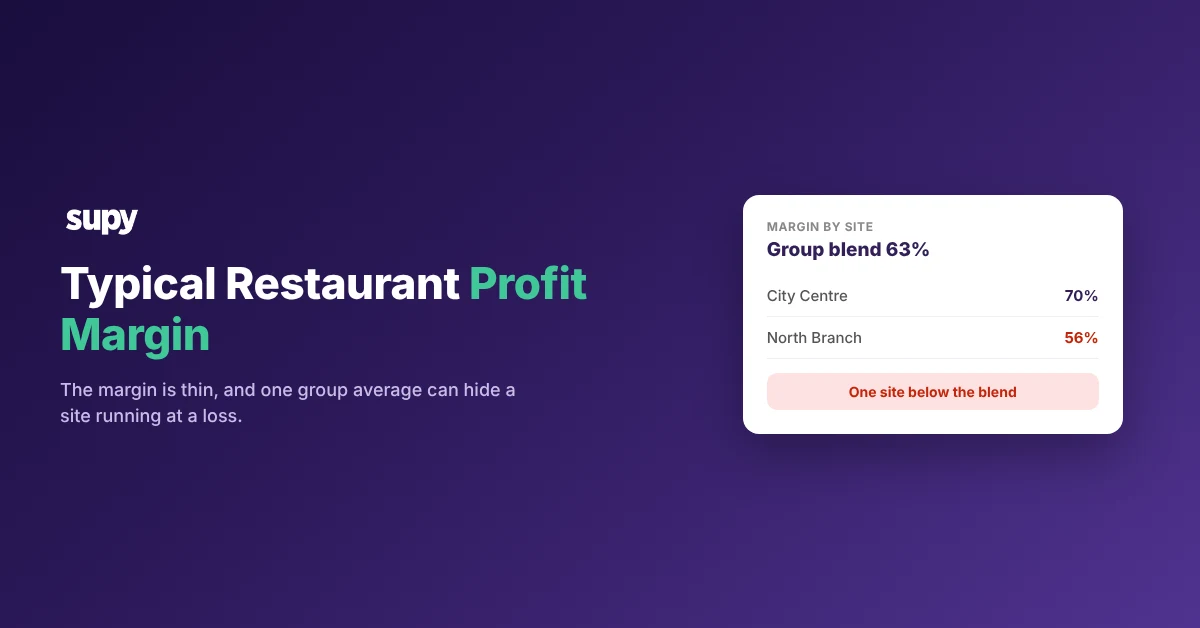
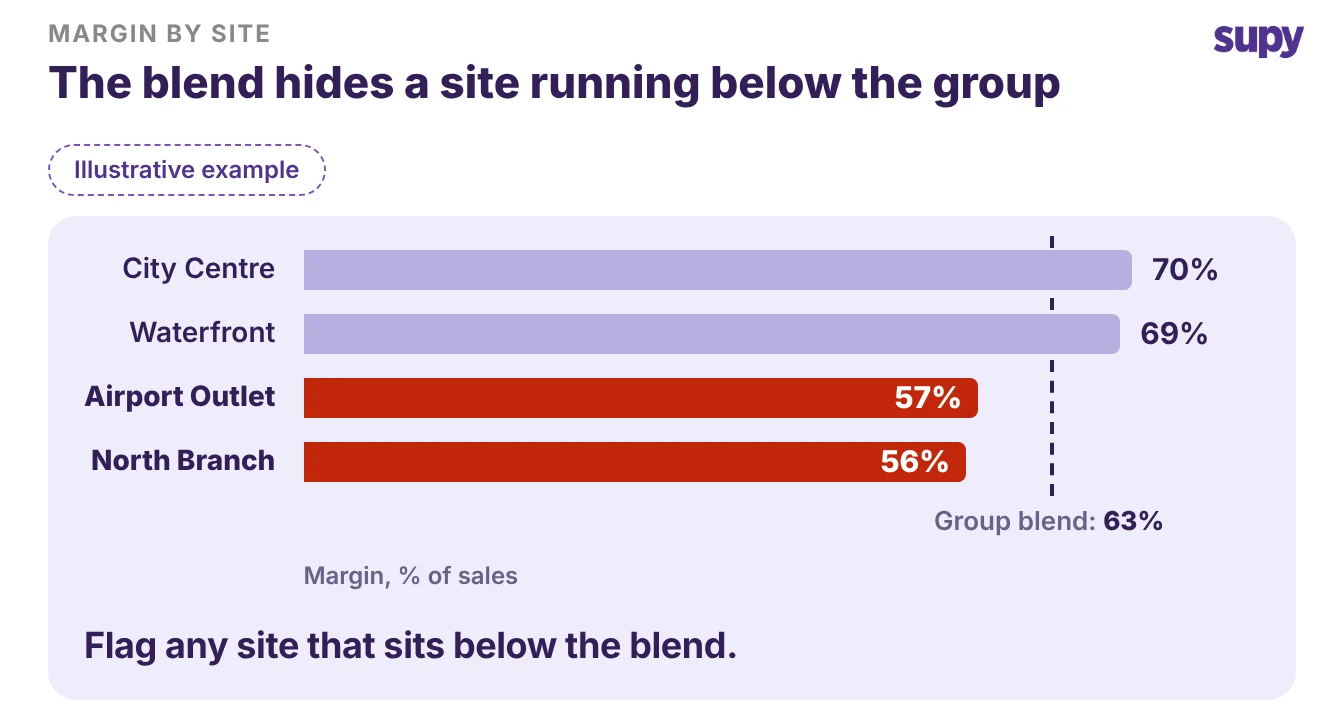
- A real case. One casual-dining group reported a steady 63% margin across all its sites. A quarterly review found two of them running at 56% and 57%, below the blend for 3 months. Those sites paid more than the central recipe costs assumed. The group figure never moved, so nothing flagged the problem until someone looked site by site.
- The fix. The fix is to read margin per site, not per group. Lay the sites side by side against the blended figure. You spot the low ones at a glance, weeks before a quarterly review would.
The dishes quietly losing money
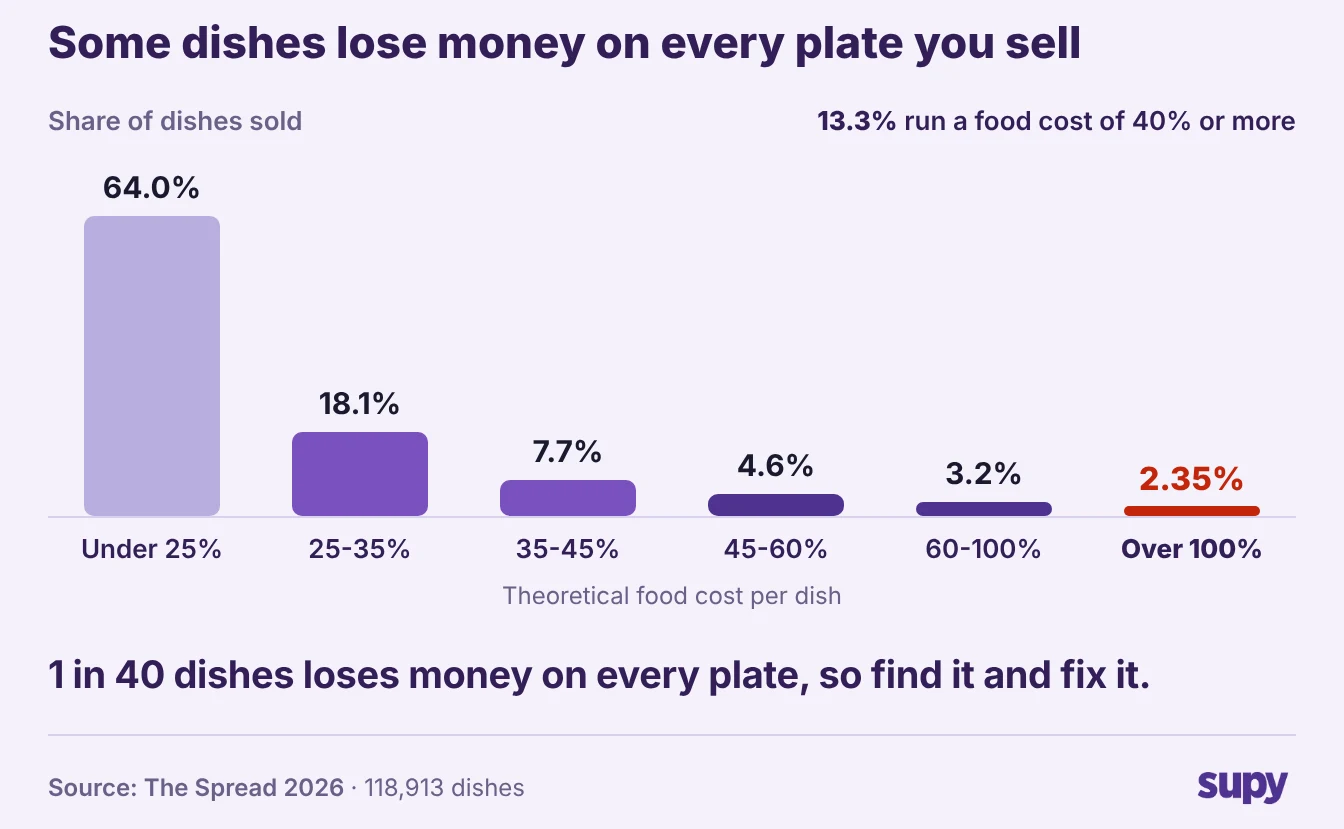
The same blending happens one level down, on the menu. A healthy average food cost can sit on top of individual dishes that lose money on every plate.
- The Spread data. The Spread finds that 1 dish in 7 runs a food cost of 40% or more. Across those 118,913 dishes, 1 in 40 loses money outright. Our guide to menu items sold at negative or zero margin shows how to find and fix each one.
- How dishes turn. A dish turns negative the same way a site does. An ingredient price climbs, the menu price holds, and the recipe cost is never rechecked. The menu looks busy while the worst plates lose the margin the good ones earn. Across a long menu, a few negative plates sit unnoticed among dozens that pay their way.
Read margin per site and per dish, every month
Read margin per site and per dish every month, not every quarter. A quarterly review finds the problem three sales-cycles late, after the loss has already run for weeks. A monthly read catches a drifting site or dish while you can still act on it.
| What to read | How often | What it catches |
|---|---|---|
| Margin per site | Every month | A site running below the group blend |
| Food cost per dish | Every month | A dish that turned negative |
- A real operator. One operator targeting 30% cost of goods found his actual figure sitting at 43% to 47%. He could not explain the variance while his stock lived across WhatsApp, Excel and memory. The number existed; nobody could see it in time. Pull margin per site and per dish on a fixed monthly date, compare each against its target, and work the worst first.
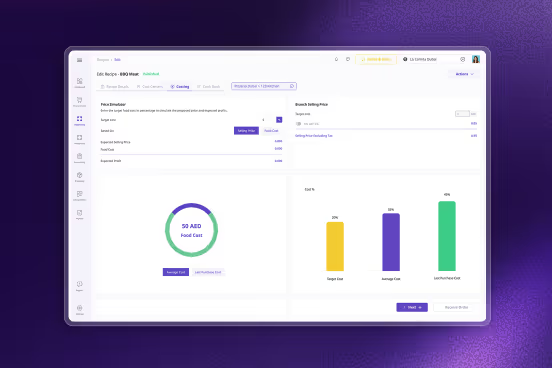
- What Supy shows. Supy shows your cost of goods and margin live, by group, site, category and dish. You see a losing site or dish the week it happens, not at the quarter's end. The restaurant analytics dashboards rank profitability by site, category and dish. Each recipe carries a target food cost that flags when the actual figure goes over it.
Start with one monthly read. Rank your sites by margin, then your dishes by food cost. Look first at anything below the group blend or above a 40% food cost.
A typical margin leaves no room to carry a loss you cannot see, so make that loss visible while there is still time to fix it.