





How to Build a Restaurant Budget Template for Multiple Sites

What a Restaurant Budget Template Needs
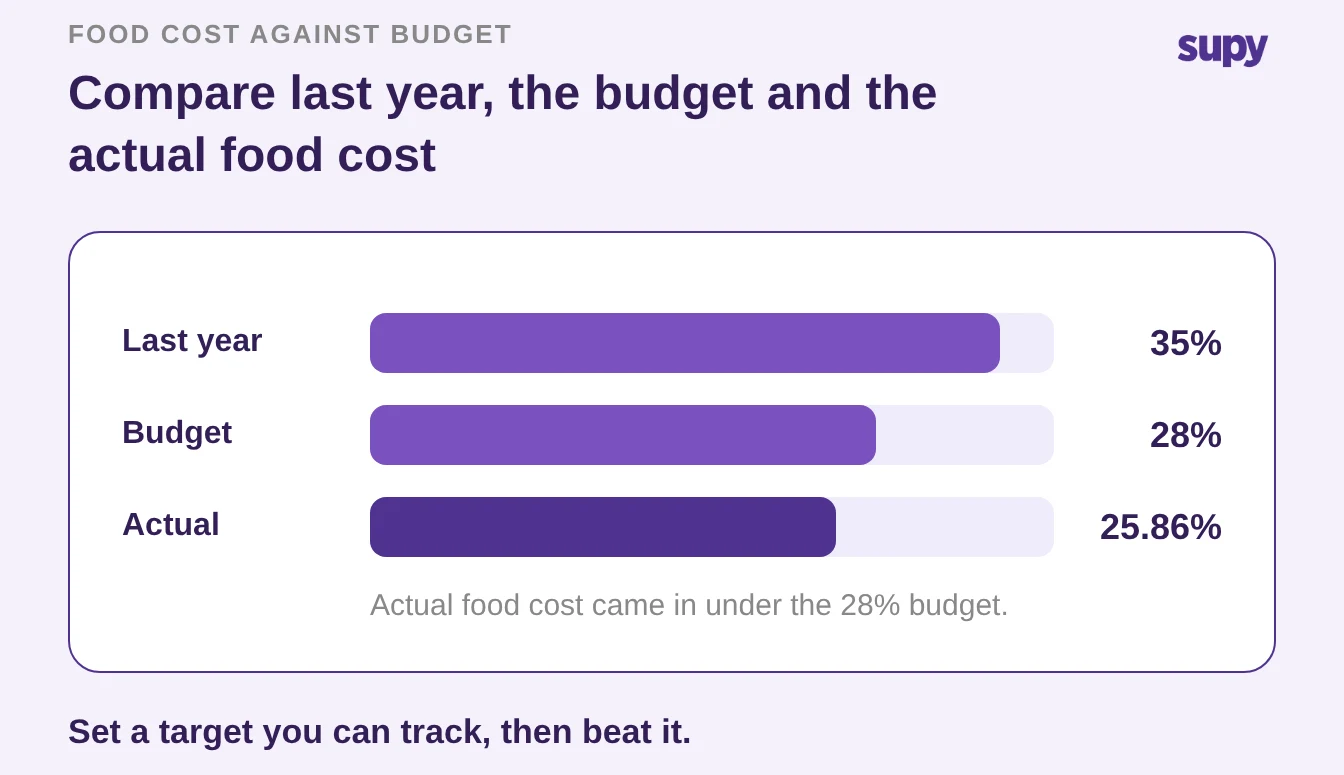
A restaurant budget template gives a multi-site group one set of money targets per site, tracked against the real numbers every period. One group that tracked its food cost this way held it to 25.86% against a 28% budget, rather than finding the overspend at year end. The template needs five lines: a sales forecast, a food cost target, a labour target, fixed costs, and a procurement budget. This article shows how to build each line, roll the sites into a group view, and track it period by period.
Most budget templates you can download are built for one owner-operator: a single profit-and-loss sheet with last year's numbers typed in. A group needs more. Each site sells a different mix at a different rent, so one blended target hides the site that is quietly losing money. The fix is a template with the same five lines for every site, filled in with that site's own numbers.
Build the template around these lines, in this order:
- Sales forecast. What each site expects to sell in the period. Every other line is a share of this number, so it comes first.
- Food cost target. Cost of goods sold (COGS) as a percentage of sales. This is the line that moves most, and the one worth tracking weekly.
- Labour target. Wages and salaries as a share of sales, taken from the rota plan at forecast sales.
- Fixed costs. Rent, utilities, software and insurance. Mostly known in advance, spread evenly across the periods.
- Procurement budget. What the kitchen can spend on stock to hit the food cost target. Set it against the sales forecast, not as a flat number.
Here is the template itself, one row per line. Copy it once per site and fill the last two columns with that site's numbers.
| Budget line | What it sets | How to set the number |
|---|---|---|
| Sales forecast | Expected sales for the period, per site | Last year's same period, adjusted for trend and known changes |
| Food cost target | COGS as a share of sales | A point or two below last year, not an aspiration |
| Labour target | Wages as a share of sales | From the rota plan costed at forecast sales |
| Fixed costs | Rent, utilities, software, insurance | Known annual costs spread across the periods |
| Procurement budget | Stock spend that hits the food cost target | The food cost target applied to the sales forecast |
A good starting point for the sales forecast is last year's same week, moved up or down for what you already know. A guide to restaurant sales forecasting covers how to build that number site by site. Get the forecast close, and the food cost and procurement lines fall into place, because both are a share of it.
The procurement budget is the line operators ask about most, because it drives how much to order each week. A simple rule works: the food cost target times the sales forecast is the stock spend that keeps you on budget.
If you budget a 28% food cost on a $85,000 forecast, the kitchen can spend near $23,800 on stock that week. That figure also sets your reorder quantities, so you order to the budget rather than to a habit.
If you'd rather not work par out by hand, the free par level calculator does it for every item on your sheet from your usage, delivery days and supplier lead times.
Build One Template Per Site, Then Roll the Sites Up
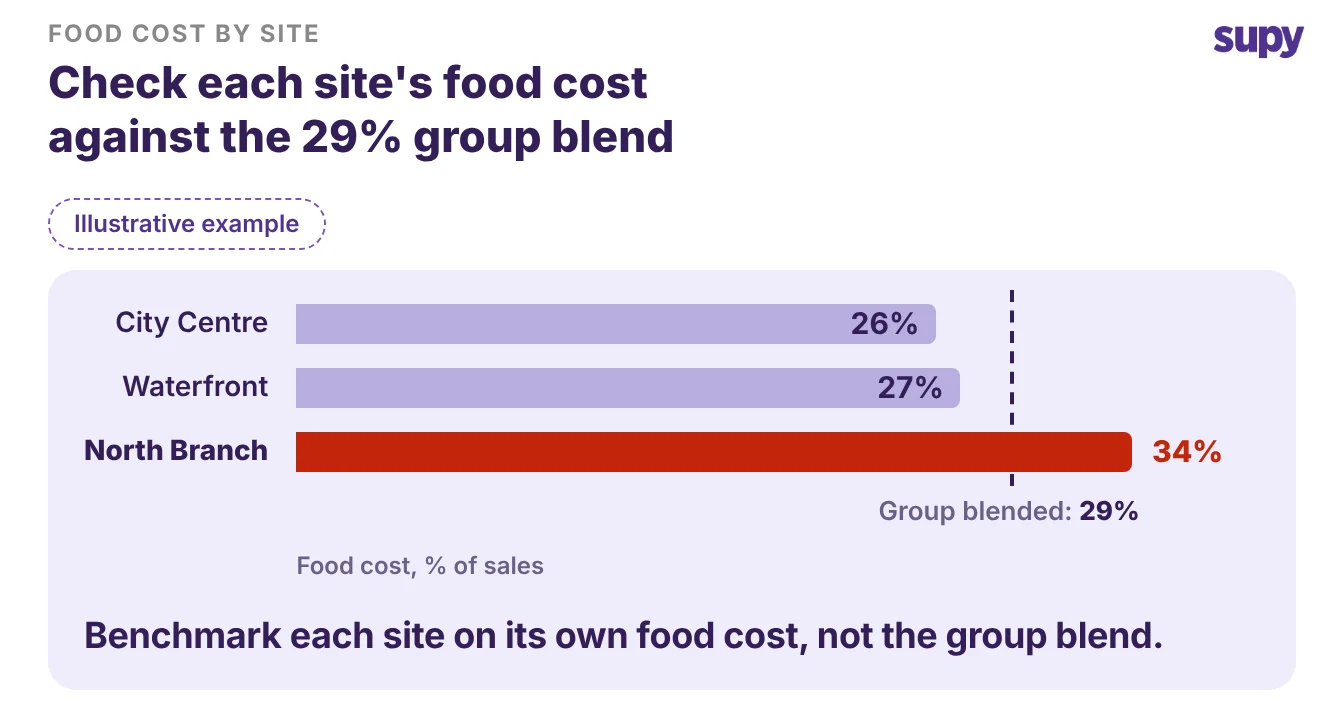
Give every site its own copy of the five lines, then sum the copies into a group view that keeps each site visible. A group total on its own tells you the group is at 29% food cost. It does not tell you that one site sits at 26%, another at 27%, and one sits at 34%. The site view is where you find the kitchen to fix.
Keep the per-site and group levels tied together:
- Per site. The five lines in that site's own numbers, so the manager owns a target they can act on.
- Group roll-up. The same lines summed, plus each site's food cost percentage side by side, so head office can rank sites without opening five sheets.
- One set of definitions. The same meaning for COGS and labour at every site, or the roll-up adds up numbers that were counted differently.
Change the group budget site by site, not in one move. When a target has to come down, groups usually start with the site where the budget is tightest and prove the new number works before rolling it out. That keeps one aggressive target from being forced onto a site that cannot carry it.
Set a Food Cost Target You Can Actually Hit
Set the food cost target a point or two below last year's actual, not at a number you wish were true. The target only works if the team believes it, and a target no site has ever reached gets ignored by the second week.
A worked example shows the shape. One multi-site group budgeted a 28% food cost, then tracked an actual COGS of 25.86% across its first full period on proper reporting, down from 35% the year before.
The point is not the exact figure. It is that the group set a target it could see against the real number, caught the gap early, and closed it. A budget line you track beats a target you file.
To set the number for each site:
- Start from that site's own history, not a group average. A high-street cafe and an airport unit do not share a food cost.
- Move a point or two off last year, in the direction the menu and prices justify.
- Write down why. A target with a reason behind it survives the first bad week; a round number does not.
Track the Actual Against the Budget Every Period
A budget tells you something only when you compare it to what happened, every period, site by site. Filing the template in January and opening it in December tells you nothing you can act on. Track food cost weekly rather than monthly, so a drifting site shows up while you can still order differently. The guide to tracking food cost weekly covers the cadence in full.
This is where reporting does the work a spreadsheet cannot. Supy's restaurant analytics shows live COGS and food cost percentage at group, site and menu-category level, with theoretical-versus-actual variance beside it. The budgeted target and the real number sit on one screen. The same reports export to a spreadsheet when finance wants the period pack in their own format.
Two things keep the tracked number honest:
- Re-check the target when prices move. Supplier prices on a given item change more often than operators assume, so re-price the food cost target when a run of invoices comes in higher, not once a year. A target you set last quarter is often out of date before anyone looks at it again.
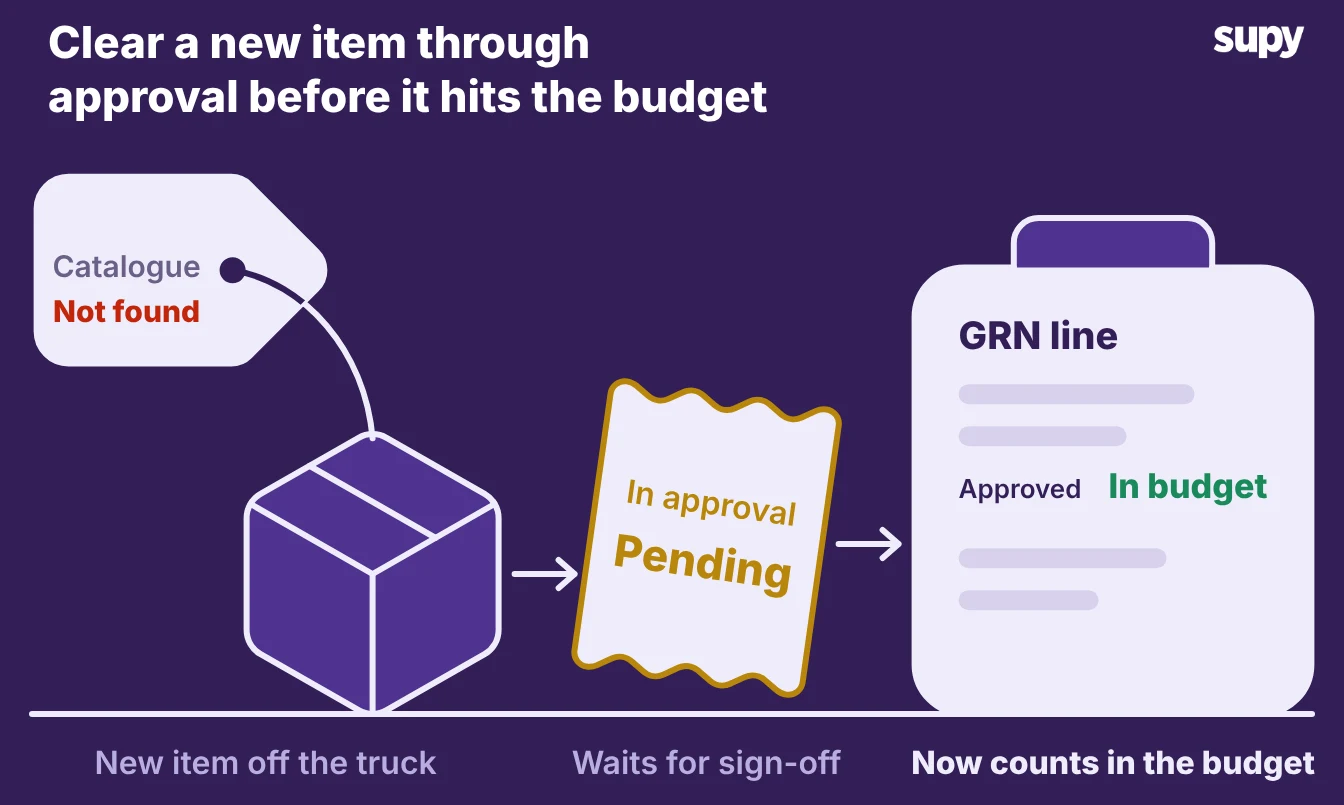
- Account for new items as they arrive. When a delivery brings an item your catalogue has never seen, it enters an approval queue first. Only once it clears does it become a normal goods received note (GRN) line and count against the budget. That keeps an unpriced item out of the numbers, and it keeps the procurement line comparable from week to week.
Make the Budget a Decision, Not a Filed Spreadsheet
Treat the group budget as a set of trade-offs you can defend, not a total handed down. In a larger group, approving a higher number on one line usually means naming the saving that pays for it first. That is why budget sign-off tends to be a weekly conversation, not a one-off form. A template that shows where each number comes from, and what it trades against, makes that conversation quick.
When you compare tools or build the next version of the template, these are the two things operators ask for next, so look for them:
- A procurement budget that follows sales. Many operators want next week's ordering budget set from last week's takings, not a fixed figure. The stock spend then flexes with a quiet week or a busy one.
- A spend cap against the budget. Finance teams ask for a hard limit, so purchasing beyond the agreed amount cannot go through without a sign-off. Ask any tool you are weighing up whether it can warn or stop an order that pushes a site over its procurement budget.
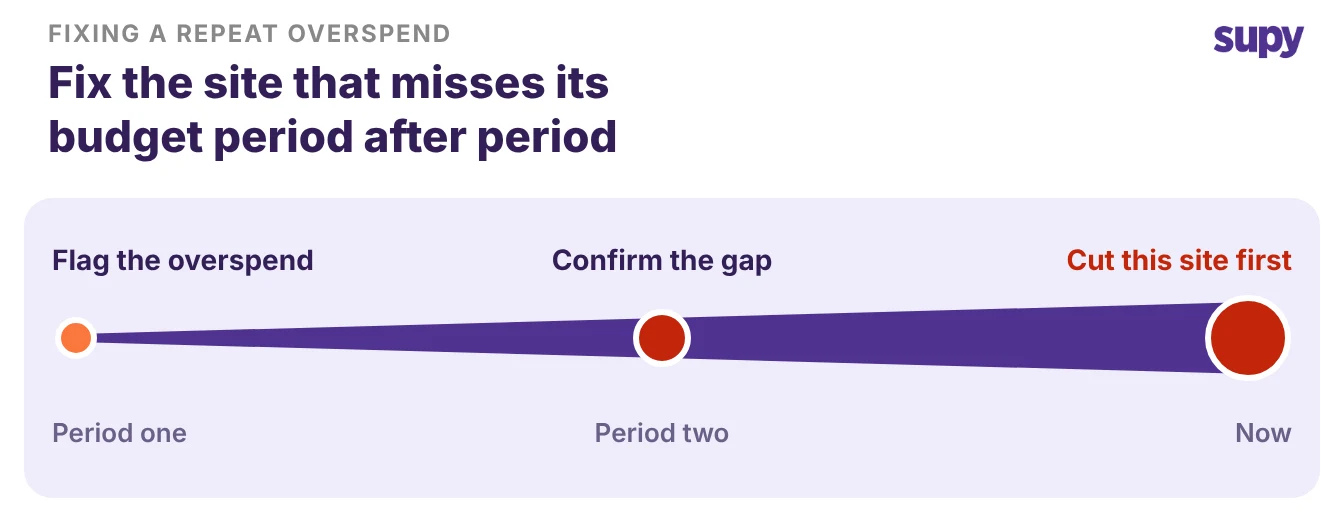
Run this quick check on your own numbers. Pull the last two periods, site by site, and find any location whose actual food cost sat more than two points above its target both times. That is a real gap, not a bad week.
Fix that line first, because it is where the group spends money the budget never approved. Set the target, track it weekly, and a budget template stops being a document you file and starts being the number you run the group by.