Monthly Restaurant COGS Is Too Slow: Track Supplier Invoices Weekly

Why Month-End COGS Comes Too Late to Act On
Monthly cost of goods sold (COGS) tracking from supplier invoices tells you what food cost did, a month after you could have changed it. A supplier's new price sits on every order for weeks before anyone reconciles the invoices at month end, and by then the extra spend is already in the accounts. Tracking the same numbers weekly turns COGS from a report you read after the fact into one you can still act on. This article compares monthly, invoice-based tracking with continuous tracking, and shows which one fits each kind of restaurant group.
What Monthly, Invoice-Based Tracking Lets Slip
A once-a-month pass through supplier invoices gives you one COGS figure per site, long after the week that produced it. It misses three things.
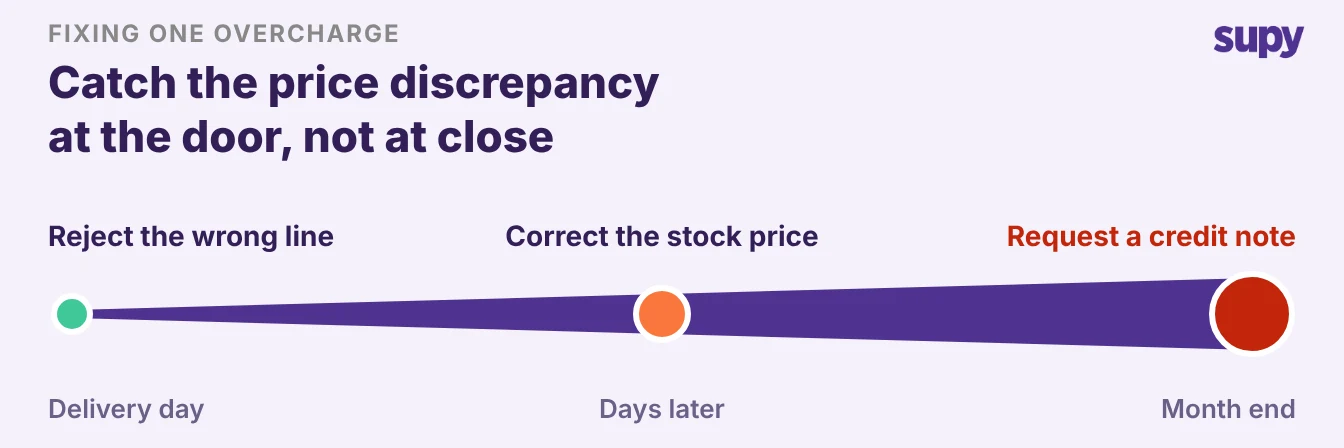
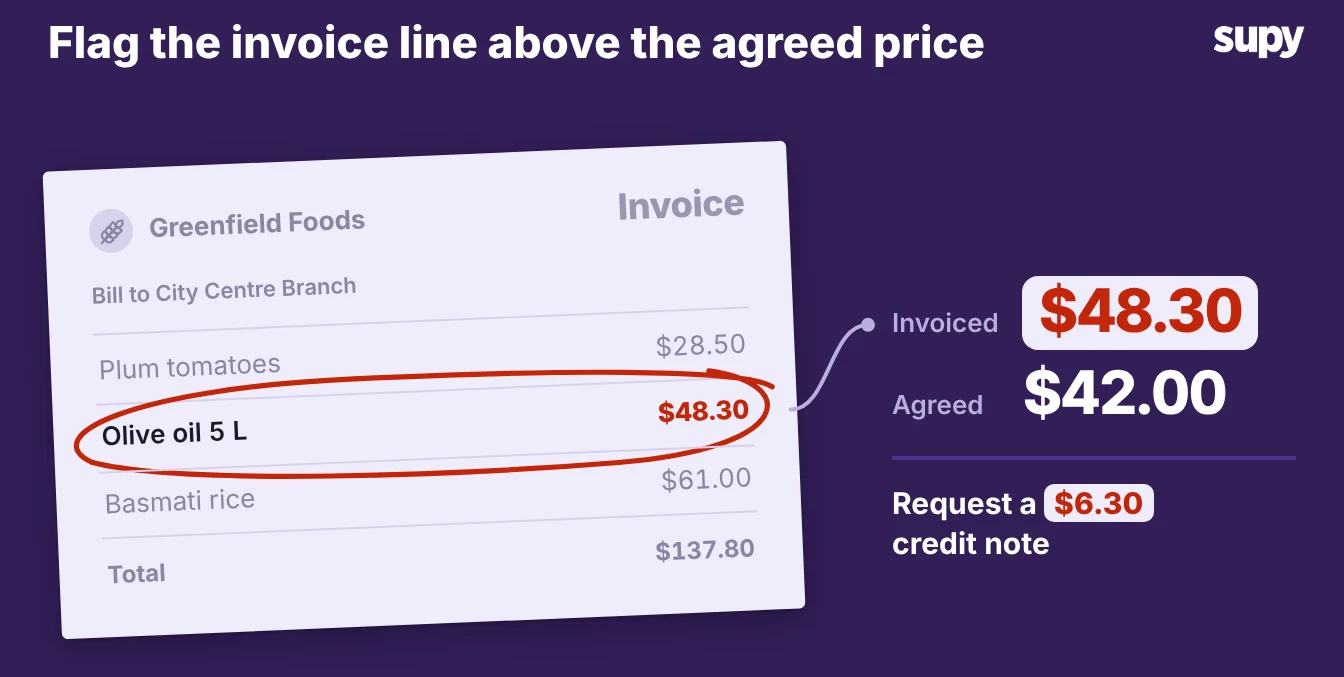
- You do not notice a supplier's price rise. When a supplier lifts the price of an item you buy every day, monthly reconciliation catches it at close, after the higher price has run through weeks of orders. Supy's own invoice data shows how far these rises go. Among invoice lines above the agreed price, 46.8% run 20% or more over it, across 6.43 million lines in the latest Spread report. Caught at the door, each one is a credit note request. Caught a month later, it is a write-off.
- You do not see usage variance until you close the month. If food cost comes in at 35% against a 25% target, the invoice total tells you the number is wrong but not why. The waste, the over-portioning and the unlogged transfers that drove it happened weeks ago, so the trail is cold.
- Sites cost different amounts and you cannot say why. A group running several branches can watch cost of sales move apart between locations and have no way, at month end, to say where the difference came from. One operator described tracking COGS by going through supplier invoices once a month to work out cost as a percentage of turnover, far less detailed than a weekly view.
Monthly Reconciliation and Continuous Tracking, Side by Side
The two approaches answer the same question at very different speeds. The table sets them against each other on what an operator actually cares about.
| What matters | Monthly invoice reconciliation | Continuous tracking |
|---|---|---|
| When you see the number | Once, after month-end close | Live, as your team enters invoices and counts |
| What a surprise costs you | A full month of the problem | The days until the next review |
| What you can still change | Next month, if you remember why | This week, while the cause is fresh |
| Cross-site visibility | One figure per site, compared by hand | Every site on one screen, side by side |
| Who does the work | A manager, through invoices each month | The system, from receiving and counts |
What Continuous Food-Cost Tracking Changes
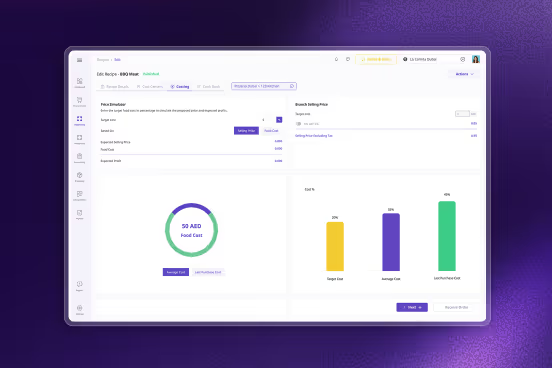
Continuous tracking reads the invoices, counts and sales your team already handles and keeps COGS current instead of waiting for close. Because the numbers update as the work happens, a problem shows up in the week it starts.
- Live cost view. With live tracking in place, an operator reads COGS and food-cost percentage at group, site and menu-category level on one screen, and compares theoretical cost against actual cost by item.
- Cost-weighted variance. When a stock count is submitted, the variance report lists every item where the counted quantity differs from the quantity the system expected. Each line carries the cost of its variance, so a costly line outranks one that moved more units.
- Per-site detail. Each report belongs to one site. A gap then points at the item and the branch that produced it, not a blended total.
- Drill and export. When a figure looks wrong, you drill into the line and export the detail rather than reopening a pile of invoices.
- No extra keying. Supy's restaurant analytics builds this from the data your team already enters, so nobody keys COGS twice.
This also closes the loop that manual invoice checking leaves open. Our guide to auditing supplier invoices for price discrepancies covers the other half: catching the price discrepancy at receiving, before it ever reaches a COGS report.

Moving From Monthly to Weekly Across Sites
You do not need a finance team to shorten the cycle. Change the order in which the numbers arrive.
- Receive against the agreed price at the door. Check each delivery against the agreed price when it arrives. A changed price then becomes a credit note request that day, not a month-end surprise.
- Let recipe costs update from the invoices. When received prices flow into recipe costs automatically, your theoretical cost stays current without anyone re-keying it.
- Review COGS by site once a week. Read the weekly COGS and food-cost-percentage view across every site, and treat any line above target as a question to answer while the week is still fresh.
- Follow the variance to its cause. Where theoretical and actual diverge, drill into the item and site, not the invoice stack. Log what you find, so you can explain the gap next week.

Choose monthly reconciliation when you run a single site, take a handful of invoices from a few suppliers, and can hold the whole picture in your head. Choose continuous tracking the moment you run more than one site. That is where a month-old number stops telling you anything you can still fix.