.jpg)


Restaurant Menu Profitability Analysis: How to Find Which Dishes Make Money at Each Site
What a Menu Profitability Analysis Shows You Dish by Dish
A menu profitability analysis ranks every dish by what it costs to make against what it sells for. That shows which items carry your margin and which quietly drain it. Across a multi-site group, the same dish can land in a different place on that ranking at each location.
The output is not a single food-cost number for the whole group. It is a per-dish read of food cost and contribution margin, sorted so the winners and the leaks are obvious at a glance. A high-price dish is not automatically a profitable one, and a cheap side can out-earn a hero plate once volume is in the picture.
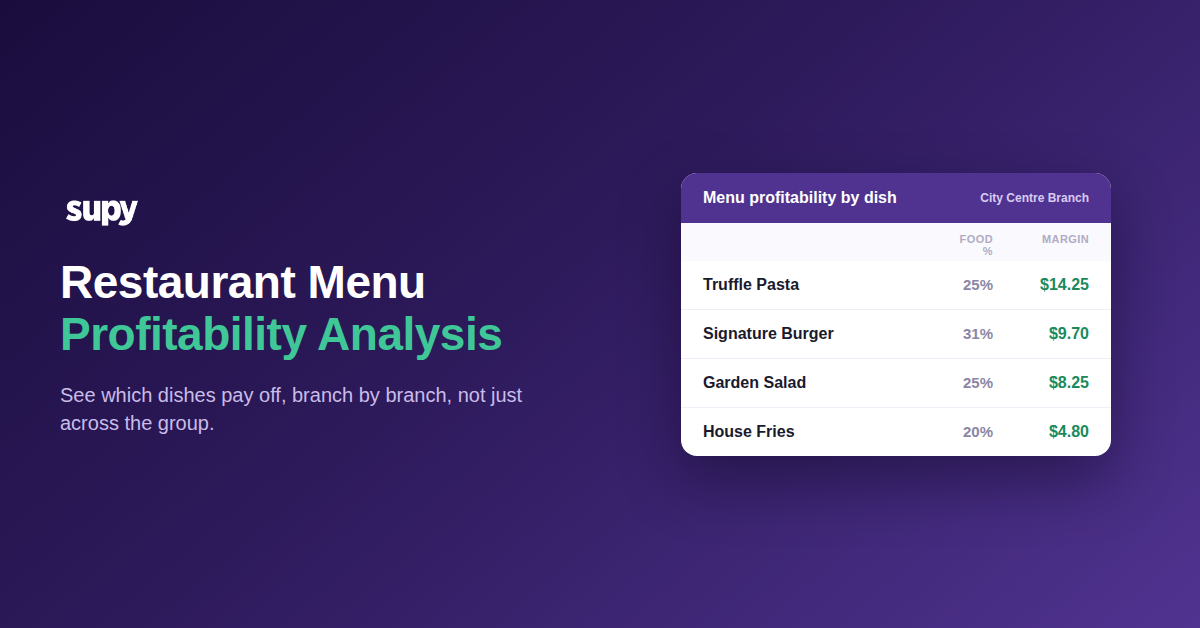
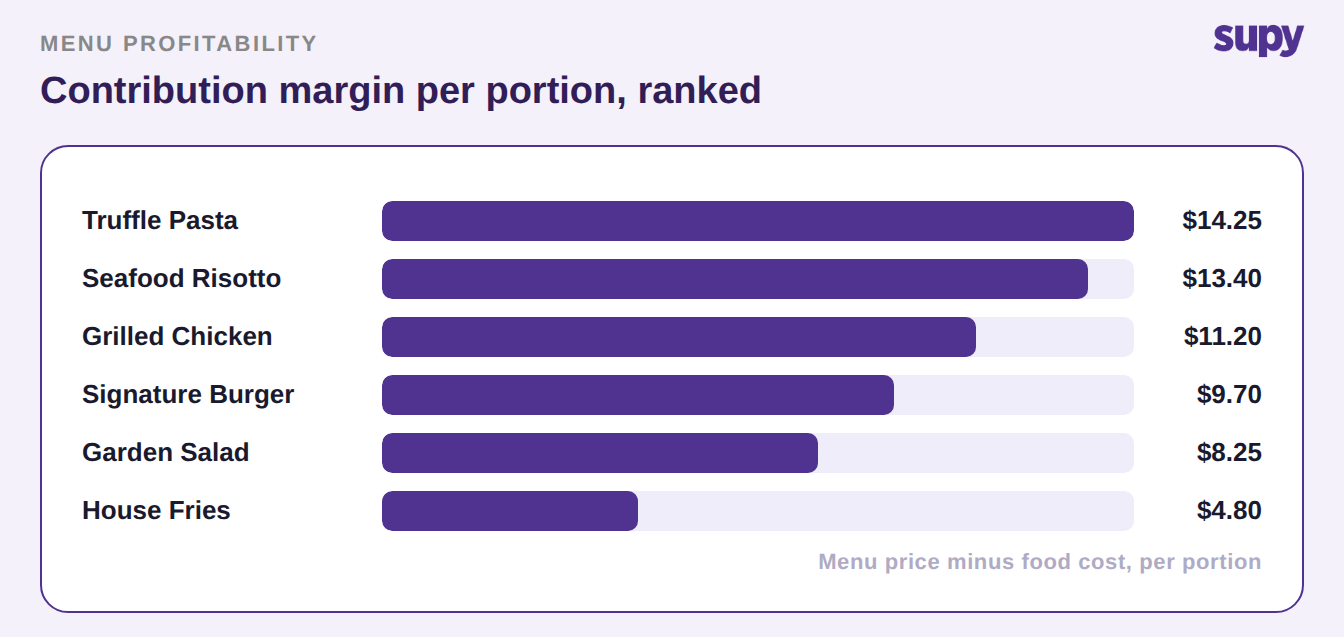
Supy builds this view for each recipe and shows the food-cost portion and profit margin side by side, so a manager can spot the most and least profitable dishes without reading rows of numbers. The chart below ranks a sample menu by contribution margin per portion.
Start With Each Dish's True Cost to Make
The whole analysis stands on one number: what a portion actually costs to produce. Get that wrong and every ranking above it is wrong too. The most common error is pulling cost of goods from purchase totals in your accounting software, which moves with buying, not with the menu.
Cost each dish from its recipe instead. Supy calculates a theoretical food cost per portion for every recipe, adjusting ingredient quantities for prep wastage. The figure reflects real kitchen usage, not the raw weight on the invoice. Trimming, peeling and yield loss are part of the true cost, and leaving them out understates it on every plate.
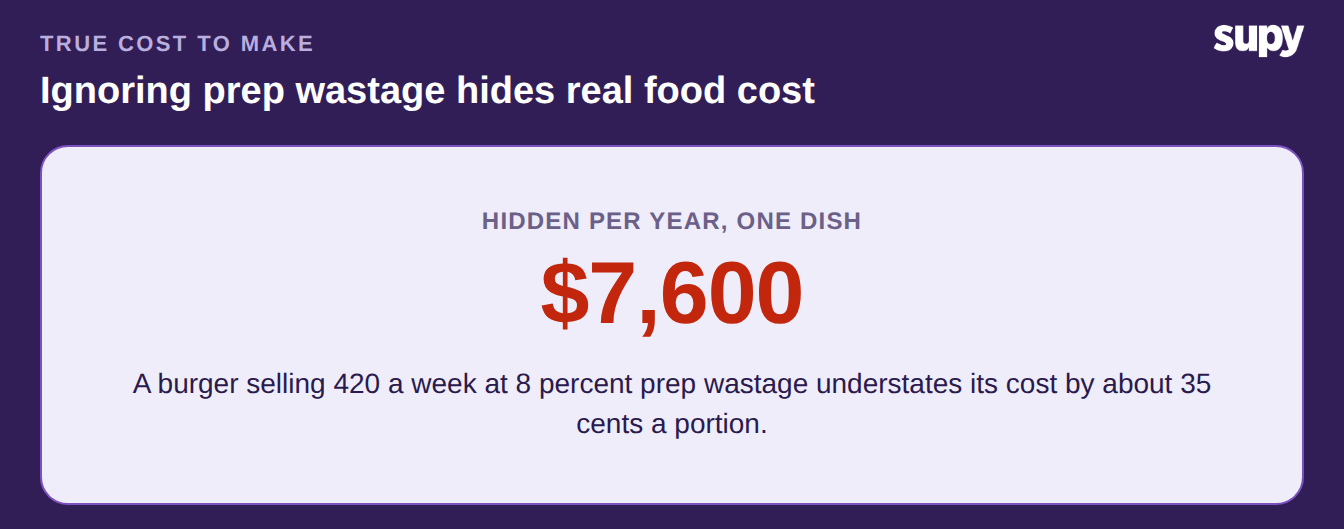
The gap is small per portion and large per year. On a burger selling 420 a week, ignoring 8 percent prep wastage hides about 35 cents a portion, or roughly 7,600 dollars a year on that one dish.
If you are still costing recipes by hand, a food cost calculator is a fast way to check one dish before you build the full menu. Supy's recipe and prep-recipe costing then keeps every plate updated as prices move.
Cost the Same Dish at Every Branch, Not Once for the Group
Here is where a group analysis differs from a single-site one. Purchase prices are not the same at every location, so the same recipe carries a different food cost per branch. Cost the menu once for the group and you average away the exact differences you opened the analysis to find.
Supy costs each recipe against the purchase prices at that specific branch. The result is a per-site margin for every dish, which is the only way to see that a plate paying its way downtown is losing money by the airport. The table below shows one burger at a fixed 14-dollar menu price across three branches.
| Branch | Ingredient cost | Food cost % | Contribution margin |
|---|---|---|---|
| City Centre Branch | $3.90 | 28% | $10.10 |
| Harbour View | $4.55 | 33% | $9.45 |
| Airport Outlet | $4.80 | 34% | $9.20 |
Six points of food-cost spread on one dish is not a rounding error. It points at a supplier price, a portioning habit or a substitution at one site, and you can only act on it once the number is broken out by branch.
Rank Every Dish, Then Act on the Four Groups
Once each dish has a real per-site margin, sort the menu by two things at once: how much it sells and how much it earns. That is the menu engineering matrix, and it splits the menu into four groups that each call for a different move.
Stars sell well and earn well, so protect them and never change the recipe under cost pressure. Plow Horses sell well but earn little, so re-cost or nudge the price. Puzzles earn well but sell little, so give them menu position and a server mention. Dogs do neither, so rework or cut them. Supy plots this quadrant in its analytics dashboards and lets you filter it by site, category or dish.
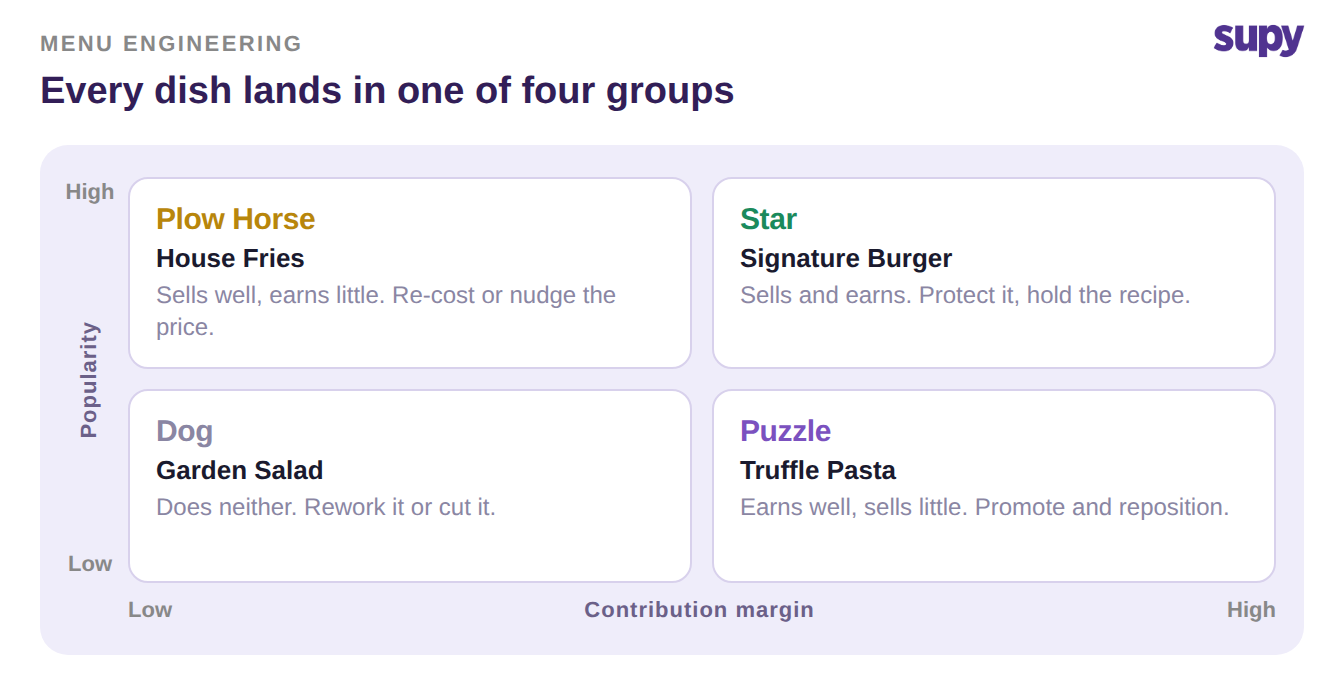
The four labels are a starting point, not a verdict. A Puzzle at one branch can be a Star at another, because footfall and pricing differ by site. That is the deeper version of the per-site rule, and our guide to menu engineering treats the quadrant as a per-location call.
Keep the Analysis Live With Per-Site Targets
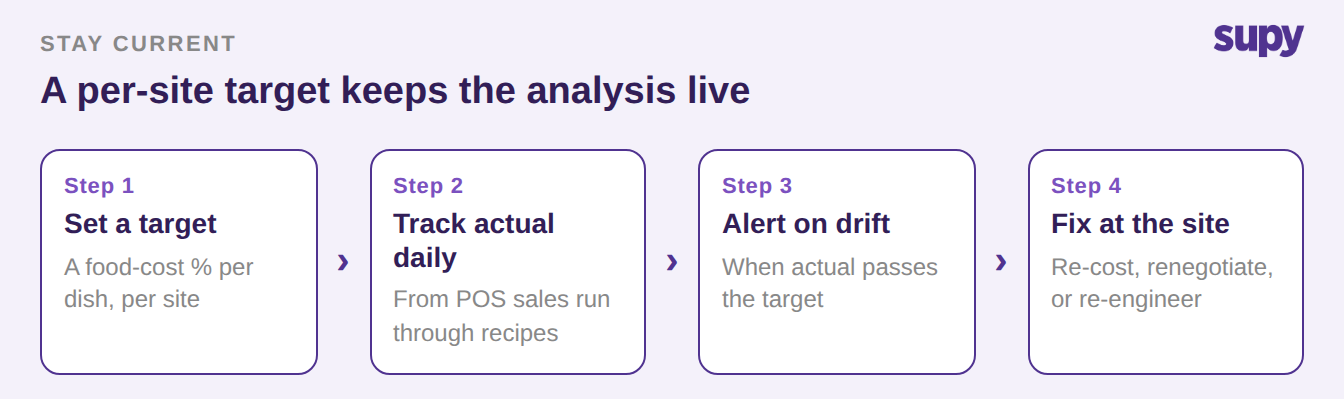
A menu profitability analysis run once is out of date the next time a supplier changes a price. The point is to keep it current without redoing the work every month. Set a target food-cost percentage for each dish at each site, and let the system watch the actual against it.
Supy alerts the team when a recipe's actual ingredient cost passes its target at a location. Drift is caught in days, not found in a month-end review.
It reads actual usage from POS sales run through your recipes. So the analysis is only as trustworthy as the count and variance discipline underneath it. A site running 18 to 20 percent stock variance cannot trust any margin read until the counting is fixed first.
Your first move is small and specific. Pull food cost by dish for your worst-performing site, sort ascending by margin, and look at the bottom handful of dishes against your target percentage.
When a dish is above target at one site but fine across the group, the fix is local. Look at a supplier price, a portion, or a recipe that drifted. Fix that before you touch the menu, and you have turned a static report into a running control.