.jpg)


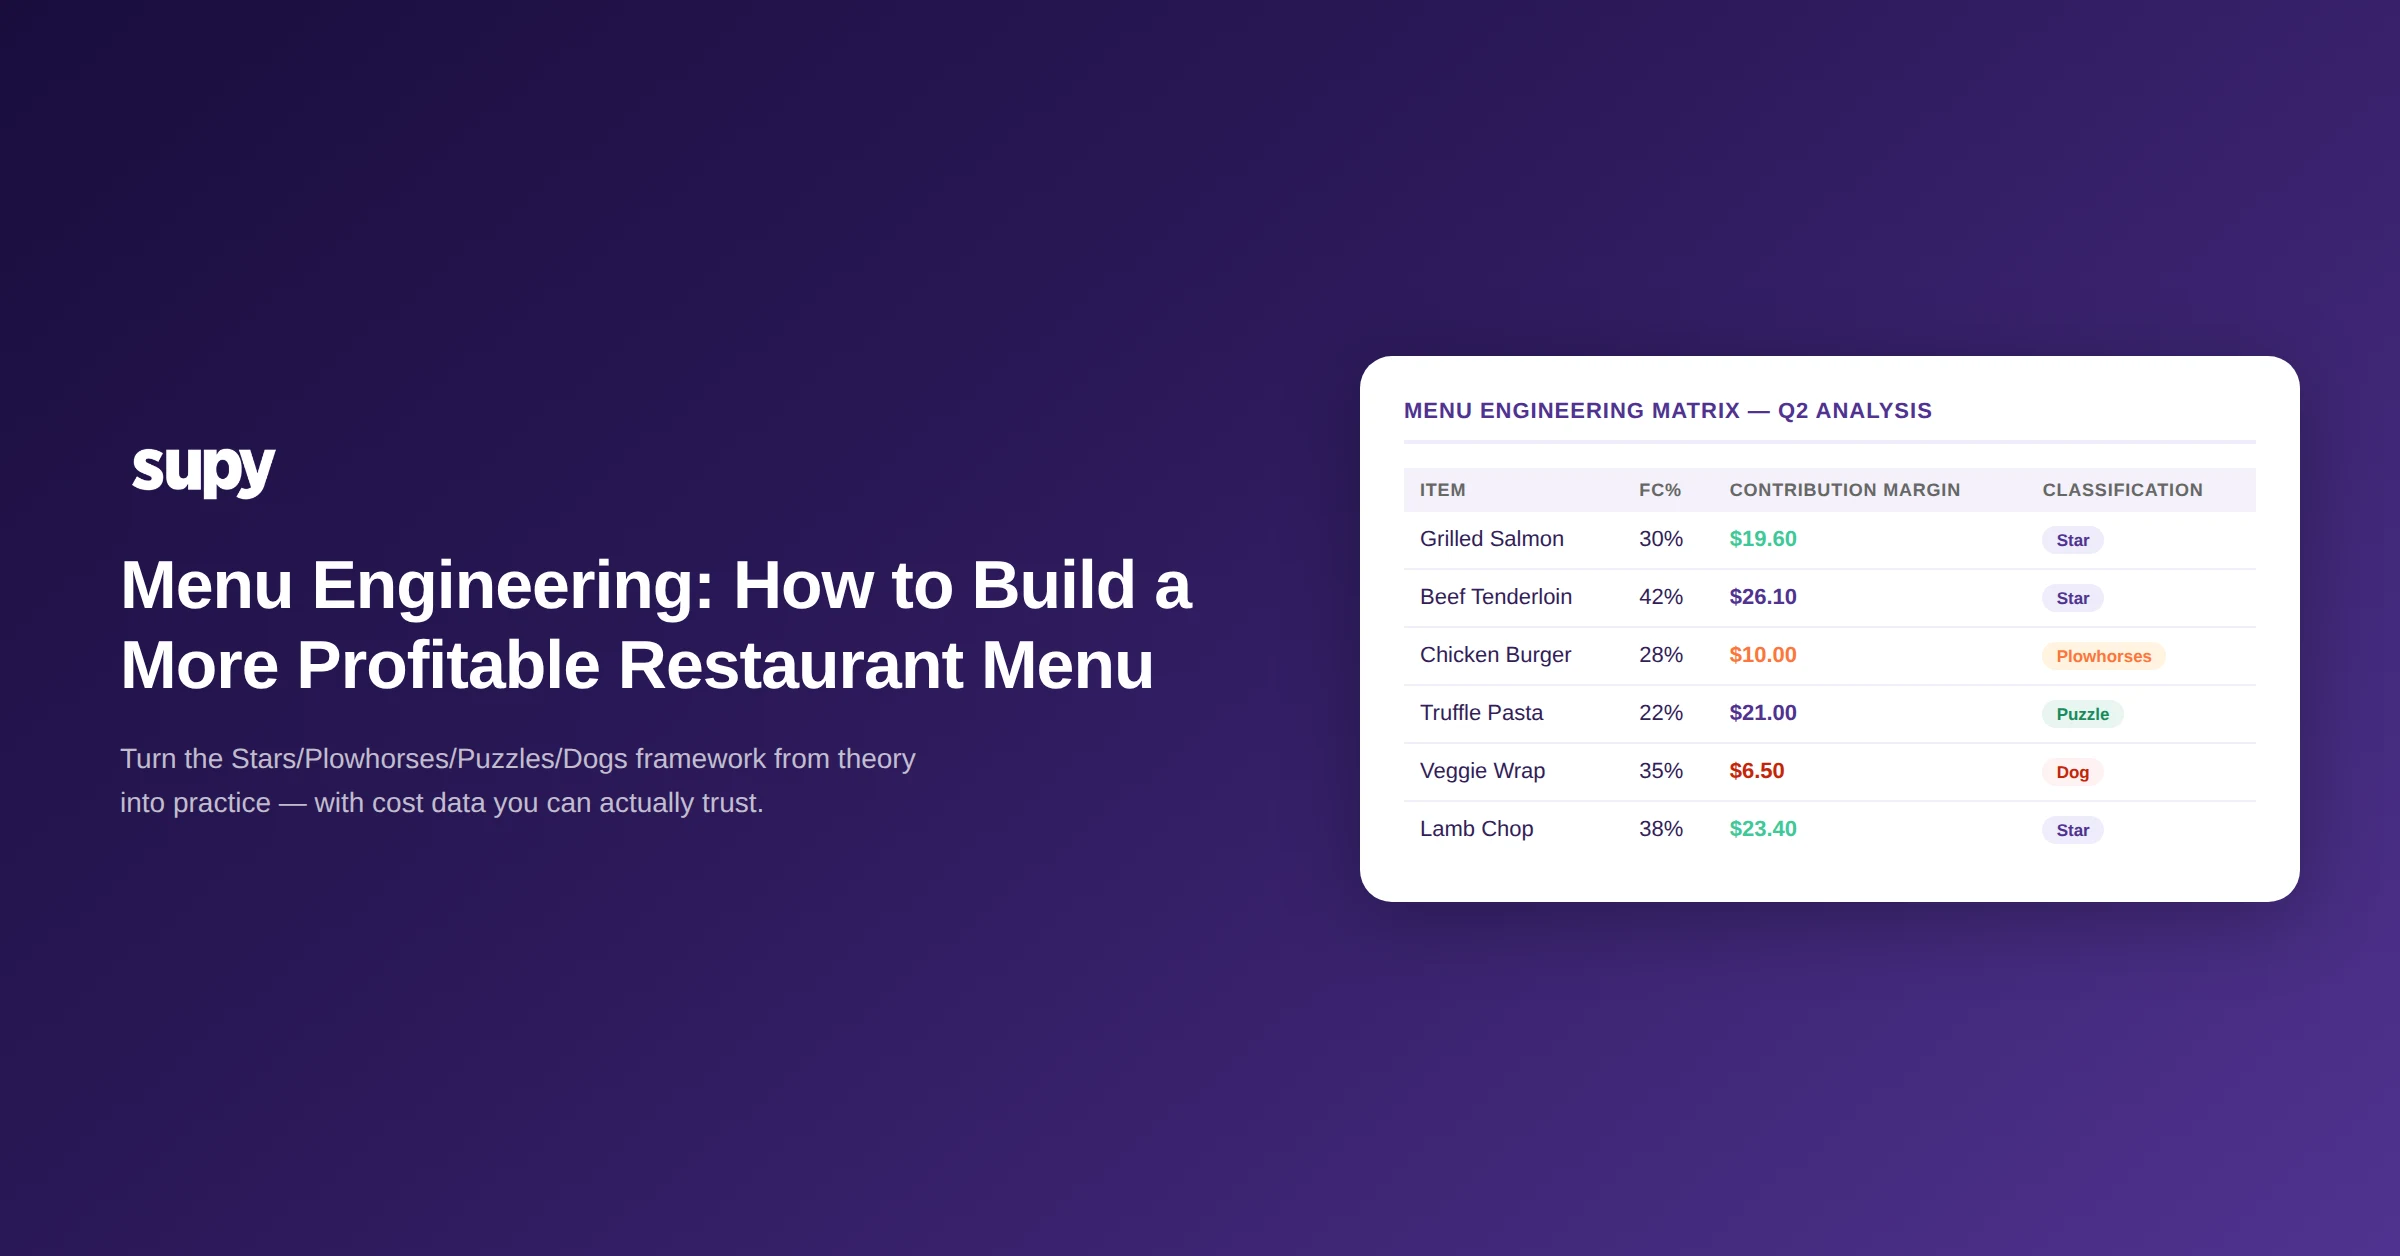
Menu Engineering: How to Build a More Profitable Restaurant Menu
The Menu Engineering Problem No One Talks About
Most restaurant operators have heard of menu engineering. Stars, Plowhorses, Puzzles, Dogs - the four-quadrant matrix that separates high-margin winners from margin destroyers. The framework has been around since the 1980s. Operators know it works in theory.
The problem is not the framework. The problem is the data.
Before you can place a single dish in the menu engineering matrix, you need two reliable numbers: contribution margin and popularity. Contribution margin requires accurate recipe costs. Accurate recipe costs require live ingredient pricing linked to your actual supplier invoices - not last month's spreadsheet, not an estimate rounded to the nearest dollar.
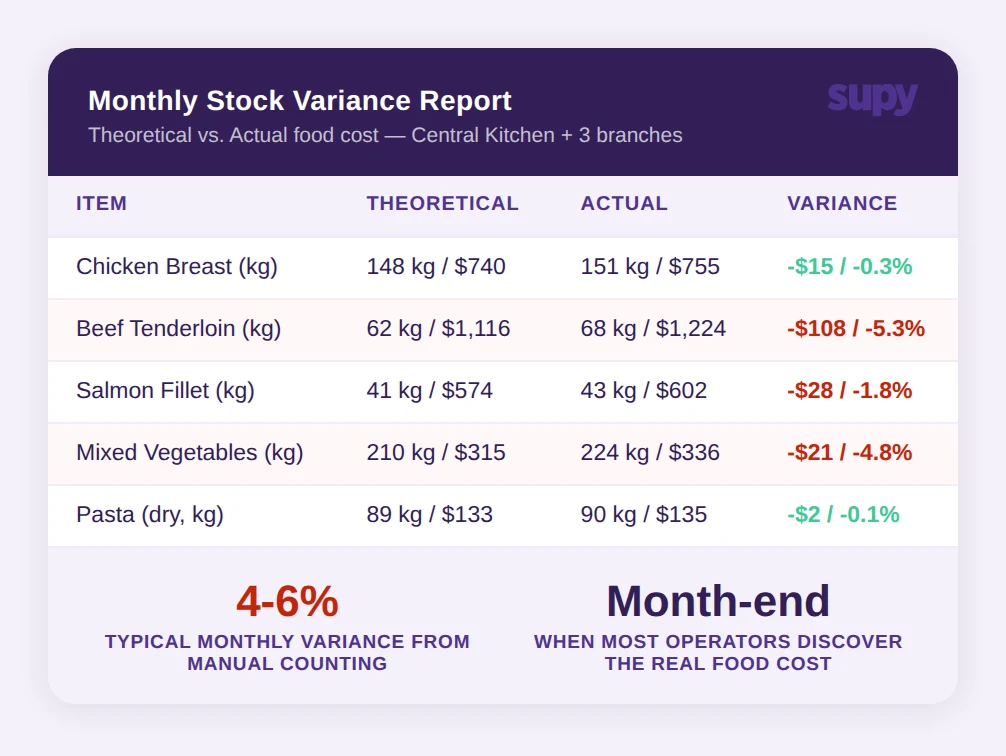
In most operations, that data does not exist. Manual stock counts introduce 4-6% monthly food cost variance. Operators discover their real food cost at month-end, weeks after the damage is done. A dish that looked profitable in January may have turned into a margin drain by March - and no one knew until quarter-end.
This is why menu engineering stays theoretical for most operators. The matrix is sound. The inputs are broken.
This guide walks through how to fix the inputs first, then apply menu engineering with the confidence that your numbers are real.
What Menu Engineering Actually Means
Menu engineering is the systematic process of analysing each item on your menu by two dimensions: contribution margin (how much profit the dish generates per sale) and popularity (how often guests order it). Plotting every item against those two axes produces the classic four categories:
- Stars - high margin, high popularity. Protect these. Feature them prominently.
- Plowhorses - low margin, high popularity. Guests love them but they cost you. These need cost reduction or careful repositioning.
- Puzzles - high margin, low popularity. Profitable when ordered but underordered. Consider repositioning, renaming, or highlighting.
- Dogs - low margin, low popularity. Candidates for removal unless they serve a specific strategic purpose.
The goal of menu engineering is not to eliminate every Dog or turn every Plowhorses into a Star. It is to make deliberate decisions - backed by numbers - about what to feature, what to price differently, what to redesign, and what to retire.
Research shows that 71% of guests make ordering decisions based on menu design and placement. That means where you position a dish matters almost as much as what it costs to make. Menu engineering combines profitability analysis with menu design to put your highest-margin items in front of guests at the moment they are most likely to order.
Why Your Ingredient Cost Data Is Probably Wrong
Here is the uncomfortable truth: most food cost figures that operators use for menu engineering are wrong before the analysis even starts.
The reasons stack up quickly. Recipes are costed at a point in time and rarely updated as supplier prices change. Food-away-from-home prices have risen 3.9% year-on-year, with meats and beverages up 5.2-5.3%. A recipe costed six months ago - even a carefully built one - reflects a price environment that no longer exists.
Then there is the manual stock problem. Operations relying on manual counting across multiple locations introduce 4-6% variance in reported food cost every month. That variance distorts the cost side of every contribution margin calculation. If your cost inputs are off by even 3%, a dish that looks like a Star could be a Plowhorses, and a dish you are about to retire could be quietly profitable.
Multi-location operators face the additional complexity that the same dish carries different costs at different sites. Central kitchens, regional supplier contracts, and delivery distances all affect the true cost of a portion. Spreadsheet-based analysis breaks down entirely when you are trying to run a unified menu engineering review across 50 or more locations.
The fix is not a better spreadsheet. The fix is connecting your recipe costs directly to live supplier invoices - so every time a delivery comes in, the cost of every recipe that uses that ingredient updates automatically.
How to Build the Data Foundation for Menu Engineering
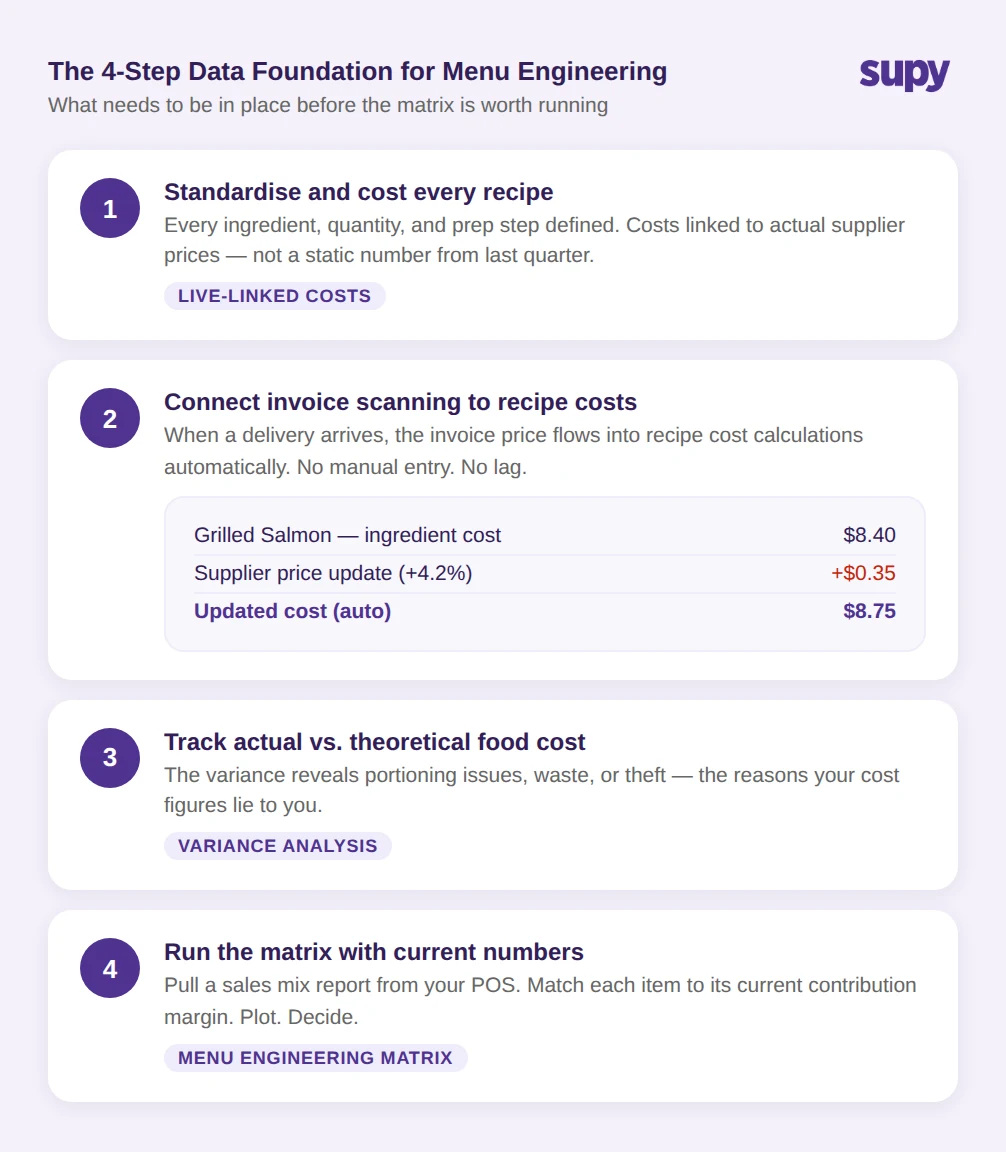
Before running a menu engineering analysis, you need three things working together: standardised recipes with accurate costing, real-time inventory tracking, and supplier invoice data feeding directly into your cost calculations.
Step 1 - Standardise and cost every recipe. This means defining every ingredient, quantity, and prep step for each menu item. Most operators have recipes. Fewer have costed recipes. Fewer still have costed recipes that update when a supplier raises prices. Start here. Get every recipe into a system where cost is calculated automatically from your actual ingredient prices, not from a static number someone entered last quarter.
Step 2 - Connect invoice scanning to recipe costs. When a delivery arrives, the invoice price should flow directly into your recipe cost calculations. This is where most operators still have a gap - invoices are processed manually, entered into a separate system, or simply filed. Supy's invoice scanning captures supplier invoice data automatically and links price changes directly to affected recipes, so your contribution margin figures stay current without manual intervention.
Step 3 - Track actual versus theoretical food cost by item. Theoretical food cost is what your recipes say you should be spending. Actual food cost is what you are actually spending. The variance between the two reveals portioning inconsistency, waste, or theft - the three main reasons your cost figures lie to you. Without this variance analysis, you are engineering a menu against numbers that don't reflect what is happening in your kitchen.
Step 4 - Run the matrix with current numbers. Once your cost data is live and accurate, pull a sales mix report from your POS for the period you want to analyse. Match each item's sales count to its current contribution margin. Plot the matrix. Now you have a menu engineering analysis worth acting on.
For operators managing 10 or more locations, this process needs to happen at scale - with each location's ingredient costs reflecting its actual supplier prices, not a blended average. A centralised platform with multi-site inventory management is not optional at that scale; it is the only way to run this analysis reliably.
Contribution Margin vs Food Cost Percentage: Which Number Drives Menu Engineering
Operators often default to food cost percentage as their primary profitability metric. It is familiar, easy to calculate, and widely benchmarked. But food cost percentage is the wrong lens for menu engineering.
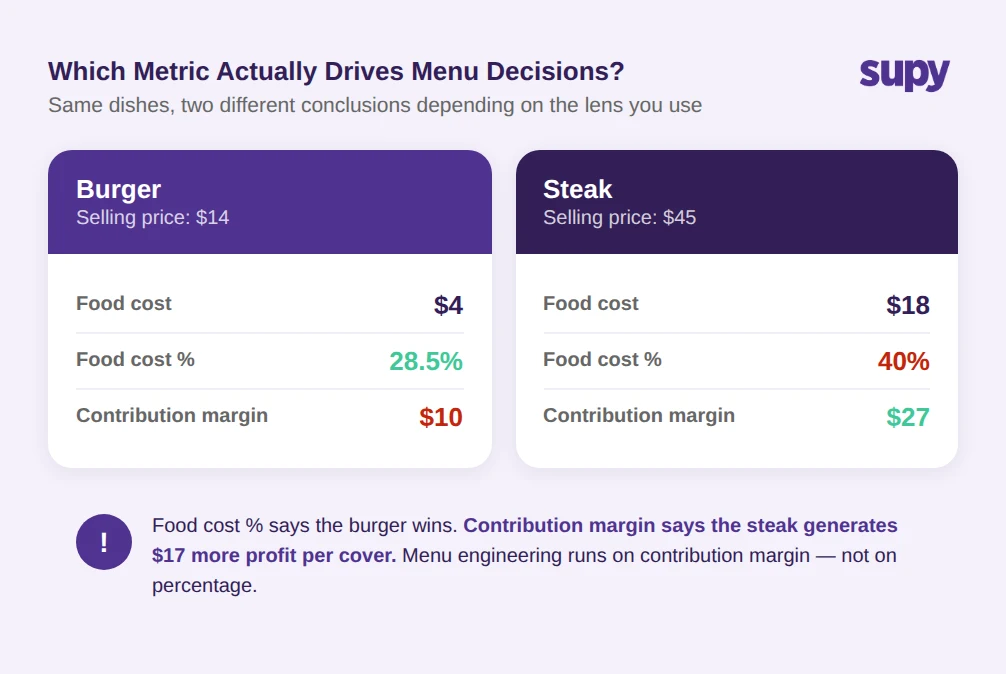
Consider two dishes. A burger with a $4 food cost and a $14 selling price has a food cost percentage of 28.5%. A steak with a $18 food cost and a $45 selling price has a food cost percentage of 40%. By food cost percentage logic, the burger is the better performer.
But contribution margin tells a different story. The burger contributes $10 to cover labour, overhead, and profit. The steak contributes $27. If your kitchen can produce both with similar labour effort, the steak is the menu engineering priority - even with a higher food cost percentage.
Menu engineering runs on contribution margin, not food cost percentage. Targeting a prime cost range of 60-65% of revenue is a useful operational benchmark, but within that constraint, you want to maximise contribution dollars per cover, not minimise food cost percentage.
This also changes how you evaluate Plowhorses. A high-volume, low-margin dish may still generate significant total contribution dollars if it drives covers. The decision to retire, reprice, or reduce the cost of a Plowhorses should be based on its total contribution to the business - not just its individual margin percentage.
Menu Engineering for Multi-Location and Multi-Concept Operators
Single-location menu engineering is manageable with relatively simple tools. The analysis becomes significantly more complex the moment you have multiple locations, different menus across concepts, or varying supplier relationships by region.
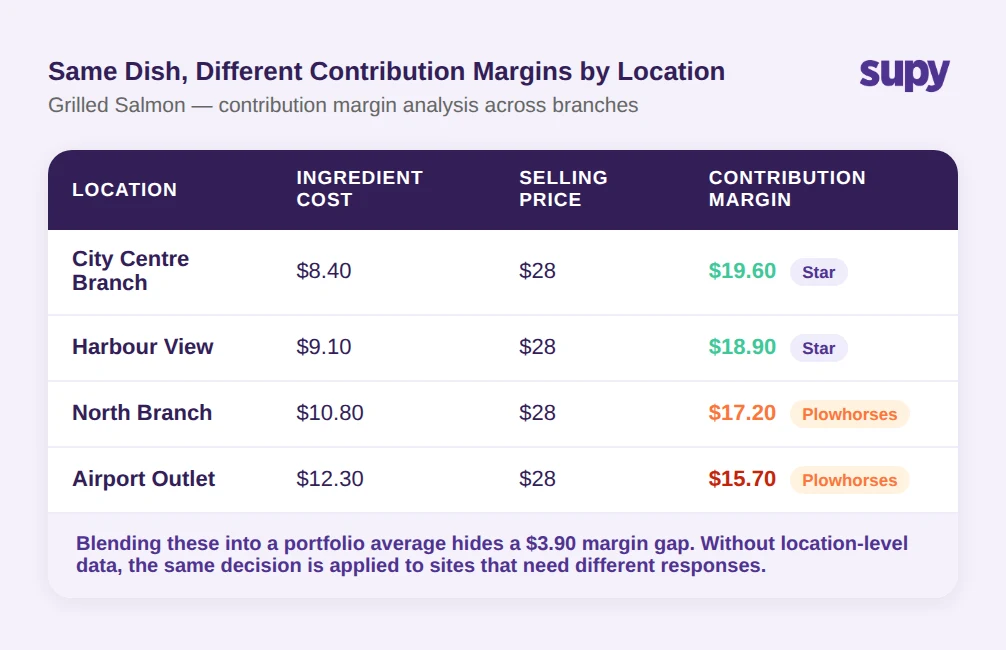
The core challenge is that the same dish genuinely costs different amounts at different sites. A chicken breast priced differently by two regional suppliers means the same item has two contribution margins depending on where it is sold. Any unified menu engineering review needs to surface those location-level differences, not average them away.
For operators running 10-50 locations, this means you need a platform that tracks recipe costs independently at each site while giving you a consolidated view for cross-portfolio decisions. You need to know which sites are running a particular dish profitably and which sites are running it at a margin that does not justify the menu real estate.
Ingredient price volatility compounds the problem. If a supplier raises prices on a key protein midway through a quarter, that affects every recipe using that ingredient at every location supplied by that vendor. Without automated cost cascading - where one invoice price change updates all downstream recipe costs automatically - your menu engineering data is stale almost as soon as it is generated.
Supy's platform handles this through live recipe costing with automated invoice integration, multi-site inventory tracking across 75+ integrations with POS systems, suppliers, and accounting platforms. Operators using AI Sales Forecasting get 14-day demand predictions that feed directly into purchasing decisions - so you are not just engineering the menu you have, but ordering for the menu you expect to sell.
For operators looking to build this data foundation, food costing software is the starting point - it is what converts static recipe cards into live, invoice-linked cost calculations that menu engineering requires.
What to Do After You Run the Matrix
The matrix gives you a classification. What you do with it is the harder part - and where most menu engineering guides stop short.
Stars: Protect them. Feature them in prime menu real estate - top-right on a physical menu, lead positions on a digital menu. Make sure kitchen execution is consistent so the item earns its popularity. Resist the urge to cut costs on Stars; maintaining their quality is what keeps them in the upper-right quadrant.
Plowhorses: These need cost reduction without quality compromise. That might mean engineering the portion size, substituting a lower-cost but comparable ingredient, or finding a different supplier. If cost reduction is not viable, consider a price increase - but test it carefully, because Plowhorses are popular and a price that crosses a guest's mental threshold can kill volume. Some Plowhorses are worth retaining even at thin margins if they serve as a customer acquisition driver or anchor a wider dining occasion.
Puzzles: High-margin items that guests are not ordering enough. The cause is almost always visibility or framing. Rename the dish to make it more appealing. Move it to a more prominent position. Train front-of-house staff to recommend it. Add a photograph if your format allows. Puzzles represent unrealised profit - they are worth investing effort to improve.
Dogs: Remove them unless there is a specific reason to keep them. Dogs occupy menu space, complicate kitchen prep, and tie up inventory. The exception is a Dog that anchors a set menu, satisfies a regulatory requirement (allergen range), or serves a specific demographic segment that matters commercially. If you keep a Dog, know exactly why.
After each menu engineering cycle, run a food cost variance analysis to verify that your actions produced the expected results. If you repositioned a Puzzle and its popularity has not moved after 60 days, the issue may be execution rather than position. If you repriced a Plowhorses and volume dropped, you may have crossed a price ceiling. The matrix is a starting point, not a one-time exercise.
Building a Menu Engineering Cadence That Keeps Up With Price Volatility
Annual menu reviews are not sufficient in an environment where ingredient costs shift monthly. A 2% rise in food costs can eliminate up to 50% of profit margin if not offset by pricing or menu adjustments. By the time a quarterly review surfaces the problem, a formerly profitable dish may have traded at a loss for 90 days.
The alternative is a continuous menu engineering cadence - not a monthly deep analysis, but a live dashboard where contribution margins update automatically as supplier invoice prices change. When a key ingredient moves in price, you want to know immediately which dishes are affected, by how much, and whether any of those dishes are crossing a threshold that changes their matrix classification.
This is what live costing infrastructure enables. Instead of running menu engineering as a periodic project, it becomes an ongoing operational practice. You catch the Plowhorses turning into Dogs before it costs you a quarter's margin. You identify the Star whose food cost has quietly crept up because of a supplier price change no one flagged.
For operators building this capability, the logical starting point is recipe management software that connects to live supplier pricing - because without that connection, every menu engineering analysis you run is already out of date.
Make Menu Engineering Executable, Not Just Theoretical
Menu engineering works. The operators who get the most from it are not the ones with the most sophisticated frameworks - they are the ones with the most reliable cost data. They know what every dish costs today, not last quarter. They catch price changes before they erode margins. They can run the matrix across every location in their portfolio without spreadsheets.
The Stars/Plowhorses/Puzzles/Dogs framework gives you the structure. Live recipe costing linked to supplier invoices gives you the numbers you can trust. Put both together and menu engineering moves from a periodic exercise into a continuous advantage.
If you are managing food costs manually across multiple locations, the first step is not running the matrix - it is fixing the data infrastructure that makes the matrix reliable. That means standardised, costed recipes linked to live supplier pricing, automated invoice processing, and real-time visibility into actual versus theoretical food cost at every site.
Once that foundation is in place, menu engineering becomes what it was always meant to be: a practical, ongoing tool for protecting and growing margins.