.jpg)


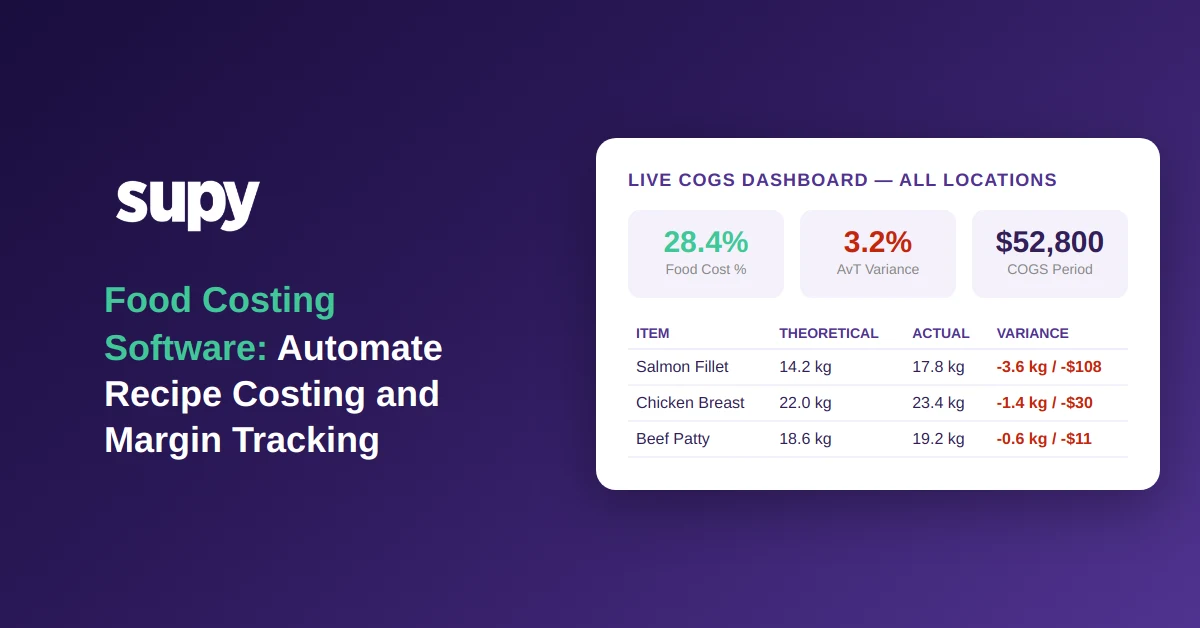
Food Costing Software: Automate Recipe Costing and Margin Tracking
Why Food Cost Visibility Changes Before You Can Act on It
The gap between when a cost problem starts and when it surfaces through manual processes can be weeks. One mid-sized restaurant group operating across multiple locations ran at a 38% food cost for six full weeks before their spreadsheet-based reconciliation process caught it. By that point, corrective action - whether a supplier conversation, portion review, or menu price adjustment - was delayed by over a month of compounding loss.
That delay is not unusual. Spreadsheet-based food costing typically runs on weekly or monthly cycles: stock counts happen, data is typed in, formulas run, and variance becomes visible only after the fact. If the problem is portioning inconsistency at one location, or a supplier invoice error, or a product substitution that changed the cost basis of a dish, that issue continues silently until the next reconciliation.
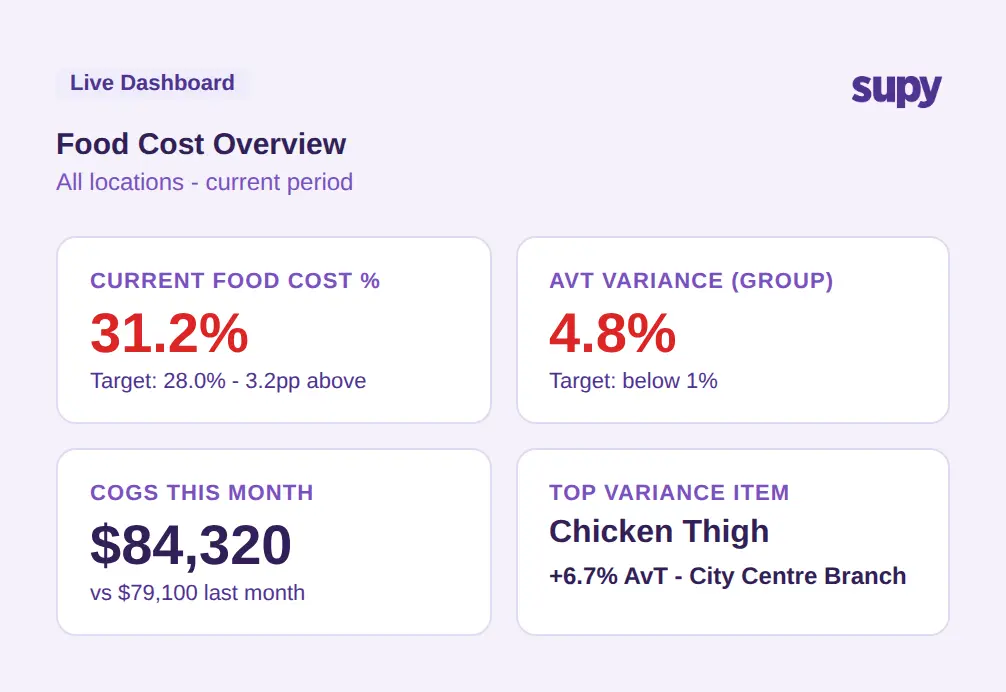
The switching trigger for most operators who move from spreadsheets to dedicated food costing software is real-time COGS visibility - the ability to see current food cost percentage at any point during a period, not just at close. When actual consumption data flows from POS sales into recipe costing automatically, the cost picture updates continuously rather than once per cycle.
What to ask a vendor: At what latency does food cost percentage update after a sale is recorded? Is COGS calculated from recipe-level data or estimated from purchase totals?
How Food Costing Software Connects Recipe Data to Real Margins
The value of food costing software depends almost entirely on whether recipe data is connected to real purchasing costs and real sales volumes. A recipe that stores a theoretical food cost percentage but does not update when ingredient prices change - or does not link to which dishes sold today - is not materially different from a static spreadsheet.
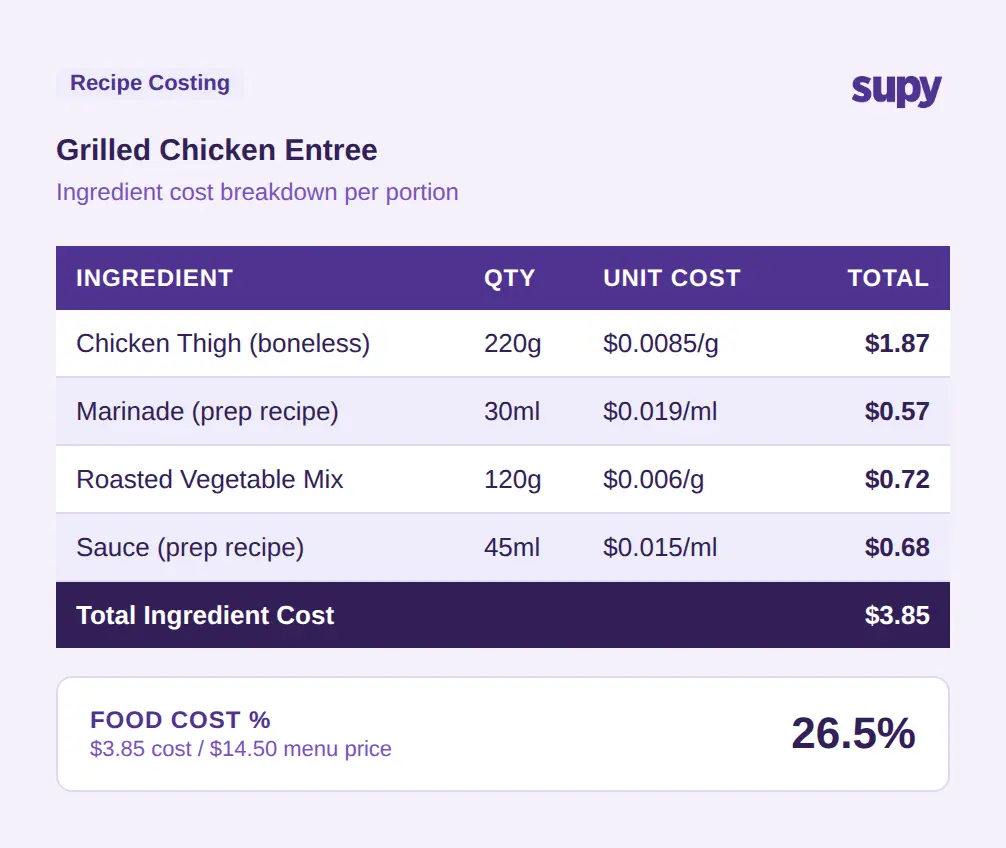
Effective recipe costing software links three data points: the ingredient quantities in each recipe, the current purchase cost of those ingredients, and the sales volume of each dish from the POS. When all three are connected, the system can calculate a real cost-of-goods figure for any period without manual input.
For multi-unit operations, this connection also needs to handle prep recipes - semi-finished items produced in a central kitchen and used across locations. A chicken thigh marinated and portioned centrally is an ingredient in six different menu items across eight branches. If the prep recipe is costed correctly and linked to each finished dish, the food cost calculation at branch level is accurate. Without that linkage, cost allocation at location level becomes an approximation.
The POS integration layer matters significantly here. If a menu item has modifiers - a burger with optional add-ons that each carry an ingredient cost - the costing system needs to account for modifier-level consumption, not just the base dish. Systems that only cost at the dish level without modifier handling will undercount actual ingredient use in operations with complex menus.
See also: recipe management software for a deeper look at how recipe databases are structured and maintained.
What to ask a vendor: Does your recipe costing system update in real time when supplier invoice prices change? How are prep recipes and central kitchen production tracked across locations?
Reading the Variance - Theoretical vs Actual in Practice
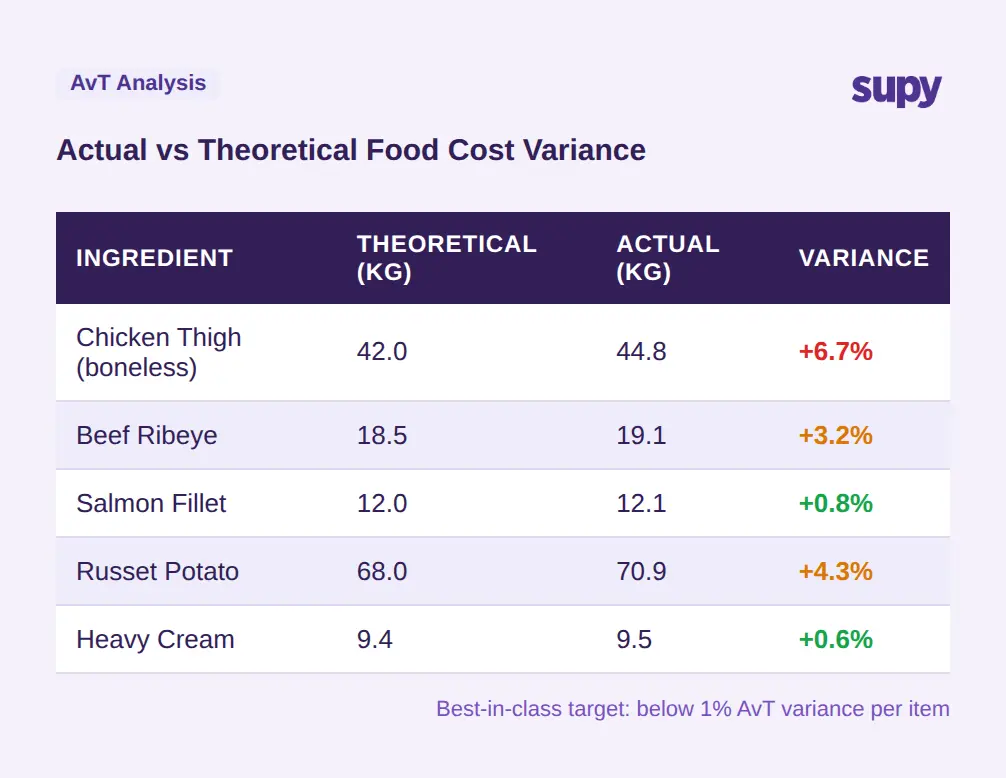
Actual vs Theoretical (AvT) variance is the single most useful number in food costing. Theoretical usage is what the kitchen should have used based on recipes and recorded sales volumes. Actual usage is what stock counts show was consumed. The gap between the two - expressed as a percentage of theoretical - reveals where product is going that is not accounted for by sales.
Multi-location QSR operators running manual stock counts commonly experience 4-6% monthly food cost variance. That variance is spread across portioning inconsistency, waste that is not recorded, supplier discrepancies, and shrinkage. Without a system that separates these categories, the variance figure is a total loss number with no diagnostic value. It tells operators they have a problem but not where it is or what is causing it.
Best-in-class multi-unit operators target AvT variance below 1%. Reaching that level requires being able to see variance at item level, by location, and by category - not just as a group-wide percentage. If one location is running 8% variance on protein and another is running 0.5%, the investigation is different. Without granular visibility, managers investigate everywhere and correct nothing specifically.
The operational implication is timing. When variance is visible weekly or daily, a manager can observe a pattern and investigate within the same period - talking to the team, checking deliveries, reviewing portioning. When variance is only visible at month-end, the people involved may not remember the specific events that drove the number, and corrective conversations happen retrospectively.
For a full treatment of the inventory side of this problem, see restaurant inventory software.
What to ask a vendor: Can your system show AvT variance by item, location, and time period? Does it separate waste type categories (prep waste, portioning, spoilage, recording loss)?
Menu Engineering: Which Dishes Are Actually Making You Money
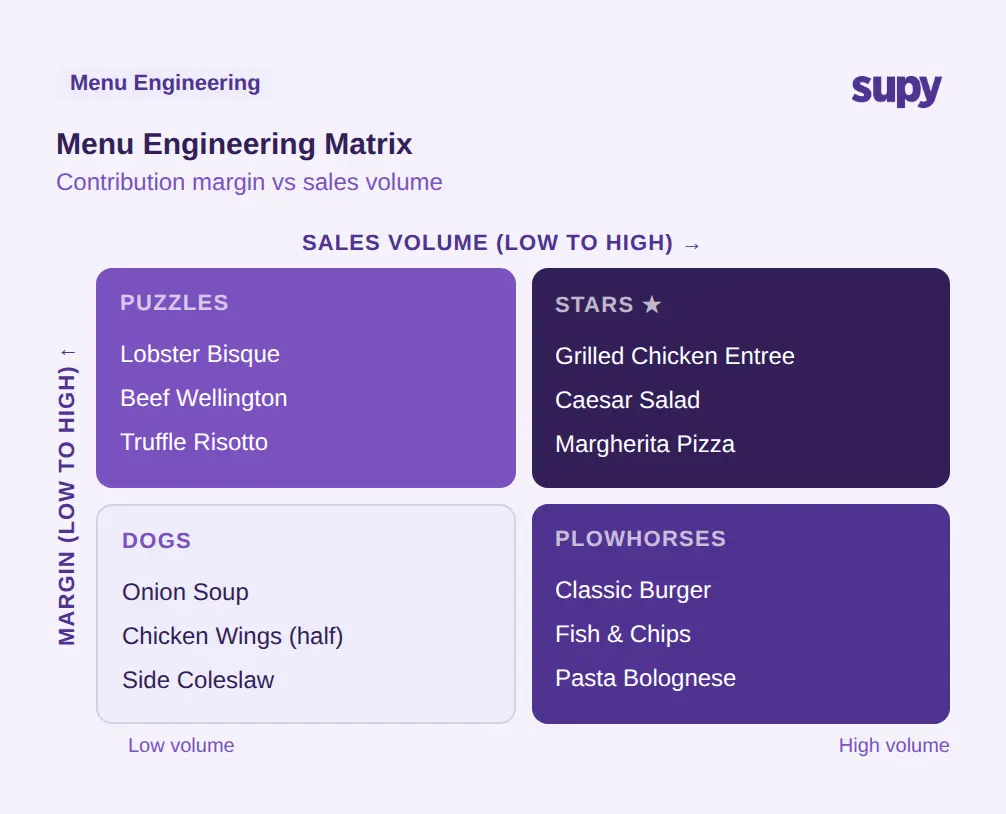
Menu engineering applies a straightforward two-axis framework to every dish on a menu: contribution margin (what the dish earns per cover) versus popularity (how frequently it sells). The four resulting categories - Stars, Plowhorses, Puzzles, and Dogs - give operators a decision framework for each item rather than an average across the full menu.
Stars are high-margin and high-volume. They fund the operation and should be protected. Plowhorses are high-volume but low-margin - they drive traffic but erode cost percentage as volume grows. Puzzles are high-margin but low-selling items that may benefit from promotion or repositioning. Dogs are low-margin and low-volume candidates for removal or reformulation.
The challenge for multi-unit operators is that this analysis needs to run across locations, not just at aggregate level. A dish that is a Star at the central city location may be a Dog at an airport outlet. Menu decisions made on group averages may be counterproductive at individual site level.
Food costing software that integrates menu engineering into dashboards allows operators to filter by site, category, or time period and see the quadrant position of each dish dynamically. As purchase costs change and ingredient prices move, the margin calculation updates automatically - so a dish that was a Star at $3.85 ingredient cost may shift to a Plowhorse if ingredient cost increases materially without a corresponding menu price adjustment.
See also: food cost management software for how menu engineering connects to broader cost management workflows.
What to ask a vendor: Does your menu engineering module update automatically when recipe costs change? Can operators filter by location and see dish-level performance across the matrix?
From Spreadsheet to Live Dashboard: What Food Costing Software Should Deliver
When evaluating food costing platforms, the functional requirements fall into a few non-negotiable categories and several that depend on operational complexity.
Real-time COGS by site and category. The dashboard should show current food cost percentage at group level and drillable to individual site and menu category. This requires live data flow from POS and purchasing, not batch uploads.
Recipe-level cost visibility. Every dish should have a costed recipe that updates when ingredient purchase prices change. The system should flag when a dish exceeds a target cost threshold without requiring manual review.
AvT variance reporting. Theoretical usage should be calculated from recipe data and POS sales. Actual usage should pull from stock counts and GRN data. The delta between the two should be reportable at item level, not just in aggregate.
Multi-location architecture. Dashboards and reporting should natively support filtering and comparison by location. Managers at individual sites should see their site's data; group operators should see comparative views.
Export and reporting. Operations teams need to export data for board reporting, supplier reviews, and period-end analysis. One-click export to Excel or CSV across the main reporting categories - procurement, sales and COGS, recipe costing, stock movement - saves significant manual work each period.
Integration with existing POS. The system should integrate directly with the POS stack already in use, not require switching POS to access costing features.
What to ask a vendor: What is the full list of POS and accounting systems you integrate with? How does stock count data flow into AvT calculation?
What Supy's Food Costing Platform Does
Supy is built for multi-unit restaurant operators who need food costing, recipe management, inventory, and reporting in one connected platform. The following capabilities are live in the current product.
Recipes and prep recipes. Supy's recipe module supports plated dishes, semi-finished prep recipes, non-stockable recipes, and batch production tracking. Recipes link directly to POS menu items including modifiers, so sales data depletes the correct ingredients - including modifier-level consumption. Shrinkage, yields, and prep wastage are built into recipe costing. Target cost percentages can be set per recipe with alerts when actual costs exceed the threshold.
Live stock visibility. Stock-on-hand updates automatically from GRNs and recipe usage as sales are recorded - no manual sync required. Par and minimum thresholds can be set per item per site, with alerts for items falling below minimum. Theoretical vs actual usage comparison is available continuously, not just at period-end.
Interactive dashboards. Live COGS and food cost percentage are available at group, site, menu category, and dish level. AvT variance is visible broken down by type, site, and item. The menu engineering matrix (Stars, Plowhorses, Puzzles, Dogs) is embedded in the dashboards with clickable cross-filtering. Slow-mover identification and profitability by site, category, and dish with drill-down are all available.
Spreadsheet reports. One-click export to Excel or CSV covers procurement (purchase value, orders, invoices, supplier performance), sales and COGS, menu engineering, stock movement and variance, wastage and production with cost impact, and recipe costing at group and site level. Enterprise operators can configure custom report templates.
Integrations. Supy supports 75+ integrations including POS systems: Foodics, Oracle Micros, Oracle Simphony, Revel, Lightspeed, Square, Clover, Toast, and Eats365 - as well as accounting and ERP platforms.
Conclusion
Food costing software addresses a problem that is fundamentally about timing. The margin gap between what food costs should be and what they actually are exists in every operation. The question is whether that gap is visible in real time - and therefore correctable within the period it occurs - or visible at month-end when the loss has already accumulated.
For multi-unit operators, the requirement is granularity: variance visible by item, by location, and by category, with recipe-level cost calculations that update automatically as purchasing prices change. Operators running 4-6% monthly variance through manual processes can meaningfully reduce that figure when the data is continuous rather than periodic.
The shift from spreadsheet reconciliation to live food costing software is not primarily a technology decision. It is a decision about how quickly the operation can see and respond to margin erosion.