.jpg)


Food Cost Management Software for Multi-Site Restaurants
What food cost management software actually does for a multi-site group
Food cost management software connects purchasing, recipes, stock counts and sales so a multi-site group can see what every dish and every location actually costs, and where the real number drifts from the theoretical one. For a single site a spreadsheet can just about cope. Across several kitchens it cannot, because the question stops being "what did we spend" and becomes "why does the same recipe cost more at one branch than another, and which sites are quietly over."
The trap most groups fall into is treating the food cost percentage on a dashboard as a fact. It is only ever as good as the inputs behind it, and at scale those inputs break in specific, repeatable ways. Before trusting any number, it is worth knowing what a complete food cost figure has to pull together in the first place.
| Input | Must include | Commonly missed |
|---|---|---|
| Opening and closing stock | A counted value at both ends of the period | Groups calculating from supplier spend alone, with no leftover stock |
| Purchases | Received cost, not ordered cost | Price increases caught at month-end instead of at receipt |
| Transfers | Stock moved between sites and to the central kitchen | Transfers logged at one end only, so both sites read wrong |
| Wastage and staff meals | Costed and mapped to the right category | Wastage booked as an expense, so it never reaches food cost |
| Sales | Net sales, mapped to depleting recipes | Gross sales, or items that sell without depleting anything |
Every failure mode below is one of those inputs going wrong at the config or process level. Good food cost management software does not just report the percentage; it lets you trace it back to the line that moved it.
Why a 60% food cost is rarely just a purchasing problem
One multi-site operator arrived running food cost at roughly 60% of revenue, close to double the 25% to 30% they were aiming for. It is tempting to read a number that high as a purchasing failure, and the causes they named looked the part: only two suppliers, both raising prices; twice-weekly stock counts kept in a spreadsheet; no system tracking cost variance or invoice discrepancies; and no accounting software at all.
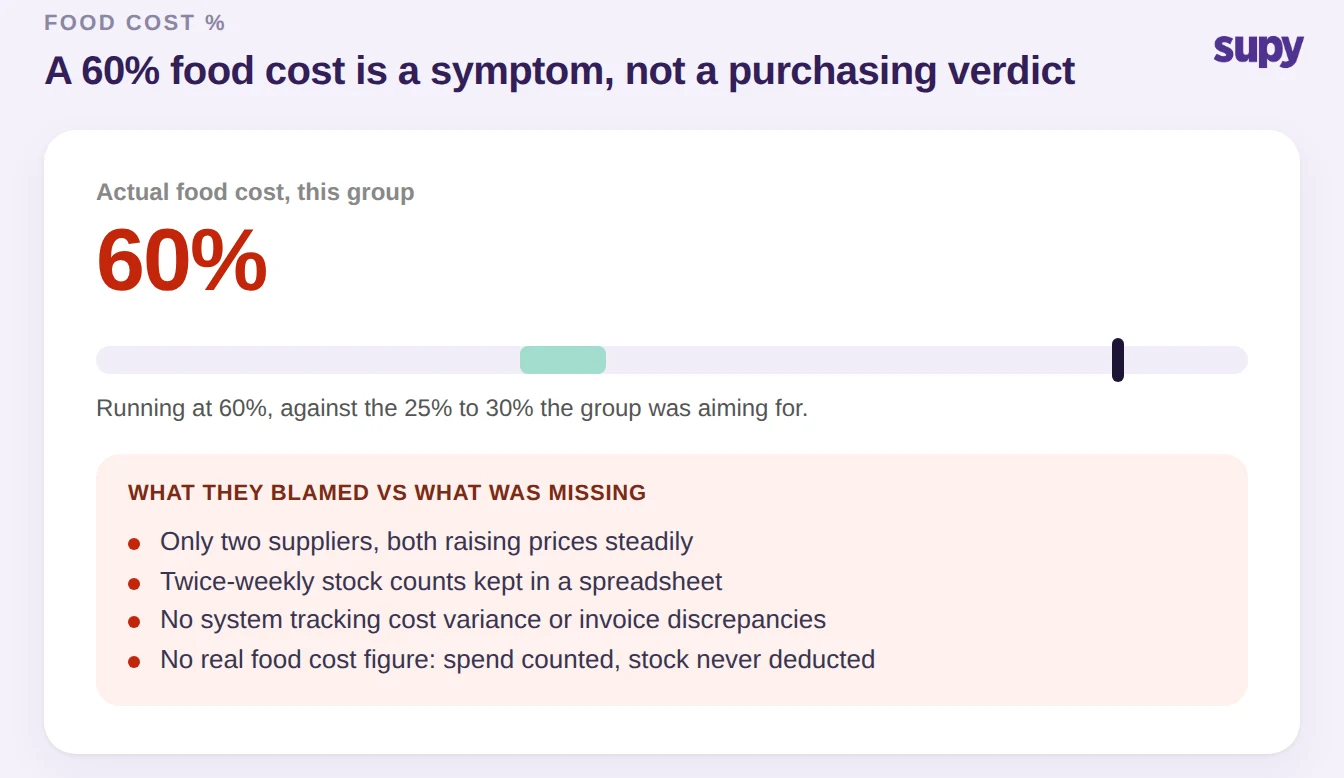
The more useful diagnosis is that a 60% figure is often not a real food cost at all. A common version is spend-only costing: taking total supplier spend for the month and calling it food cost, with no closing stock deducted and no link to what actually sold. That number will always look alarming and will never be actionable, because it measures cash out of the door, not the cost of what left the kitchen as food. The ten-second self-test is simple: if your food cost figure does not subtract the stock still sitting on your shelves at period end, it is a spend total wearing a food cost label.
The fix for this group was not squeezing the two suppliers harder. It was getting a real number first, then finding the specific lines carrying it. That order matters, because the next few sections are all about the number itself being wrong before anyone has miscounted a single shelf.
Your variance is a sales problem before it is a counting problem
Theoretical versus actual variance is the headline metric of food cost management software: what the recipes say you should have used against what the count says you did. When that gap is large, almost everyone reaches for the count. In practice the most repeated cause is on the sales side, and it shows up identically across groups on very different point-of-sale systems.
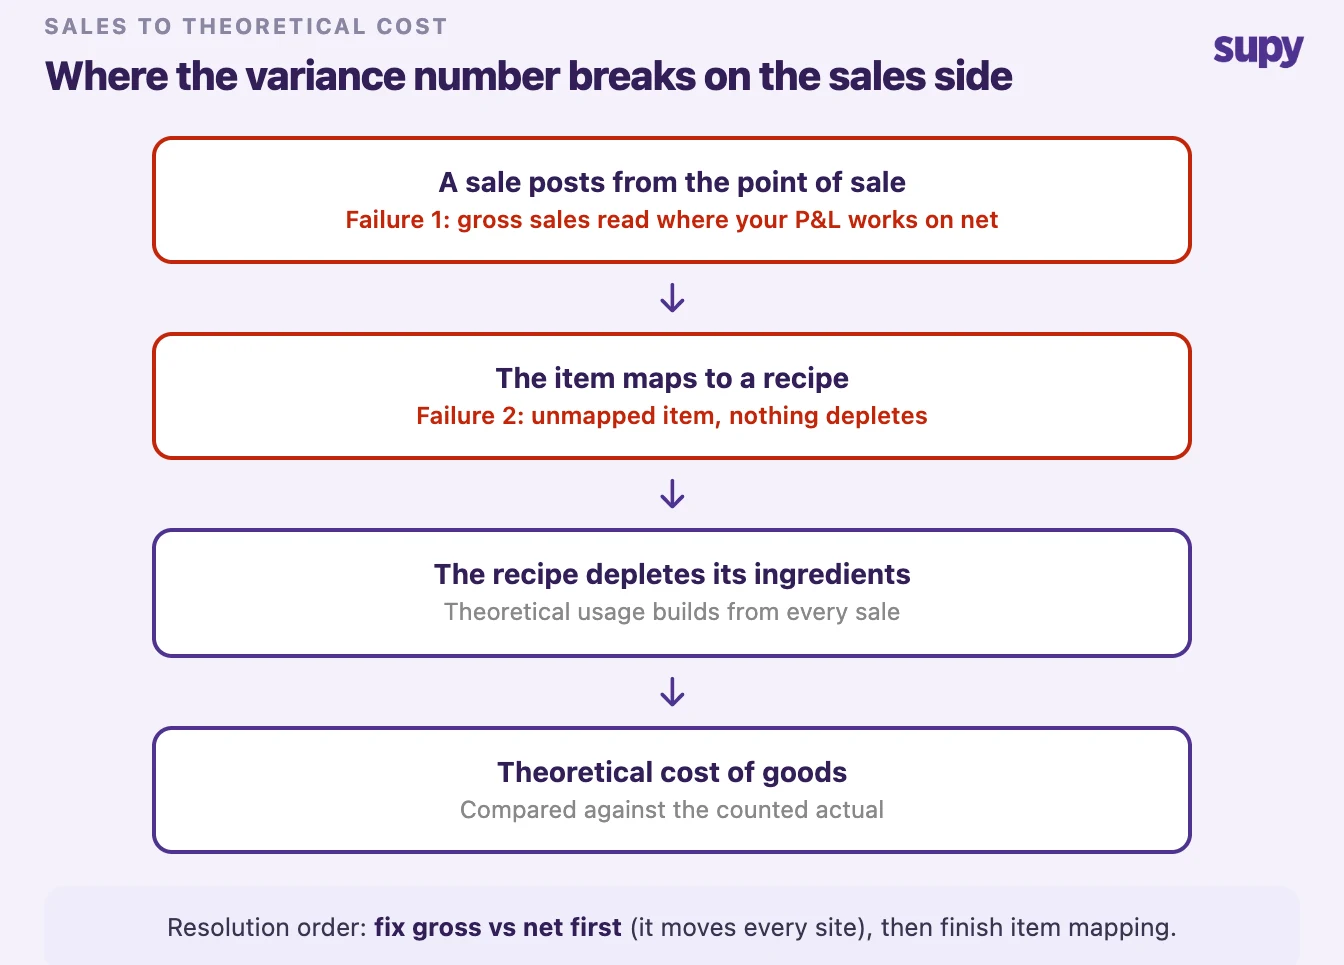
There are two failure points, and they have a fixed resolution order. First, the platform reads gross sales where your profit and loss works on net, which opens a gap at every store at once. Second, some point-of-sale items are not mapped to a recipe, so they sell without depleting anything and the theoretical usage understates reality. Fix the gross versus net setting first, because it moves every location; then finish item mapping to close the rest. One group that skipped this ended up cross-checking net sales across three systems by hand because it no longer trusted the automated number, which is a lot of effort to avoid changing one setting. When variance looks wrong everywhere, suspect the sales-to-inventory reconciliation before you re-count anything.
The branch test: is the variance configuration or execution?
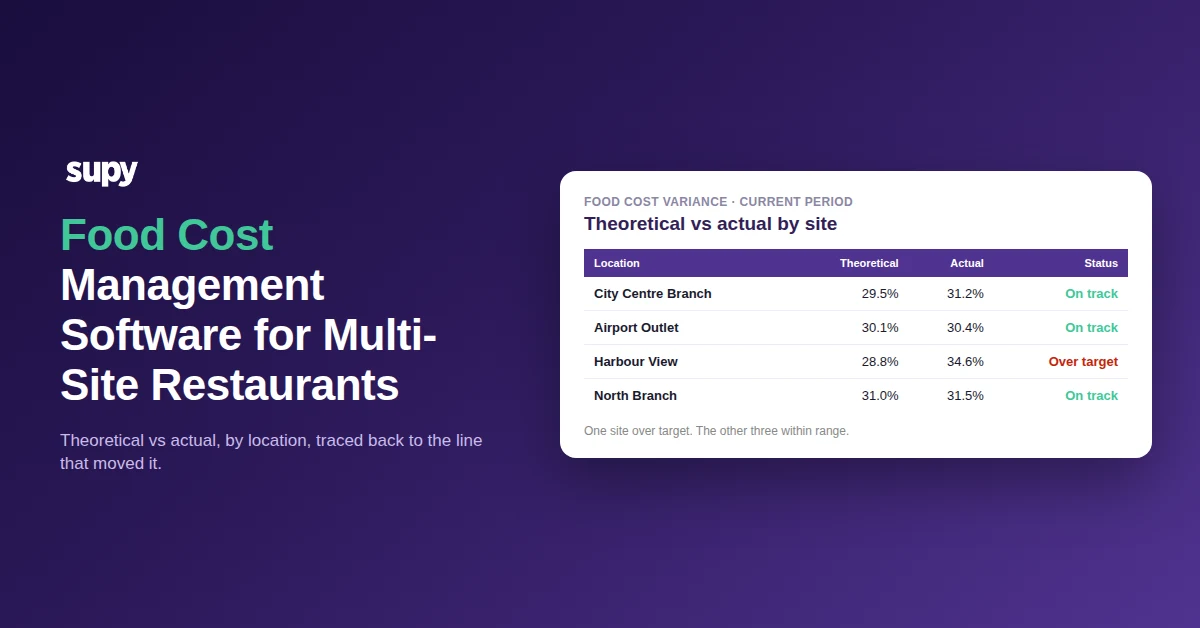
Once the sales side is trustworthy, a real variance still needs isolating, and multi-site groups have one shortcut single sites do not: compare branches. The same variance appearing at every location is almost never a receiving error or a portioning problem repeated identically in five kitchens. It is a shared configuration fault. A variance at one site, with the others clean, is local execution.
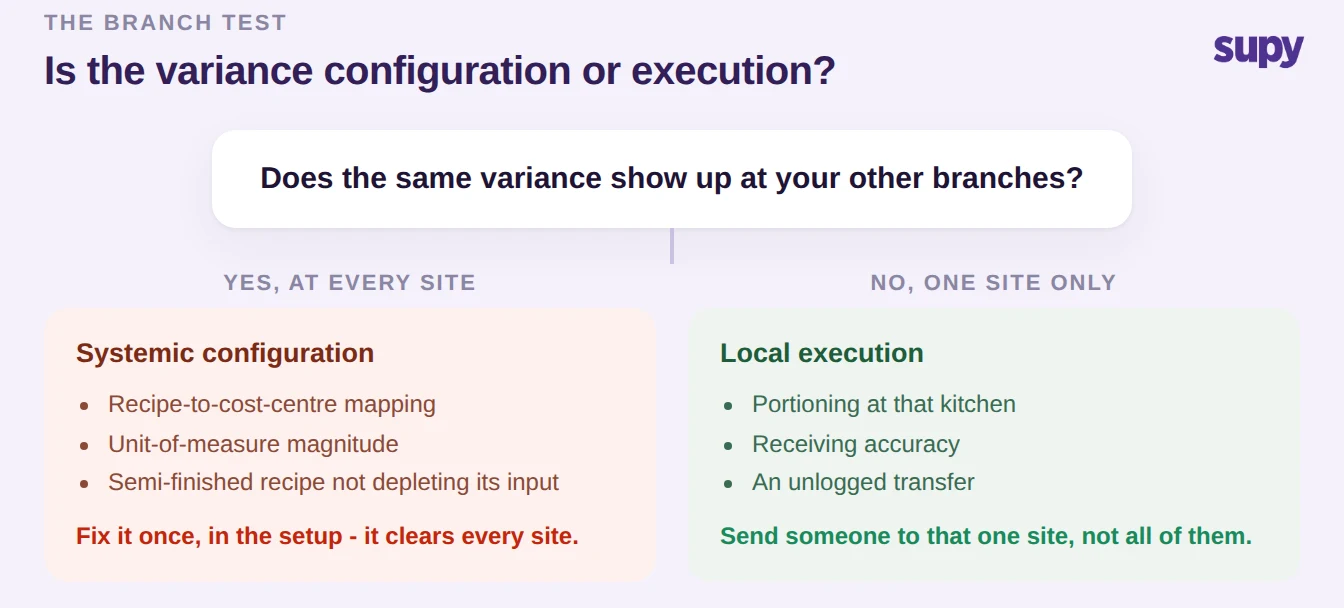
Run the branch test before you send anyone to investigate. If the gap is systemic, the answer is in the setup: recipe-to-cost-centre mapping, a unit-of-measure magnitude, or a semi-finished recipe that is not depleting its raw input. If it is local, it is portioning, receiving accuracy or an unlogged transfer at that one site. Sending an area manager to count a shelf when the fault is a global setting wastes the visit and leaves the variance in place at every other branch.
The recipe-costing settings that quietly break item margin
Some of the most expensive food cost errors are not operational at all. They are settings that look fine, report confidently, and are wrong by a known direction. Most of a group's item margin distortion can be found and fixed in a single afternoon audit, because each one is a named toggle with a predictable effect.
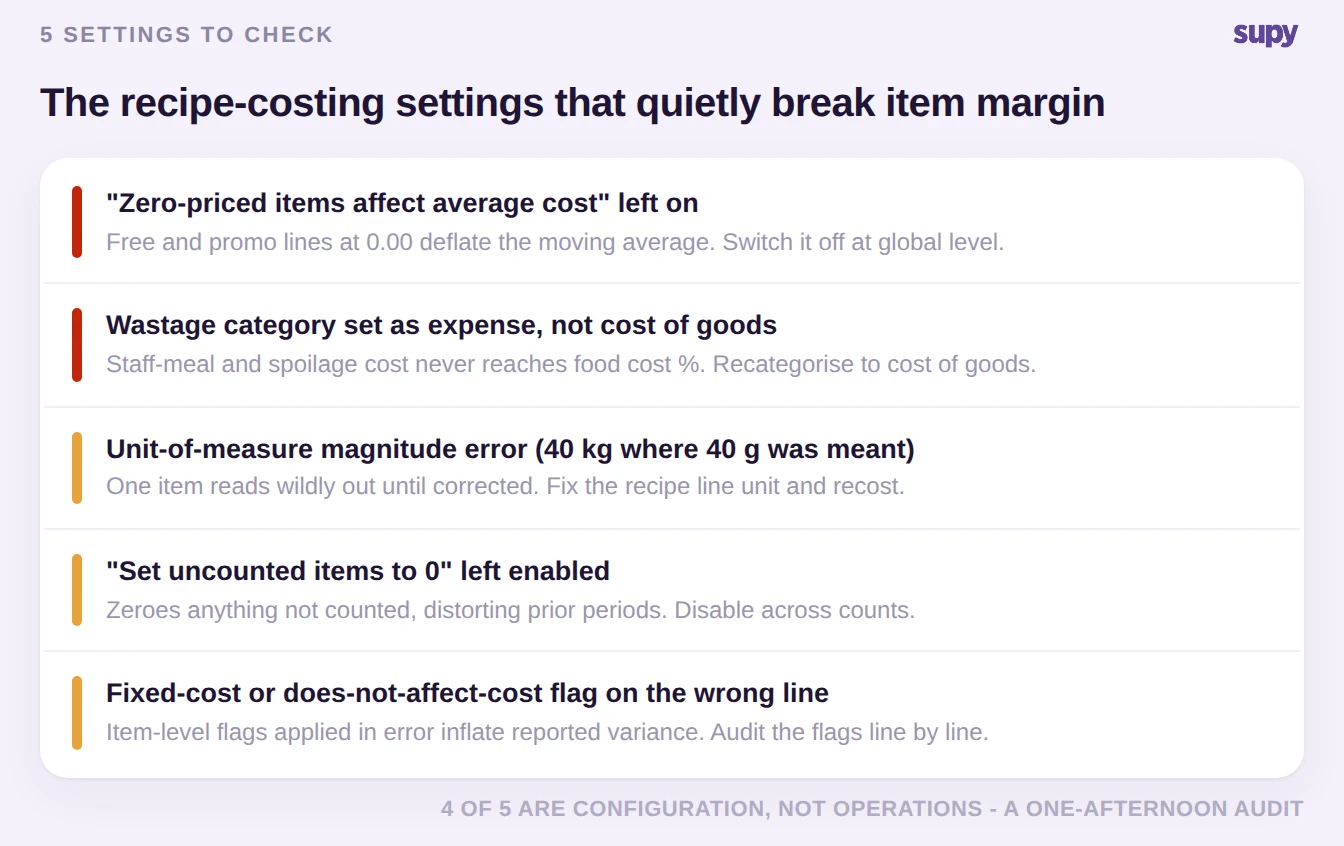
The recurring offenders: a "zero-priced items affect average cost" toggle left on, which lets promotional and free supplier lines logged at 0.00 deflate the moving average and overstate margin; a wastage category set as an expense rather than cost of goods, so staff-meal and spoilage cost never reaches the food cost figure; a unit-of-measure magnitude error at setup, such as entering an ingredient as 40 kg where 40 g was meant; a "set uncounted items to 0" option left enabled across prior counts; and item-level flags such as fixed cost or does-not-affect-cost applied to the wrong lines. None of these need new hardware. One group resourced the clean-up as a line-by-line recipe and item review at 3 to 4 hours a week until the settings were right. If you want to sanity-check the arithmetic on a single recipe by hand first, a food cost calculator is enough to expose a toggle that is deflating the number.
When the same recipe costs two different amounts at two sites
This one is misread constantly. A cost controller sees an identical recipe costing more at one branch than another and logs it as a data-integrity bug. In a per-location costing model it is usually expected behaviour. Ingredient cost inside a cost centre only moves when a goods receipt is booked into that centre or a transfer brings stock in. A centre that has received neither still carries the older price, and the gap self-corrects on the next delivery or transfer. In one case the entire difference was a single herb carried about a quarter higher at one site, resolved the moment stock next moved.
| Symptom | Likely cause | The check to run first | Typical fix |
|---|---|---|---|
| Same recipe, different cost per site | Per-location moving-average, no recent receipt or transfer | Last goods-receipt or transfer date per cost centre for that ingredient | None needed; self-corrects on next movement, or force a transfer |
| Variance at every branch at once | Gross-versus-net sales read, or unmapped items | Sales setting and recipe mapping, not the counts | Switch to net; map the items |
| One item wildly out | Unit-of-measure magnitude error | The item's recipe line unit against its purchase unit | Correct the unit and recost |
| Wastage cost missing entirely | Wastage category set as expense, not cost of goods | The category's accounting type | Recategorise to cost of goods |
| A fast-moving line stuck at an old cost | Item counted every period, blending rather than resetting cost | Whether that item appears in the count sheet | Stop counting it so it resets to the latest invoice price |
The last row is the least obvious and the most instructive. A group found a fast-moving dairy line permanently mispriced because staff kept counting it, which held old stock values alive in the moving average so each higher delivery blended in rather than replacing the cost. The fix was to stop counting that one item so it zeroed out and reset to the latest invoice price, issued as a written instruction to every venue. More counting is not always more accuracy.
From a supplier price change to a recalculated recipe cost
The reason price increases hurt is rarely the increase itself; it is the lag between the increase and the moment anyone recosts the recipes that use the ingredient. In a spreadsheet world that lag is weeks: the price is found at month-end, reconciled from invoice photos, and only then pushed through the recipes by hand, by which point the margin has already been sold away.
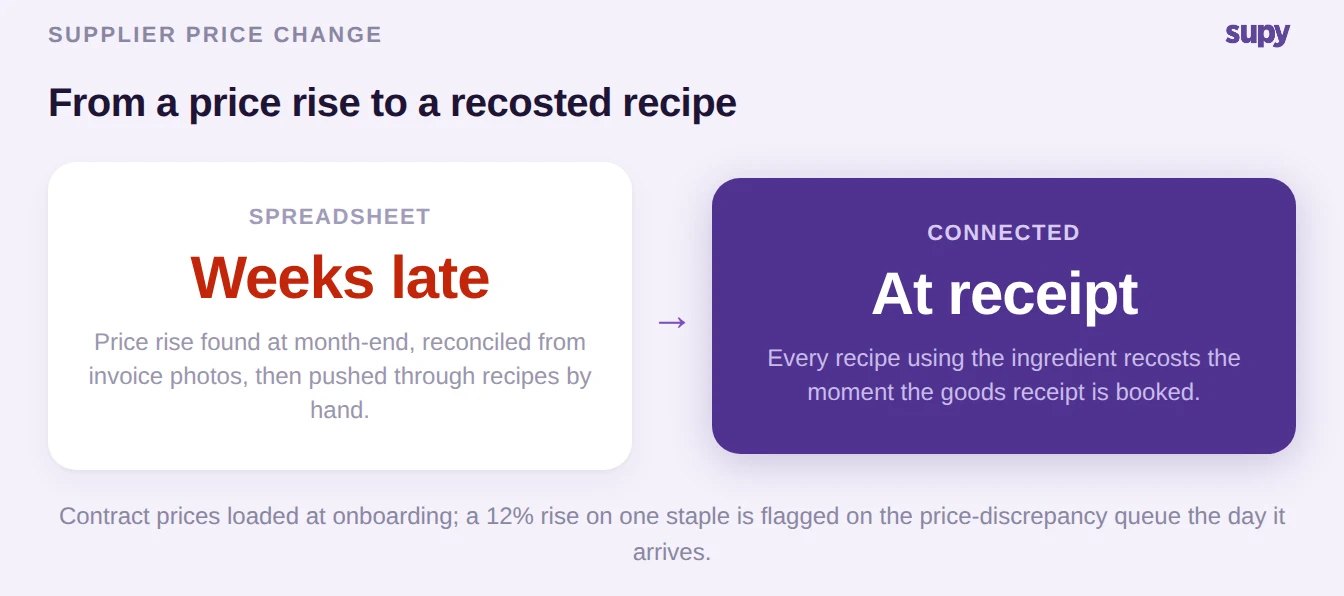
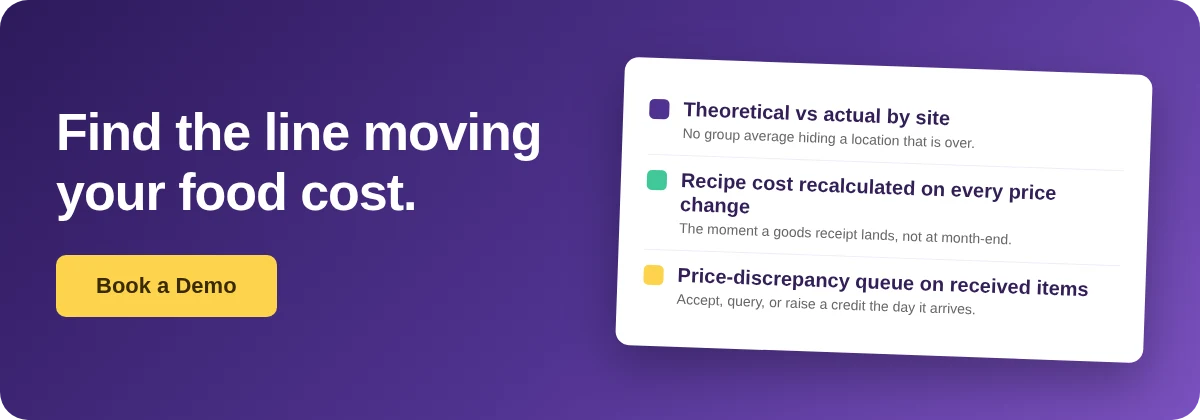
Connected food cost management software collapses that lag to zero. Contract prices are loaded at onboarding, so an incoming invoice line that deviates is flagged at receipt on a price-discrepancy queue, and the moment a goods receipt is booked, every recipe using that ingredient recalculates against the new cost. A 12% rise on one staple stops being a month-end surprise and becomes a line you either accept, query with the supplier, or raise a credit against, the same day it arrives. This is also the layer that makes per-location costing trustworthy, because the cost feeding each recipe is that branch's own received price, not a group average that hides the outliers. For the wider stock picture behind those numbers, this sits alongside a group's restaurant analytics view of variance and wastage by site.
Before you buy, put it to the test. Food cost management software earns its place when it can trace a number back to the line that moved it, not just display the number. If you are evaluating options for a multi-site group, run these three checks in a demo, using your own worst variance as the test case. First, ask to see theoretical versus actual food cost by site, not just a group average that lets a bad location hide inside a healthy blend. Second, change a supplier price and watch whether every recipe using that ingredient recosts immediately, and whether the increase surfaces on a discrepancy queue at receipt. Third, open the received-items view and confirm you can act on a flagged price on the spot: accept it, query it, or raise a credit. If a tool can do those three, it can find the food cost problems in this article. If it only draws the percentage, you are back to a prettier spreadsheet.