
Food Yield Calculator: The Formula and a Worked Kitchen Example
The food yield formula, step by step
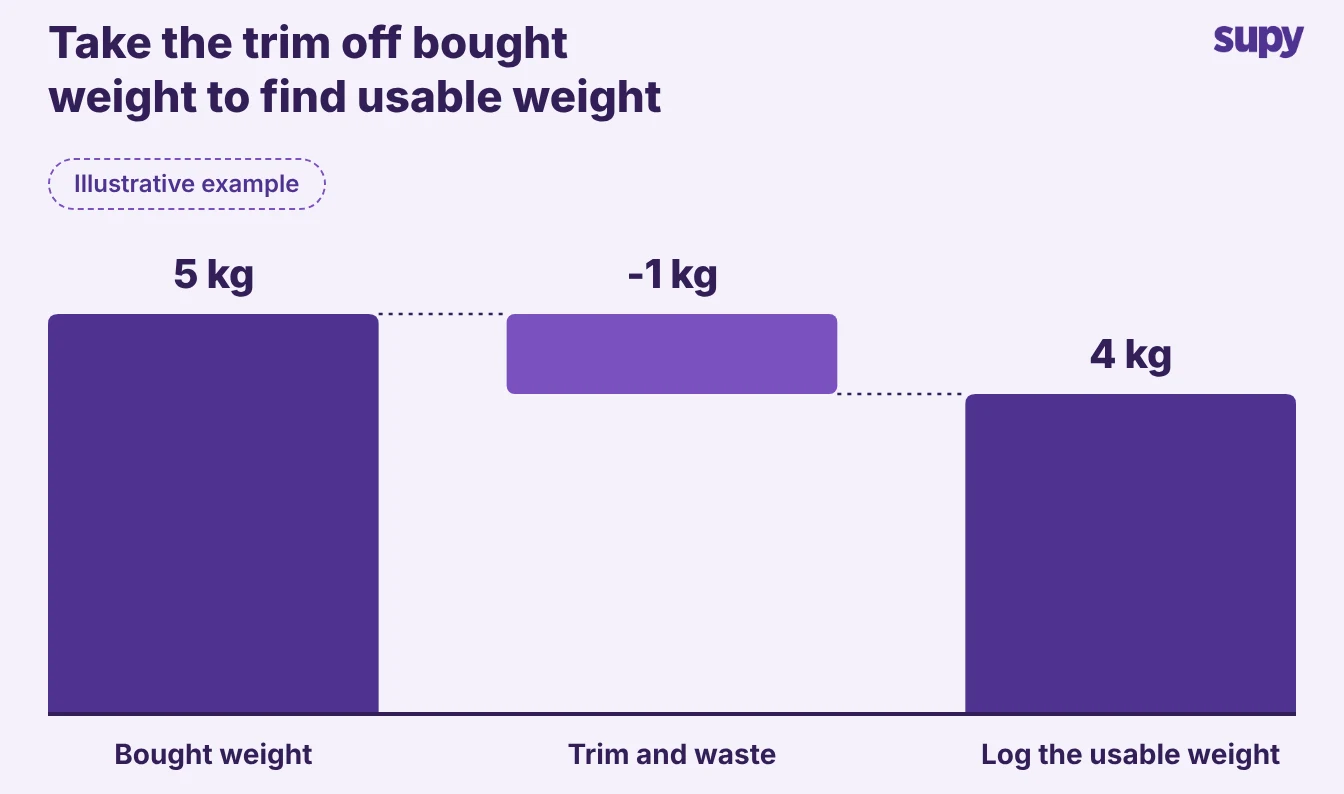
Food yield is the share of what you buy that ends up on the plate: usable weight divided by bought weight, times 100. A 5 kg striploin that trims to 4 kg yields 80%, so a food yield calculator is really just this formula over three weights. This article gives the formula, a worked table, the cost per usable kilo, and why a yield you set once rarely matches the real one.
There is no interactive widget here, on purpose. A yield calculator for food is three numbers and one line of arithmetic, so work it in three steps:
- Weigh what you buy. Record the bought weight of the raw item before anyone touches it: the 5 kg striploin, the sack of onions, the case of whole fish.
- Weigh what is usable. After trimming, peeling or filleting, weigh what is left to cook with. The fat, skin, bone and off-cuts you throw away are the loss.
- Divide and multiply. Usable weight divided by bought weight, times 100, is your yield percentage. 4 kg is 80% of 5 kg, so the striploin yields 80%.
The most expensive ingredients lose the most to this gap. The Spread 2026 found the costliest items on a menu are also the most wasted. That is why yield matters most on a prime cut and barely at all on a bag of rice.
A worked yield table for one cut of meat
Run the three steps on one cut and the numbers line up into a table any chef can copy for the next item. Here is the full working for the 5 kg striploin, from bought weight to cost per usable kilo.
| Yield line | Worked figure |
|---|---|
| Bought weight | 5 kg |
| Price paid | $30/kg |
| Total cost | $150 |
| Trim and waste removed | 1 kg |
| Usable weight | 4 kg |
| Yield | 80% |
| Cost per usable kilo | $37.50 |
Copy the left column for any ingredient and fill the right one from your own invoice and scale. The two lines that matter most sit at the bottom. Yield tells you how much you keep, and cost per usable kilo tells you what that kept weight really costs.
Cost per usable kilo: what the dish really costs
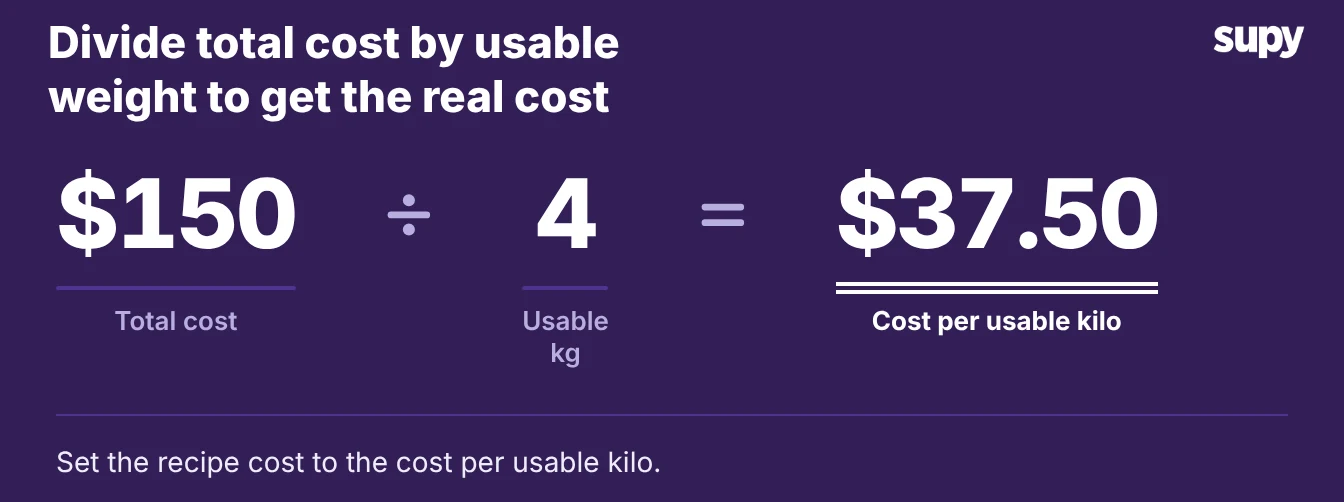
Cost per usable kilo is the number that belongs in your recipe, not the price on the invoice. You paid $30 a kilo for the striploin, but after trimming you have 4 kg left to plate, so each usable kilo cost $37.50. Cost the dish on $30 and every plate looks cheaper than it is.
- The plate gap. You see the difference on a single portion. A 200 g steak portion costs $7.50 at the real $37.50 per usable kilo, but only $6.00 costed on the $30 bought price. That is $1.50 missing from every plate before any waste in the kitchen. Multiply $1.50 across a weekend of covers and the dish that looked like it hit target was losing money the whole time. Cost per usable kilo is also what feeds an honest food cost percentage, so the two numbers move together.
- Fix at source. A recipe built on usable weight fixes this at the source. Supy's recipes and prep recipes carry each ingredient's yield and prep wastage, so the dish cost is built on the weight you can plate rather than the weight you bought.
Why one costed yield rarely matches the real one
A single fixed yield is a useful starting point and a poor long-term truth. Yield moves with the supplier, the cut, the season and the person holding the knife, so the figure you costed last quarter is rarely the figure you get this Tuesday.
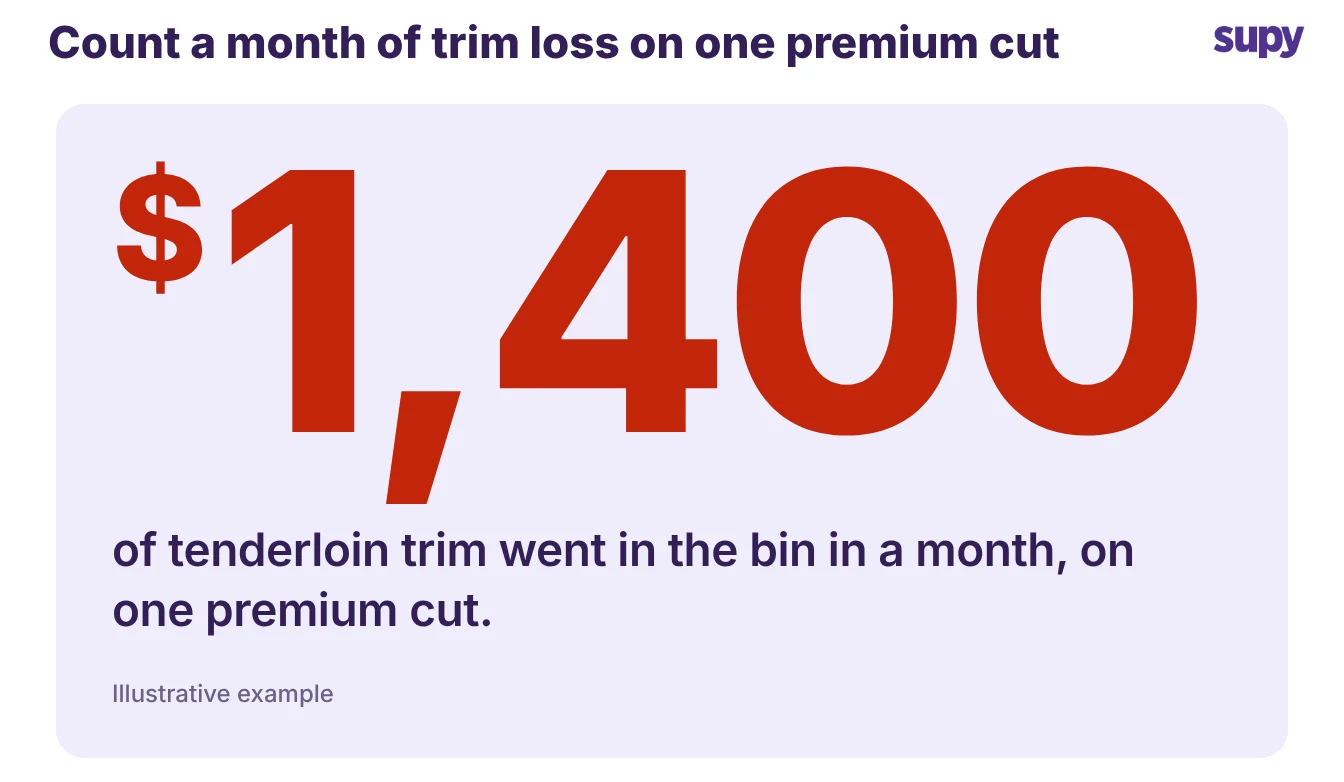
- Costly cuts. It gets expensive fast on the cuts that cost the most. A kitchen buying premium beef at about $80 a kilo found roughly $1,400 a month of tenderloin trim going in the bin. That was enough to drag its flagship burger well past its food cost target. The yield on paper was fine; the yield on the board was not.
- Prep swings. Prep loss swings the same way. A bakery group's vegetable trim could roughly double from one day to the next, so one average figure never matched the batch in front of the cook.
Checking yields against what the kitchen gets
Yields move with every delivery and every cook, so the fix is to check your costed yield against what the kitchen actually produces on a schedule, not once a year.
One cloud kitchen costed beef at a fixed 85% while the real daily yield moved between 83% and 86%. The gap looked small. But over a month it built up to about 17 kg of variance on one cut that nobody could explain, because the recipe insisted the yield never changed.
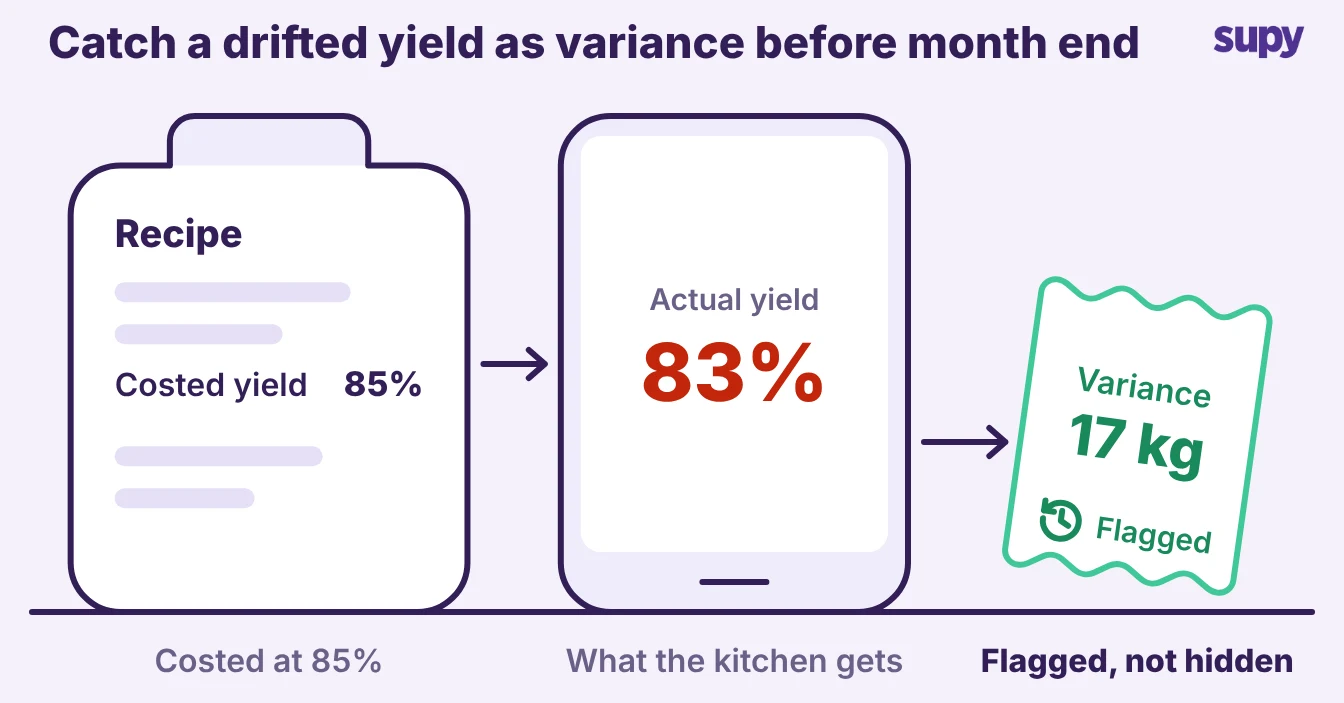
Supy runs this comparison for you:
- Theoretical against actual. It tracks theoretical usage from your recipes against actual stock movement. You catch a cut running below its costed yield as variance, not at month end.
- A target cost alert. Set a target cost on the recipe and Supy flags the dish the moment its cost runs over the threshold, which is usually the first sign a yield has changed.
- Batch yield on record. Batch production tracking records the real yield on each prep run, so the recipe figure becomes the average of what the team actually gets.
Start with one cut this week. Weigh it in, weigh the usable part out, run the formula, and put the cost per usable kilo into the recipe. Then set a standing rule for the kitchen:
- Watch the gap. Flag any cut whose real yield runs more than 2 percentage points below the yield you costed.
- Recost the dish. Rebuild the recipe cost on the new usable weight so the plate price reflects reality.
- Check the price. Ask whether the supplier price or the cut has changed before you accept the lower yield.
That one habit turns yield from a number you guessed once into the number your margin depends on.