.jpg)


Stale Prep-Wastage Percentages: Why Inventory Variance Creeps Up When Recipe Yields Are Not Retested
Your inventory variance has been drifting the wrong way for weeks. Nothing obvious changed: the same suppliers, the same recipes, the same counts. But theoretical usage and actual usage keep pulling apart, and every review ends with the same shrug and a vague note about waste. Before you go hunting for theft or a receiving problem, check the least visible number in the whole system: the prep-wastage percentage sitting inside your recipes. It was almost certainly set once, during onboarding, and never touched again.
That single number decides what your platform thinks you should have used. When it stops matching reality, your variance does not spike in a way anyone notices. It creeps, item by item, until a quarterly review turns up a gap nobody can trace to a cause.
What a Prep-Wastage Percentage Actually Controls in Your Counts
A prep-wastage percentage is the share of a raw ingredient lost when it is cleaned, trimmed, portioned, or cooked before it reaches a dish. If an acai pulp recipe carries a 10% prep-wastage figure, the system assumes 10% is lost in prep and only 90% becomes usable output. That one percentage feeds every theoretical usage number the platform calculates for that ingredient.
Think of it as the bridge between what you buy and what your recipes say you should use. When the percentage is right, theoretical usage tracks what actually leaves the shelf. When it is stale, every downstream figure inherits the error quietly, because nothing in the report flags a percentage as old. It just keeps doing the maths it was told to do.

Why Your Real Yields Move but the System Percentage Stays Frozen
Yields are not fixed properties of an ingredient. They move with supplier grade, seasonality, the person doing the prep, and the equipment in front of them. The number you entered at onboarding was accurate the day you measured it and has been slowly going wrong ever since.
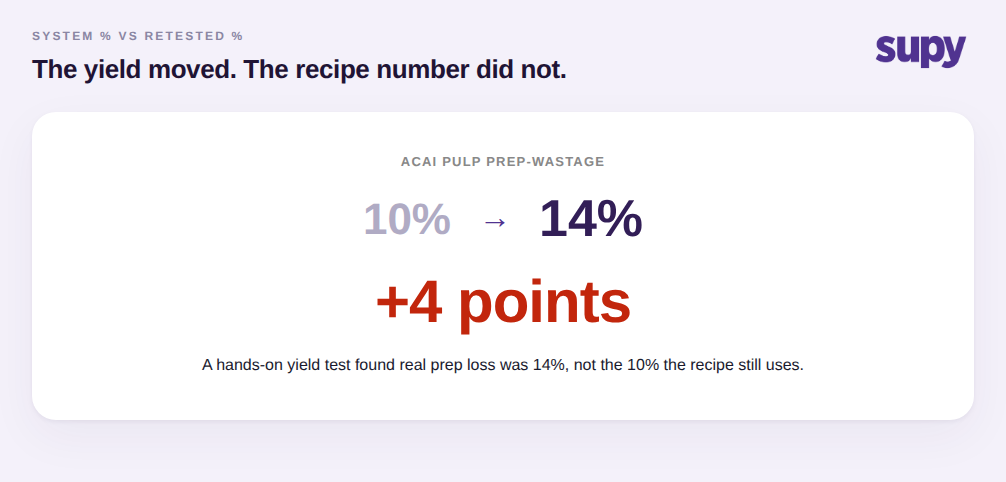
Here is the pattern that shows up again and again. A prep or central kitchen lead retests an acai pulp yield by hand, weighing what goes in against what comes out, and finds the real prep loss is closer to 14%, not the 10% the recipe was built on. That is a 4-point gap on a single item. The retest gets discussed, maybe written on a whiteboard, and then never entered into the system. The recipe still says 10%. From that day the platform is calculating theoretical usage against a number the operator already knows is wrong.
The same thing happens whenever recipe-defined yields differ from real production output. A recipe says one kilogram of trimmed protein yields ten portions; the line actually gets nine on a bad batch. Unless someone records the actual yield at the point of production, the recipe stays pinned to a spec that was never validated against a real service.
How One Stale Percentage Quietly Inflates Variance Across Every Location
A single wrong percentage would be a rounding error if it stayed in one place. It does not. Recipe figures are applied automatically across stock counts, wastage recording, production, and transfers, so theoretical usage everywhere is built on the same recipe number without anyone re-triggering a calculation. One stale percentage is therefore not a local mistake. It repeats on every count, every production run, and every branch that uses that recipe.
That is why the damage looks like this by the end of a single week in one location:
Every prep item is running over its theoretical usage
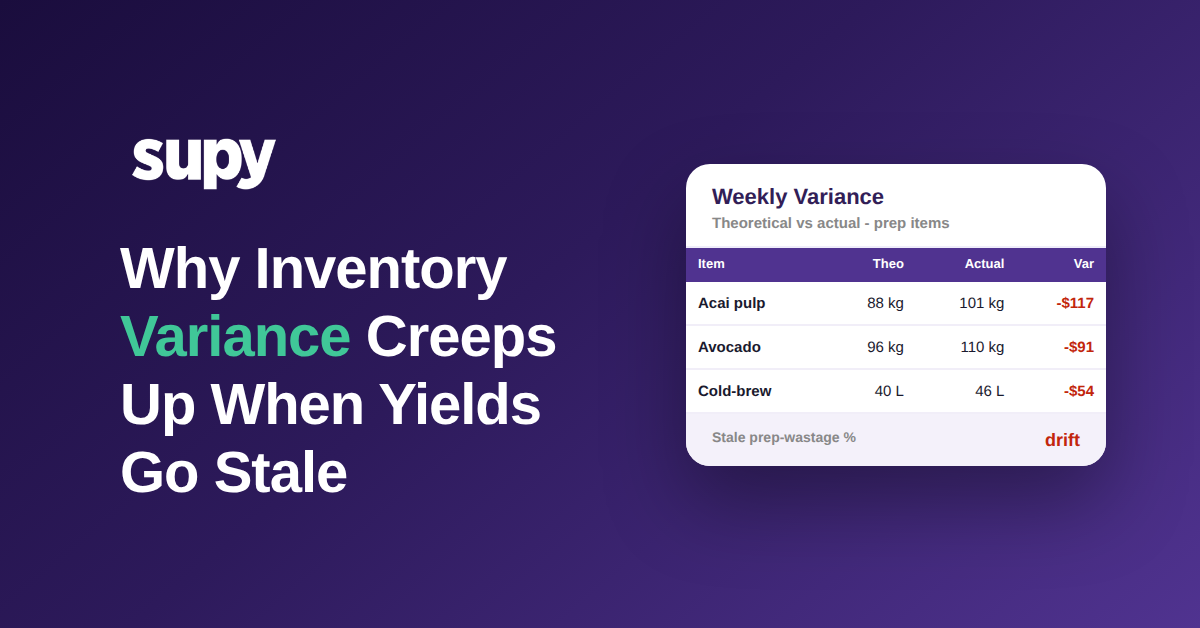
| Item | Theoretical | Actual | Variance |
|---|---|---|---|
| Acai pulp | 88 kg | 101 kg | -13 kg / -$117 |
| Avocado | 96 kg | 110 kg | -14 kg / -$91 |
| Cold-brew concentrate | 40 L | 46 L | -6 L / -$54 |
| Chicken, prepped | 64 kg | 69 kg | -5 kg / -$41 |
| Total unexplained variance | -$303 |
Every one of those items is understating theoretical usage because the prep-wastage percentage is too low, so actual depletion runs ahead of what the system predicted and the variance lands negative. On its own each line looks like noise. Together they add up to roughly $303 of unexplained variance in a single week, on four prep-heavy items, in one location. Multiply that across a multi-site group and the small percentage is now a recurring monthly leak that no amount of tighter counting will close, because the counts are not the problem. The baseline is.
Separating Yield Drift from Theft, Over-Portioning, and Receiving Errors
Stale yields survive for months because they hide inside a variance number that always has three or four plausible explanations. When operators finally break a large ingredient variance down by item and cause, the picture is usually mixed rather than a single villain.

Variance investigations consistently trace back to three recurring root causes: stale prep-wastage percentages that were never updated after real yield testing, operational waste that never got recorded, and receiving or goods-received-note entry errors. Over-portioning at the line sits alongside them. The practical move is to stop treating variance as one number and attribute it by item and by cause, the same way a beverage lead breaks high variance down by category to tell theft apart from over-pouring. Once you can see that a large share of the gap is yield drift rather than shrinkage, you know the fix is a recipe change, not a security camera.
Retesting Yields and Re-Baselining the Percentage
This is the part that is genuinely in your control, and it is a recipe workflow, not a counting one. The fix runs in a fixed order:
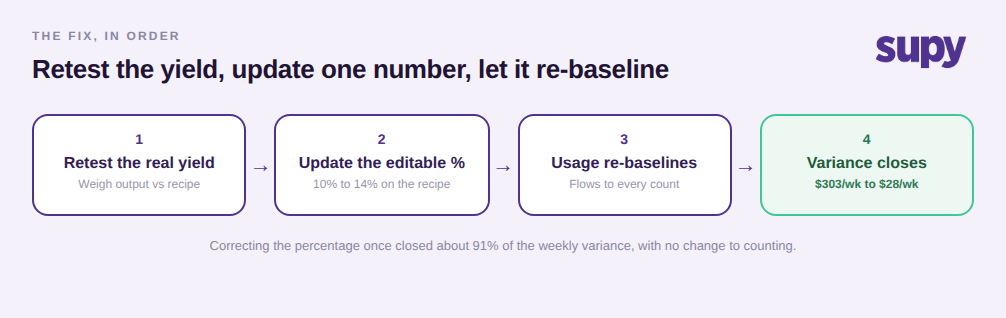
First, pick the items driving the variance: the high-value, prep-heavy ingredients where a few points of yield error turn into real money. Second, run a real yield test and record the actual quantity produced at the point of production, not just the theoretical spec, so you are comparing measured output against the recipe. Third, update the editable prep-wastage or yield percentage on the recipe itself. Supy exposes editable yield percentages per recipe on the recipe and prep costing view, with waste calculated automatically from what you enter, so the correction is a direct edit rather than a workaround. Fourth, let theoretical usage re-baseline on its own; because recipe figures propagate automatically, correcting the percentage once flows through every future count, production run, and transfer that uses it.
One guardrail to expect: Supy blocks edits to recipes that have already been used in production, which protects your historical cost data from being rewritten after the fact. That means you re-baseline going forward from the correction, not retroactively, which is exactly what you want for a clean audit trail. On the sample above, moving the four items to their retested percentages took the weekly variance from about $303 down to $28, closing roughly 91% of it, without a single change to how the team counts.
Is This Happening in Your Operation
You do not need a project to find out. Run a quick self-diagnostic. First, pull your five highest-value prep or semi-finished recipes and check when each prep-wastage percentage was last changed; if the answer is at onboarding, treat that as a red flag. Second, hand-test the yield on the single worst variance item this week and compare it to the recipe figure. Third, if the gap is more than two or three points, you have found at least part of your creeping variance. The first move is not a bigger count or a tighter lock on the walk-in. It is retesting the yields you have been trusting on faith and updating the one number that quietly drives every theoretical figure you report on.

If you want the wider context on how these gaps compound, the pillar on restaurant inventory variance analysis walks through the full set of causes, and the recipe and prep costing capability is where the yield and prep-wastage percentages above actually live.