.jpg)


Restaurant Inventory Variance Analysis: How a Single Gap Number Hides Four Separate Problems
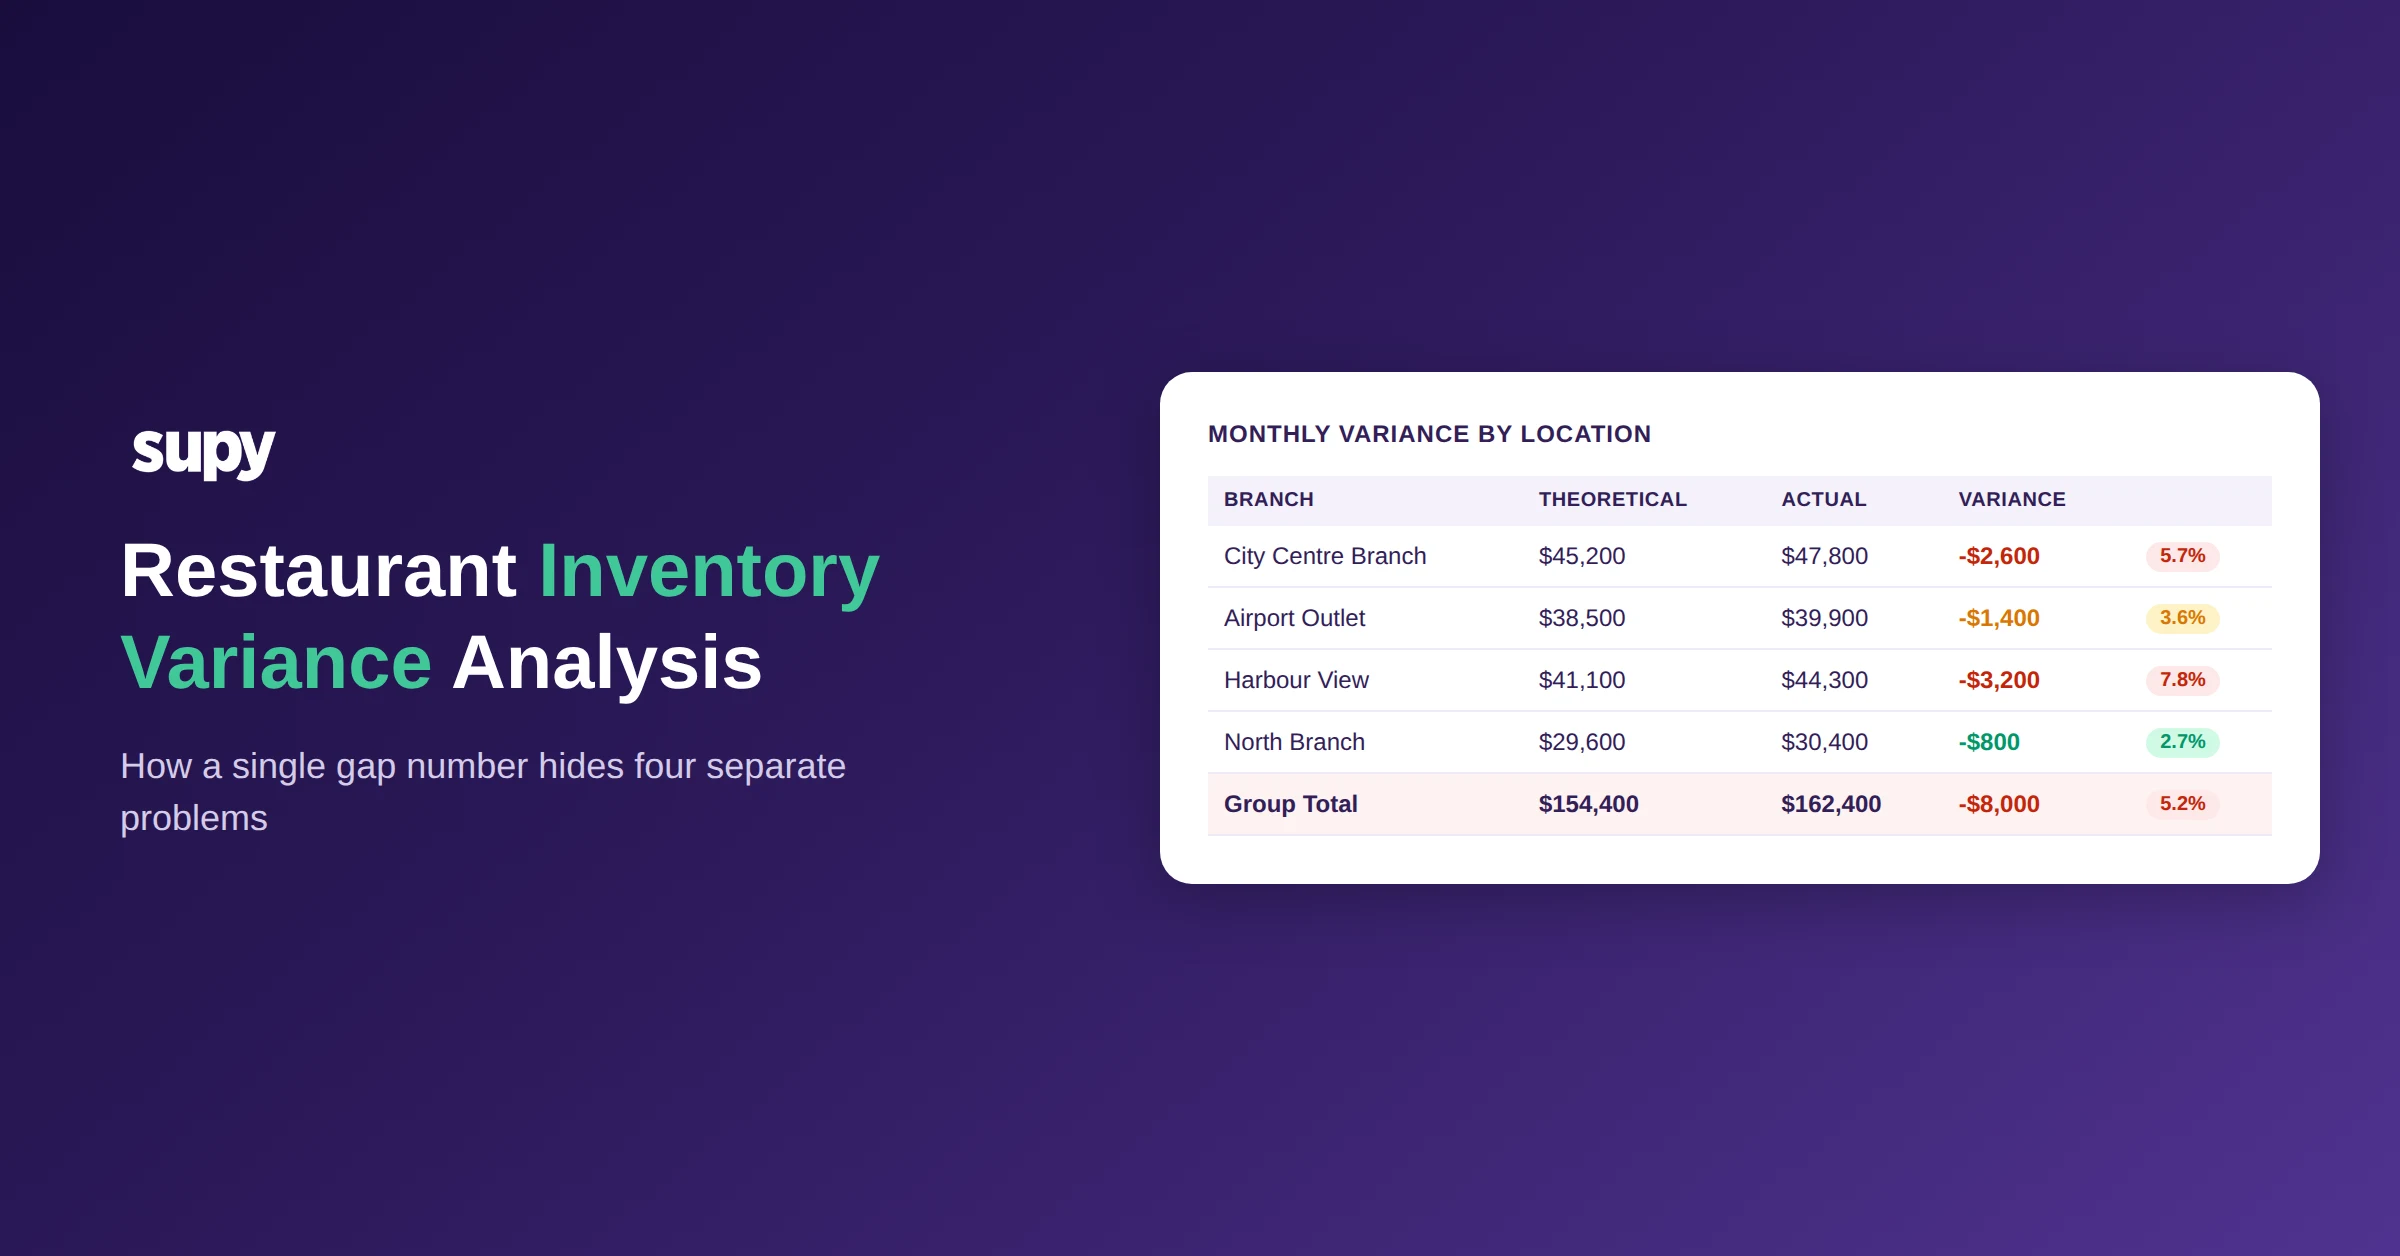
A 4-location restaurant group's operations manager got a shock at month-end. Actual food costs were running 5.2% above theoretical - a $8,000 gap across the group for the month. The number was clear. What wasn't clear was where it came from, which location was driving it, or whether it was one incident or a slow compounding failure across all four sites.
With no system linking sales data to stock consumption in real time, the investigation started from scratch. Every manager was called in. Spreadsheets were pulled. Three weeks of stock movement data was manually reconstructed. In the end, the team couldn't determine the root cause with confidence. The $8,000 was written off as "operational variance".
That pattern - a visible gap, an invisible cause - is the central problem with inventory variance analysis in multi-location restaurant operations. The number arrives. The explanation doesn't.
This guide breaks down the four distinct causes that drive inventory variance, why they're routinely confused for a single problem, and what it takes to separate them reliably. For a broader look at inventory control fundamentals, see our restaurant inventory management guide.
Why Month-End Reconciliation Is Too Late to Catch Variance Losses
Most restaurant groups running manual inventory processes review variance once a month. The count goes in, the theoretical consumption is calculated, the gap is reported. By the time the figure lands, the losses driving it happened weeks ago.
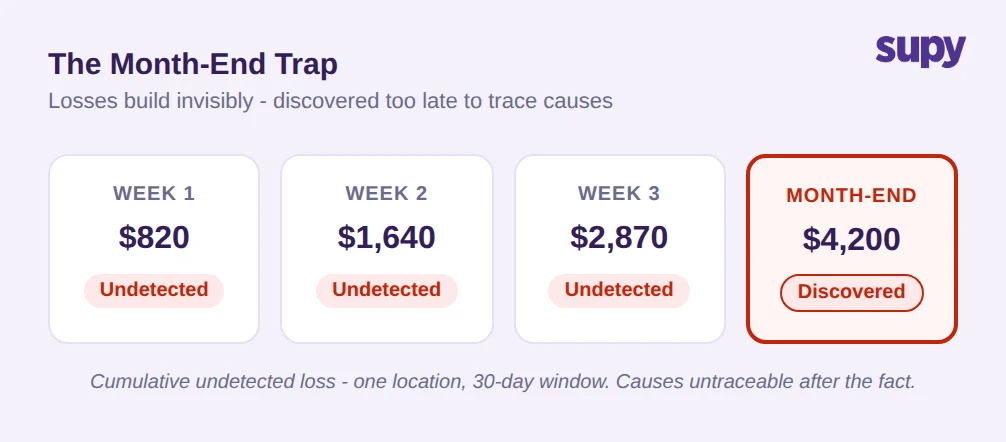
For a 4-location group, this timing problem has a compounding effect. If one location runs 7.8% above theoretical for a full month, and the variance is only visible at close, the causes are already cold. Was the gap in week one and stabilised? Did it build progressively? Was it a single incident or consistent drift? A month-end-only system cannot answer these questions.
A multi-location QSR chain on manual spreadsheets reported 4 to 6% food cost variance monthly, with managers spending hours reconciling records with no reliable audit trail. The variance was real. The causes remained uncertain.
The practical consequence is that month-end reconciliation produces variance figures that are accurate in aggregate but analytically useless for correction. When an operations director sees a group variance of 5.2% across four sites, the question is not "is this bad?" - it is "which site, which product category, and which week?"
Before moving to an investigation workflow, ask: if your team discovers a variance gap today, how far back can you trace it - and will the operational evidence still be there?
The Three Causes That Look Identical Without Recipe-Linked Tracking: Portioning, Waste, and Theft
A stock gap has three primary operational causes - portioning inconsistency, untracked waste, and theft - and one data cause: system errors (covered in the next section). Without recipe-linked consumption tracking, all three show up identically in the inventory variance report as "actual higher than theoretical".
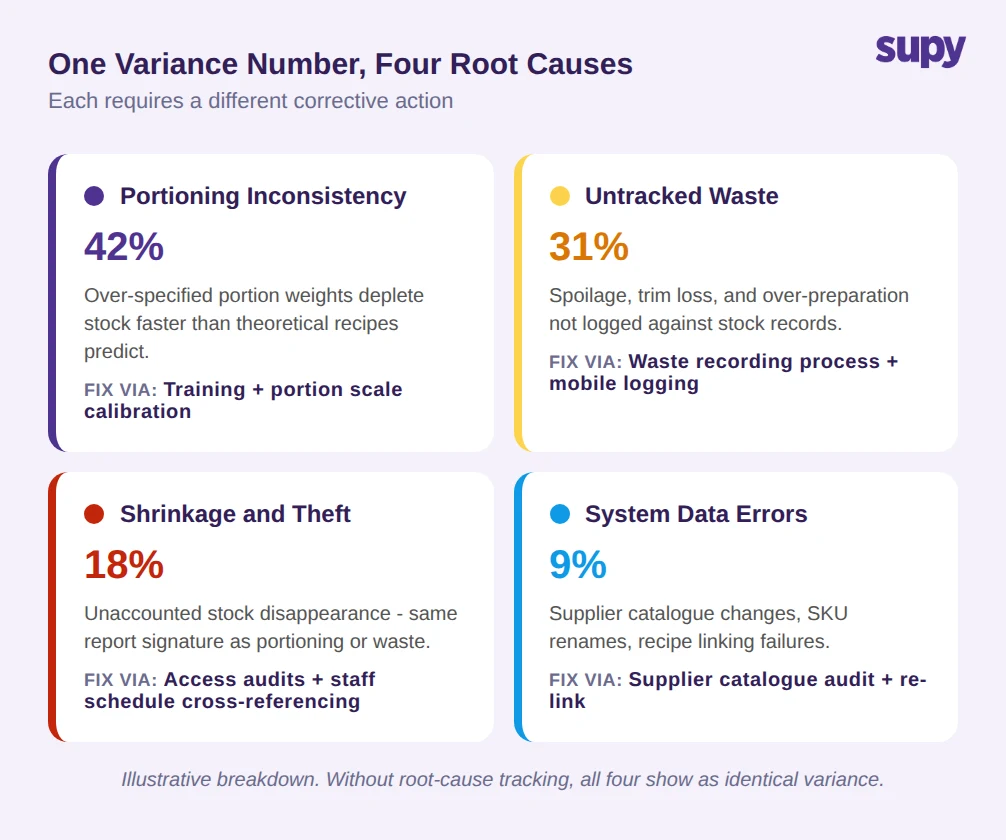
Portioning inconsistency occurs when kitchen staff serve above the recipe-specified portion weight. A recipe that calls for 180g of protein but consistently goes out at 200g generates a 10% ingredient overconsumption per serve. At scale across 200 covers per day, this accumulates quickly - and it does not indicate theft or negligence, it indicates a training or equipment calibration issue.
Untracked waste occurs when spoilage, over-preparation, or trim loss is not logged. Many operations have a formal waste recording process on paper, but paper logs are inconsistently used and rarely cross-referenced against inventory counts. The stock consumed by waste disappears from the theoretical-vs-actual calculation without a recorded cause.
Theft and shrinkage produce the same signature in the variance report as the other two. The difference is operational, not numerical. Portioning errors fix with training. Waste reduces with process discipline. Theft requires a different response entirely - access audits, staff schedule cross-referencing, camera review.
A multi-location group with no recipe-linked tracking sees a single inventory variance number and is forced to guess which of these three causes - or what combination - is behind it. The right correction requires knowing the cause. Guessing produces corrective actions that target the wrong problem.
Ask yourself: does your variance report tell you which of these is driving the gap - or just how large the gap is?
When a Supplier Changes an Item Name and Your Costing Records Show a Phantom Loss
A 4-location restaurant group's operations manager identified a variance spike that didn't match any operational change. Stock levels looked reasonable. No new supplier. No staffing change. The gap appeared to come from a high-volume protein item.
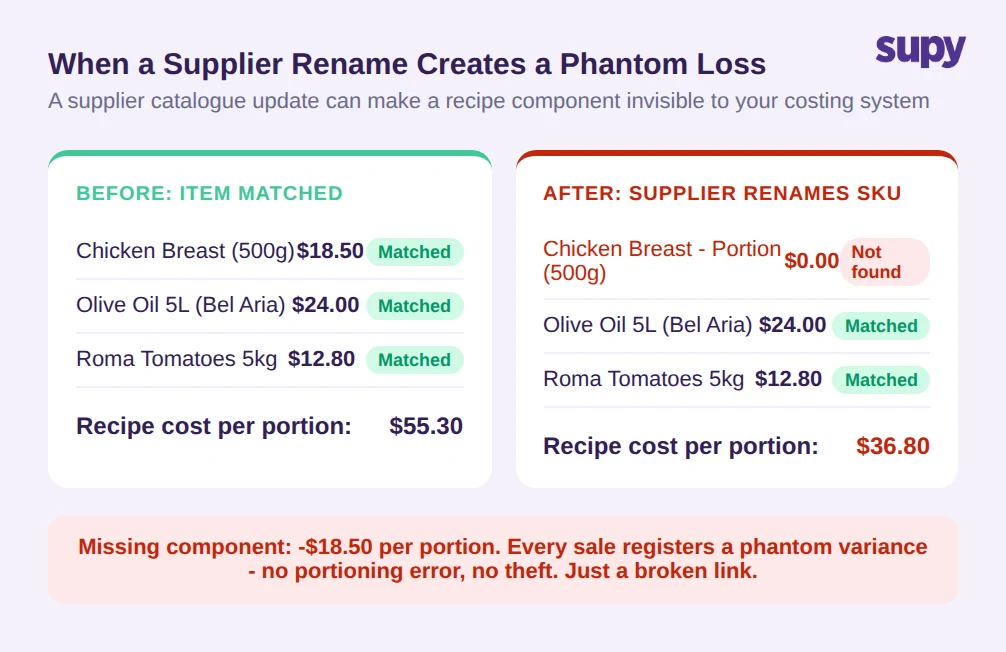
The actual cause was a supplier catalogue update. The item had been renamed - "Chicken Breast (500g)" became "Chicken Breast - Portion (500g)" in the supplier's system. Because the recipe was linked to the original item name, the renamed version failed to match. Sales continued depleting the recipe component at the theoretical rate. Receiving continued logging stock against the new SKU name. The two records never reconciled. A $18.50-per-portion discrepancy compounded for three weeks before it was caught.
This is a system data integrity failure masquerading as an operational variance. It does not appear in portioning logs. It does not appear in waste records. It shows up as a gap in theoretical-vs-actual consumption that points to a product that appears physically present in the stockroom.
Multi-location operations are more exposed to this failure because purchasing is often centralised while receiving is location-level. If a supplier sends a revised catalogue and the central purchasing team updates item names, but some branches have not had their recipe links updated, the variance appears selectively - one location shows the gap, others do not. Without per-site drill-down data, a group average variance number would not surface this pattern at all.
If your system does not alert you when a supplier renames or replaces a linked item, how would you know which variance is real versus a data integrity error?
Why Multi-Location Variance Needs Per-Site Visibility, Not Group Averages
Consider a group of four locations running a combined variance of 5.2% against theoretical food cost - $8,000 across a month of operations. That figure sits above the threshold that signals a systemic problem. But the group average conceals what is actually happening at site level.
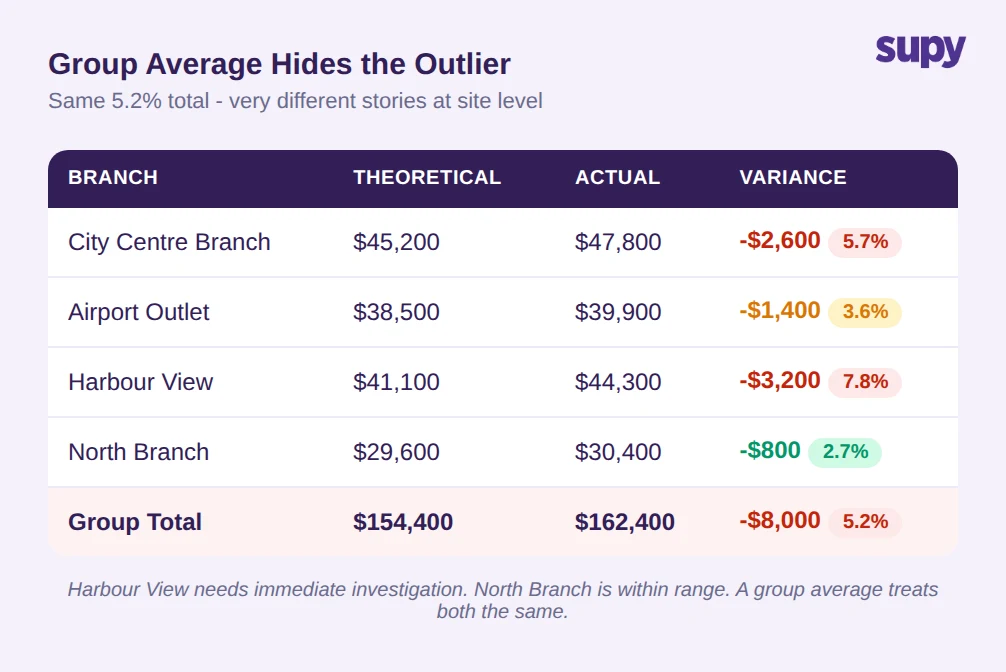
Harbour View is running at nearly three times the variance of North Branch. The causes are almost certainly different. North Branch at 2.7% is within acceptable range. Harbour View at 7.8% requires immediate investigation - but a group average of 5.2% does not tell you that.
Multi-location operators on manual reconciliation processes typically aggregate variance to a group level because building per-location variance reports from spreadsheets is labour-intensive. The group number is reviewed. The outlier site is invisible.
This is compounded at the product-category level. Even with per-location reports, a location's aggregate variance does not reveal whether the gap is concentrated in one high-cost protein item or distributed across the entire menu. Drill-down to item level is what makes variance investigations actionable rather than directional.
When reviewing group variance, ask: which location is driving this - and is the cause consistent across sites, or is one site an outlier that needs different attention?
What Acceptable Inventory Variance Looks Like - and When 5% Signals a Systemic Problem
Well-run multi-location restaurant groups keep food cost variance under 2% of theoretical. Between 2% and 5%, the variance warrants regular investigation to identify whether it is structural - a recipe cost assumption is wrong - or operational - a recurring portioning or waste issue. Above 5% typically signals a systemic problem requiring immediate action.
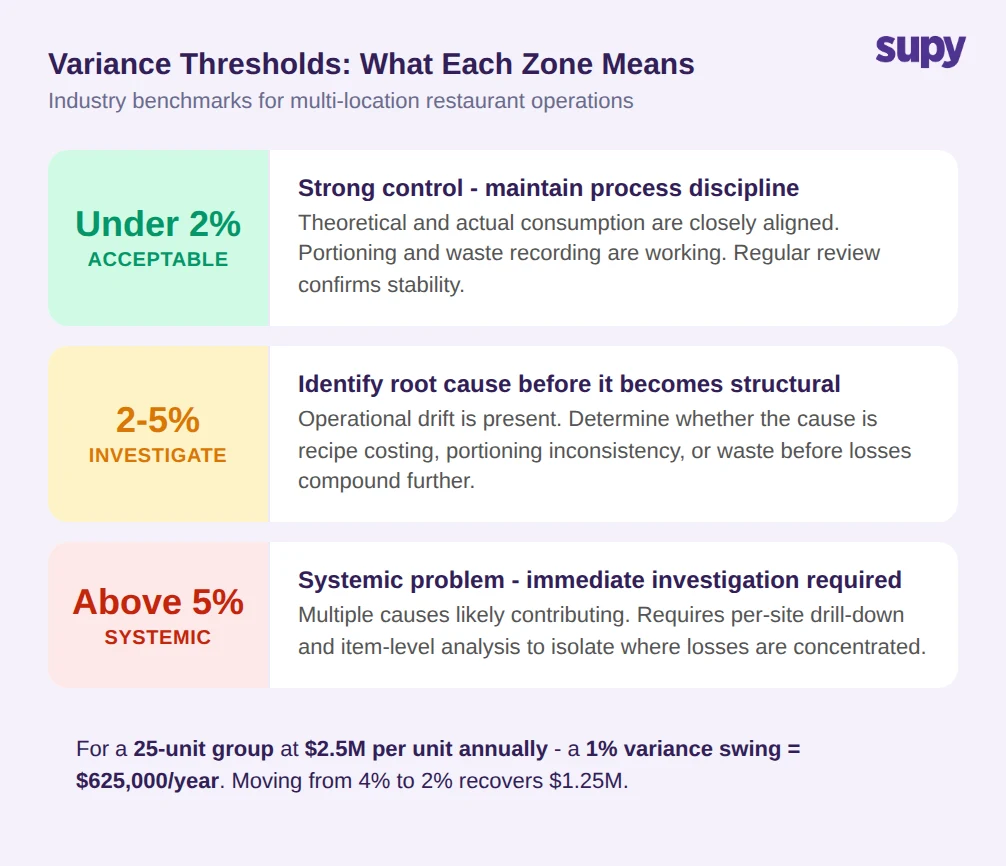
The financial stakes at scale make the threshold meaningful. For a 25-unit restaurant group generating $2.5M per unit annually, a 1% variance swing across the group equals $625,000 per year. A group running at 4% above theoretical when 2% is achievable is leaving $1.25M a year in operational losses that better process control could recover.
These thresholds assume total variance visibility. A group that only measures overall food cost percentage but does not track theoretical-versus-actual at the item level cannot use these benchmarks accurately - because the operational causes driving the variance remain unknown.
The number that matters most is not the overall variance percentage. It is the variance decomposed by cause - how much is portioning, how much is waste, how much is unaccounted for - because each percentage point has a different corrective action and a different cost to fix.
If you can only see a total variance percentage, the real question is not "how high?" but "from what?"
The Process Controls That Make Variance Investigations Reliable
Reliable variance analysis depends on the operational process around counting and investigation - not just the software that generates the variance figure. Three process controls make the difference between an investigation that reaches a conclusion and one that ends in a write-off.
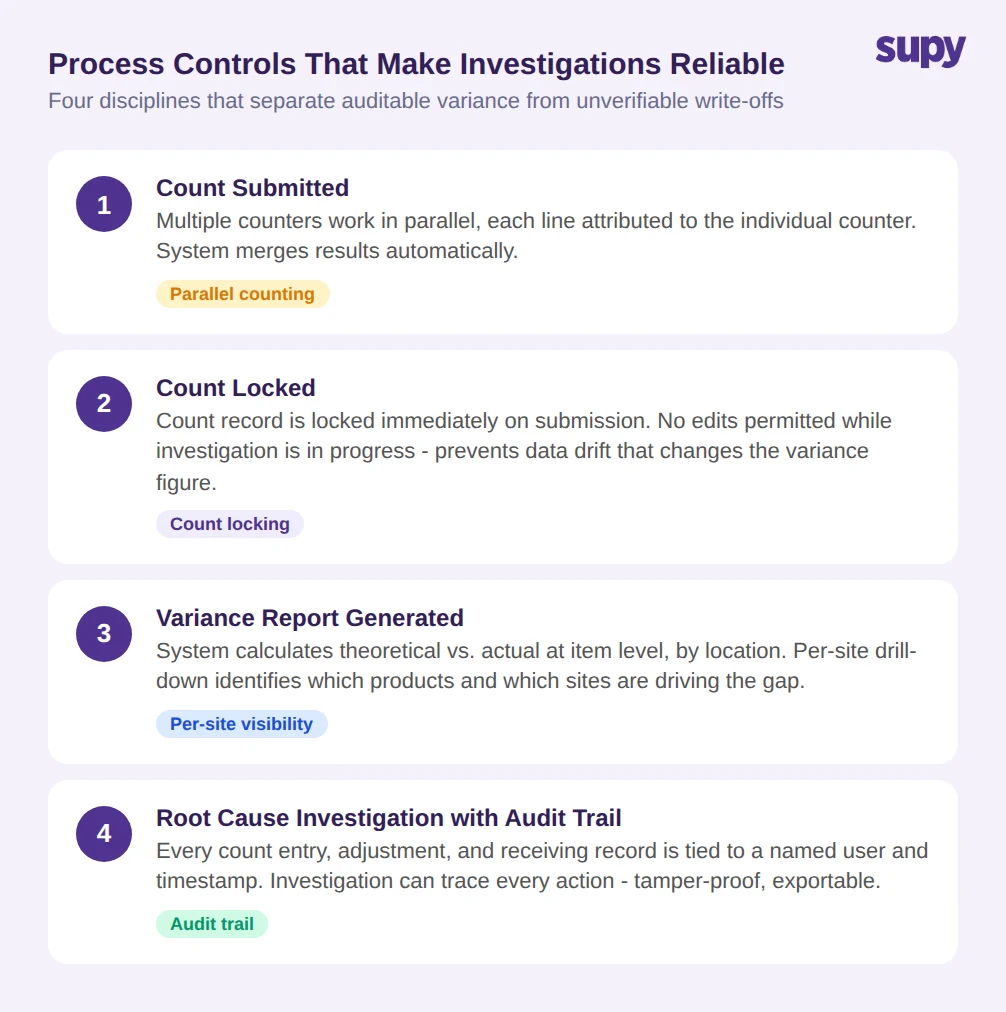
Count locking prevents any edits to a submitted count while the variance investigation is in progress. Without count locking, managers can adjust count figures after seeing the variance report - which changes the variance number without changing the operational reality. A count that can be edited post-submission cannot produce an auditable variance figure.
Audit trails link every count entry, every stock adjustment, and every receiving record to a named user and a timestamp. When a variance investigation needs to trace why actual consumption diverged from theoretical during a specific week, the audit trail provides the operational record of what happened and who was responsible.
Parallel counting allows multiple team members to count simultaneously, with the system merging results and attributing each line to the counter. At multi-location scale, a count process that requires a single counter to work sequentially through an entire location is slow enough that stock moves while the count is in progress - introducing errors that show up as variance.
Supy's inventory module covers all three: stock counts can be locked on submission, audit logs capture every action with user-level attribution and cannot be edited or deleted, and parallel counting merges results with attribution across multiple team members. The interactive dashboards provide theoretical-vs-actual variance by site and by item, making per-location drill-down part of the routine review rather than a manual investigation process.
If a discrepancy is discovered, can your current system tell you who counted what, when, and whether the count record was locked before the investigation started?
Inventory variance analysis is not a reporting problem - it is a diagnostic problem. A single variance number is the starting point of an investigation, not the end of it. Multi-location groups that can only see aggregate variance numbers, reviewed monthly, will repeatedly encounter the same gap without understanding whether it comes from portioning, waste, theft, or a data error in their costing system.
Per-site visibility, recipe-linked consumption tracking, and locked count records with audit trails are the process infrastructure that turns a variance figure into a correctable cause. The groups that close their food cost gaps reliably are not doing more analysis on the same data - they are getting different data.
If your variance investigations keep ending in write-offs, the issue is not the investigation - it is the data infrastructure the investigation is running on.