.jpg)


Food Inventory Management
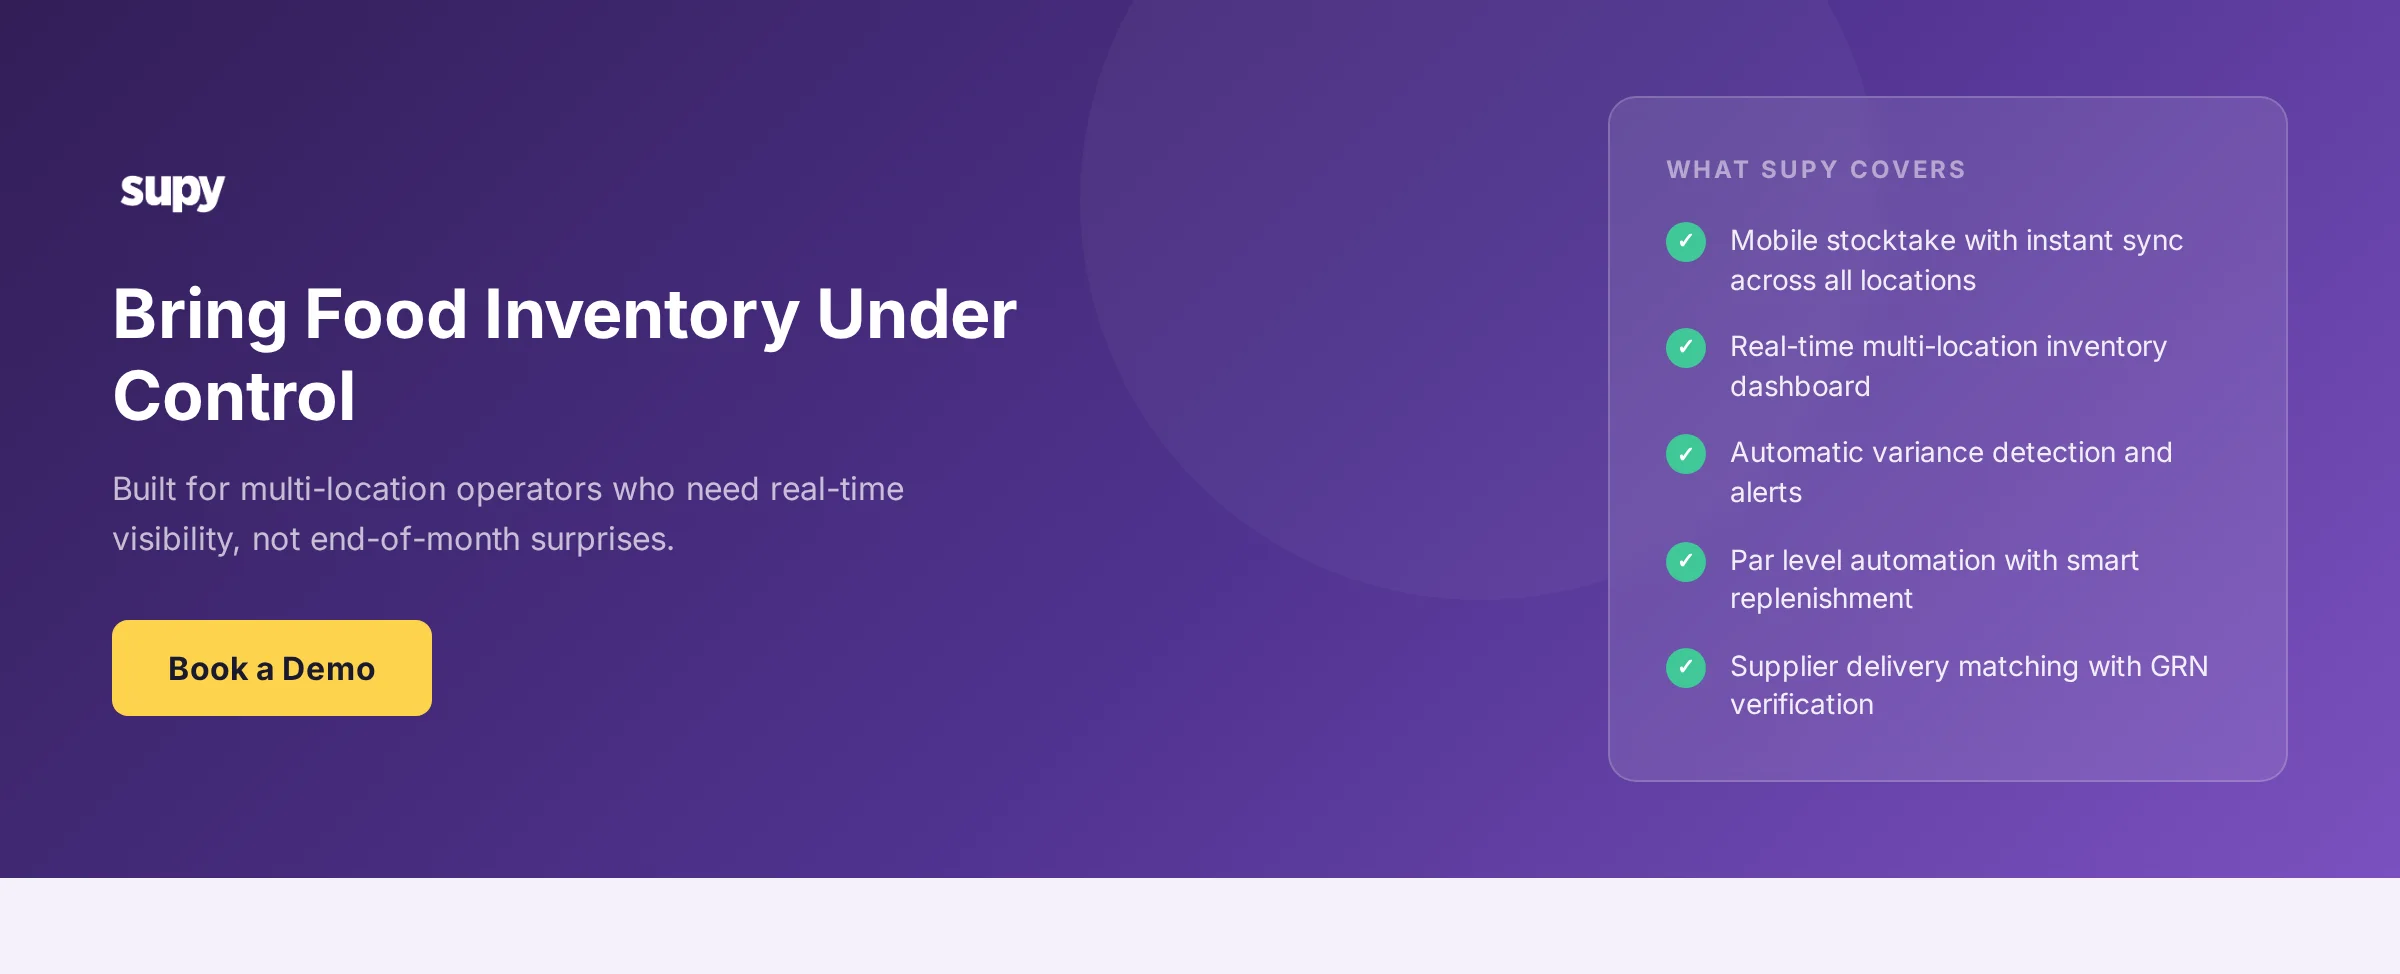
What Food Inventory Management Actually Means
Food inventory management is the process of tracking, controlling, and replenishing the food and beverage stock a restaurant uses to prepare and serve its menu. It sounds simple in definition - knowing what's in the fridge - but it's far more complex in practice.
Unlike general inventory management, food inventory deals specifically with perishable goods. Ingredients have expiry dates. They require specific storage temperatures. A 2 kg chicken fillet yields only 1.6 kg after trimming, meaning actual cost is higher than purchase cost. Stock must rotate in strict FIFO order (First In, First Out) to prevent older deliveries being buried and wasted under newer ones. These realities make food inventory harder to manage than almost any other business asset.
At a single location with a small menu, spreadsheets and a daily physical count might be sufficient. But multi-location restaurant operators know better. The complexity compounds at 5 locations, explodes at 10, and becomes unmanageable without dedicated software.
Food inventory management directly determines your food cost percentage - and every 1% reduction in food cost adds directly to net profit. This is why operators describe it as foundational: "I think we need something like this to kind of really get our portion control right."
Why Food Inventory Management Fails at Scale
Restaurant operators face three distinct challenges when managing food inventory across multiple locations:
Perishability creates constant urgency. Unlike non-perishable goods that can sit indefinitely, food has an expiry date. Overstocking costs you immediately through spoilage and waste. Understocking costs you in lost covers and stockouts. The window between these two extremes is narrow, and it changes day to day based on sales demand.
Yield loss eats into your theoretical food cost. When you receive a purchase order for "chicken fillets," the invoice is based on net weight. But when your kitchen staff processes those fillets, trimming and portioning, the actual usable weight is lower. That variance between purchase price and actual yield must be tracked and costed. Without visibility into yield loss by ingredient and location, you're flying blind on true food cost.
FIFO enforcement breaks down without software. First In, First Out means older stock is used before newer stock. In manual systems, newer deliveries are often placed in front of older stock because it's convenient. Three weeks later, the older stock expires unseen behind the newer boxes. At 10 locations, managing FIFO manually becomes impossible.
Multi-location visibility is the silent killer. Imagine managing the same ingredient across 5, 10, or 20 locations. Location A has excess parmesan sitting in cold storage. Location B ran out yesterday and paid a premium for emergency delivery. Location C never ordered it at all. Without a single system showing stock levels, par status, and pending orders across all sites, this inefficiency is invisible. Money is being wasted every single day.
A multi-site cafe group described their current state: "We have many documents, and each one is manually entered into Excel." Each location tracks inventory separately. Nobody has a consolidated view. Variance analysis - comparing what you should have used against what you actually used - becomes nearly impossible.
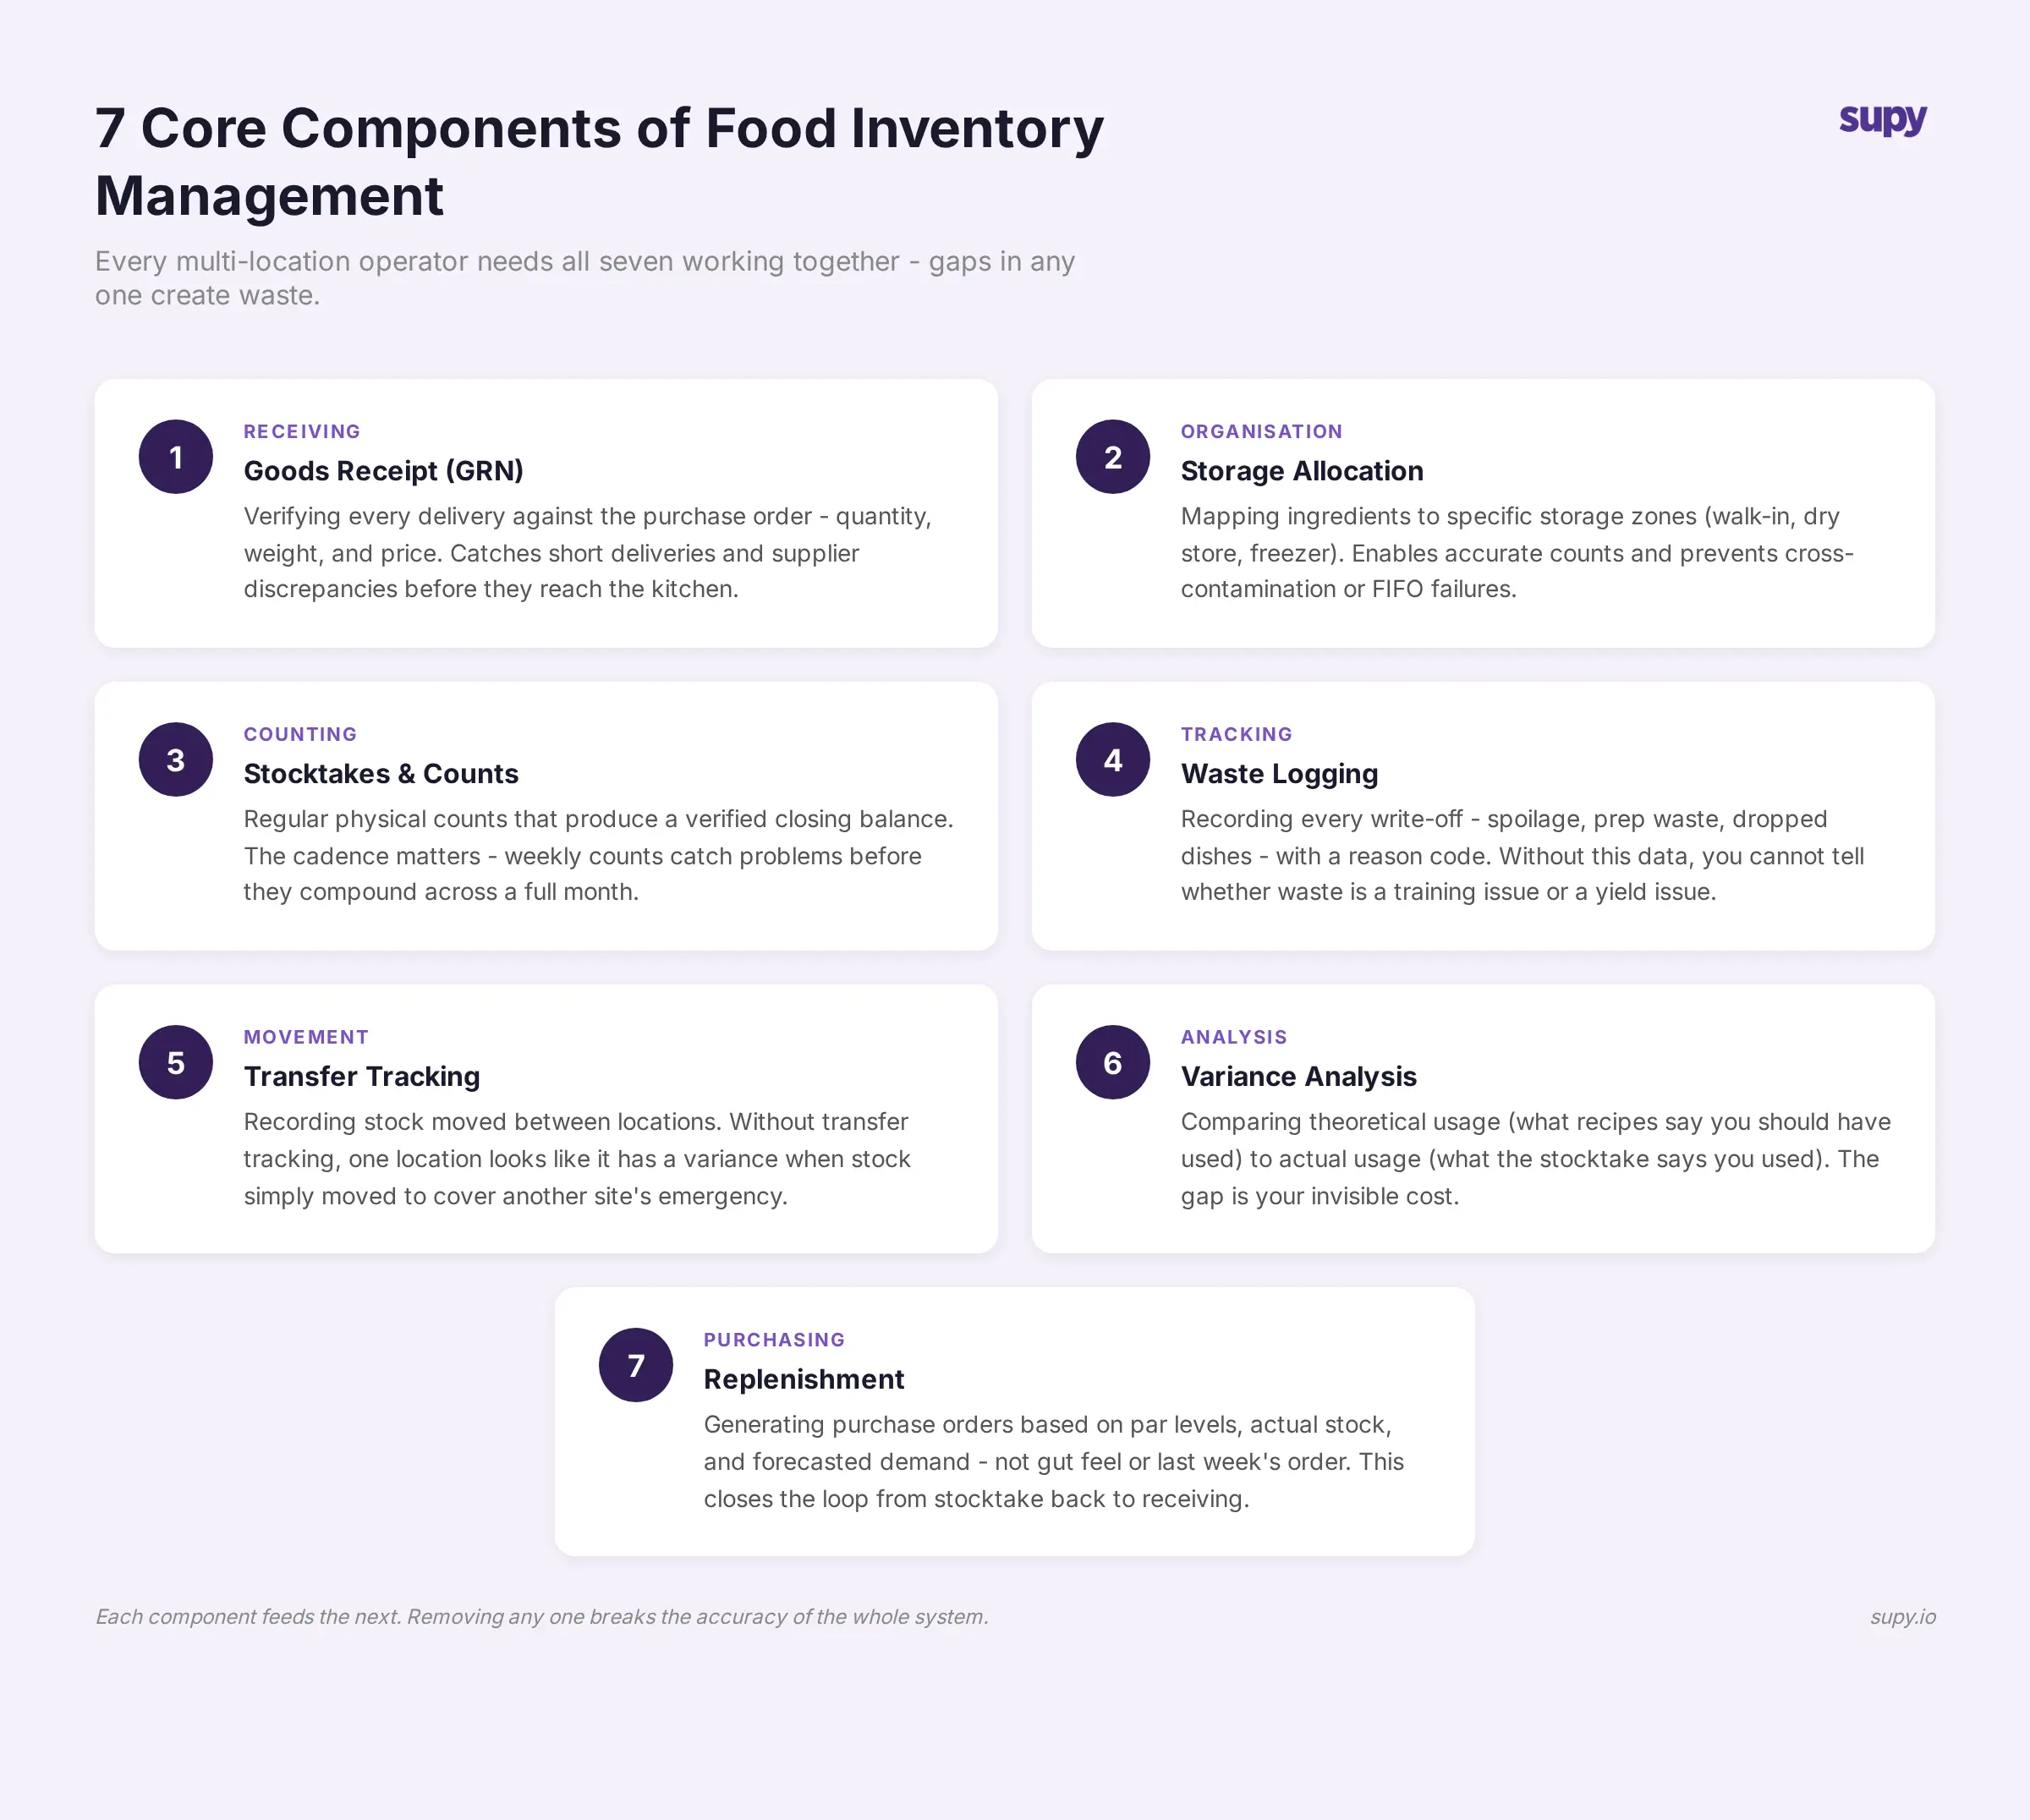
The Core Components of Food Inventory Management
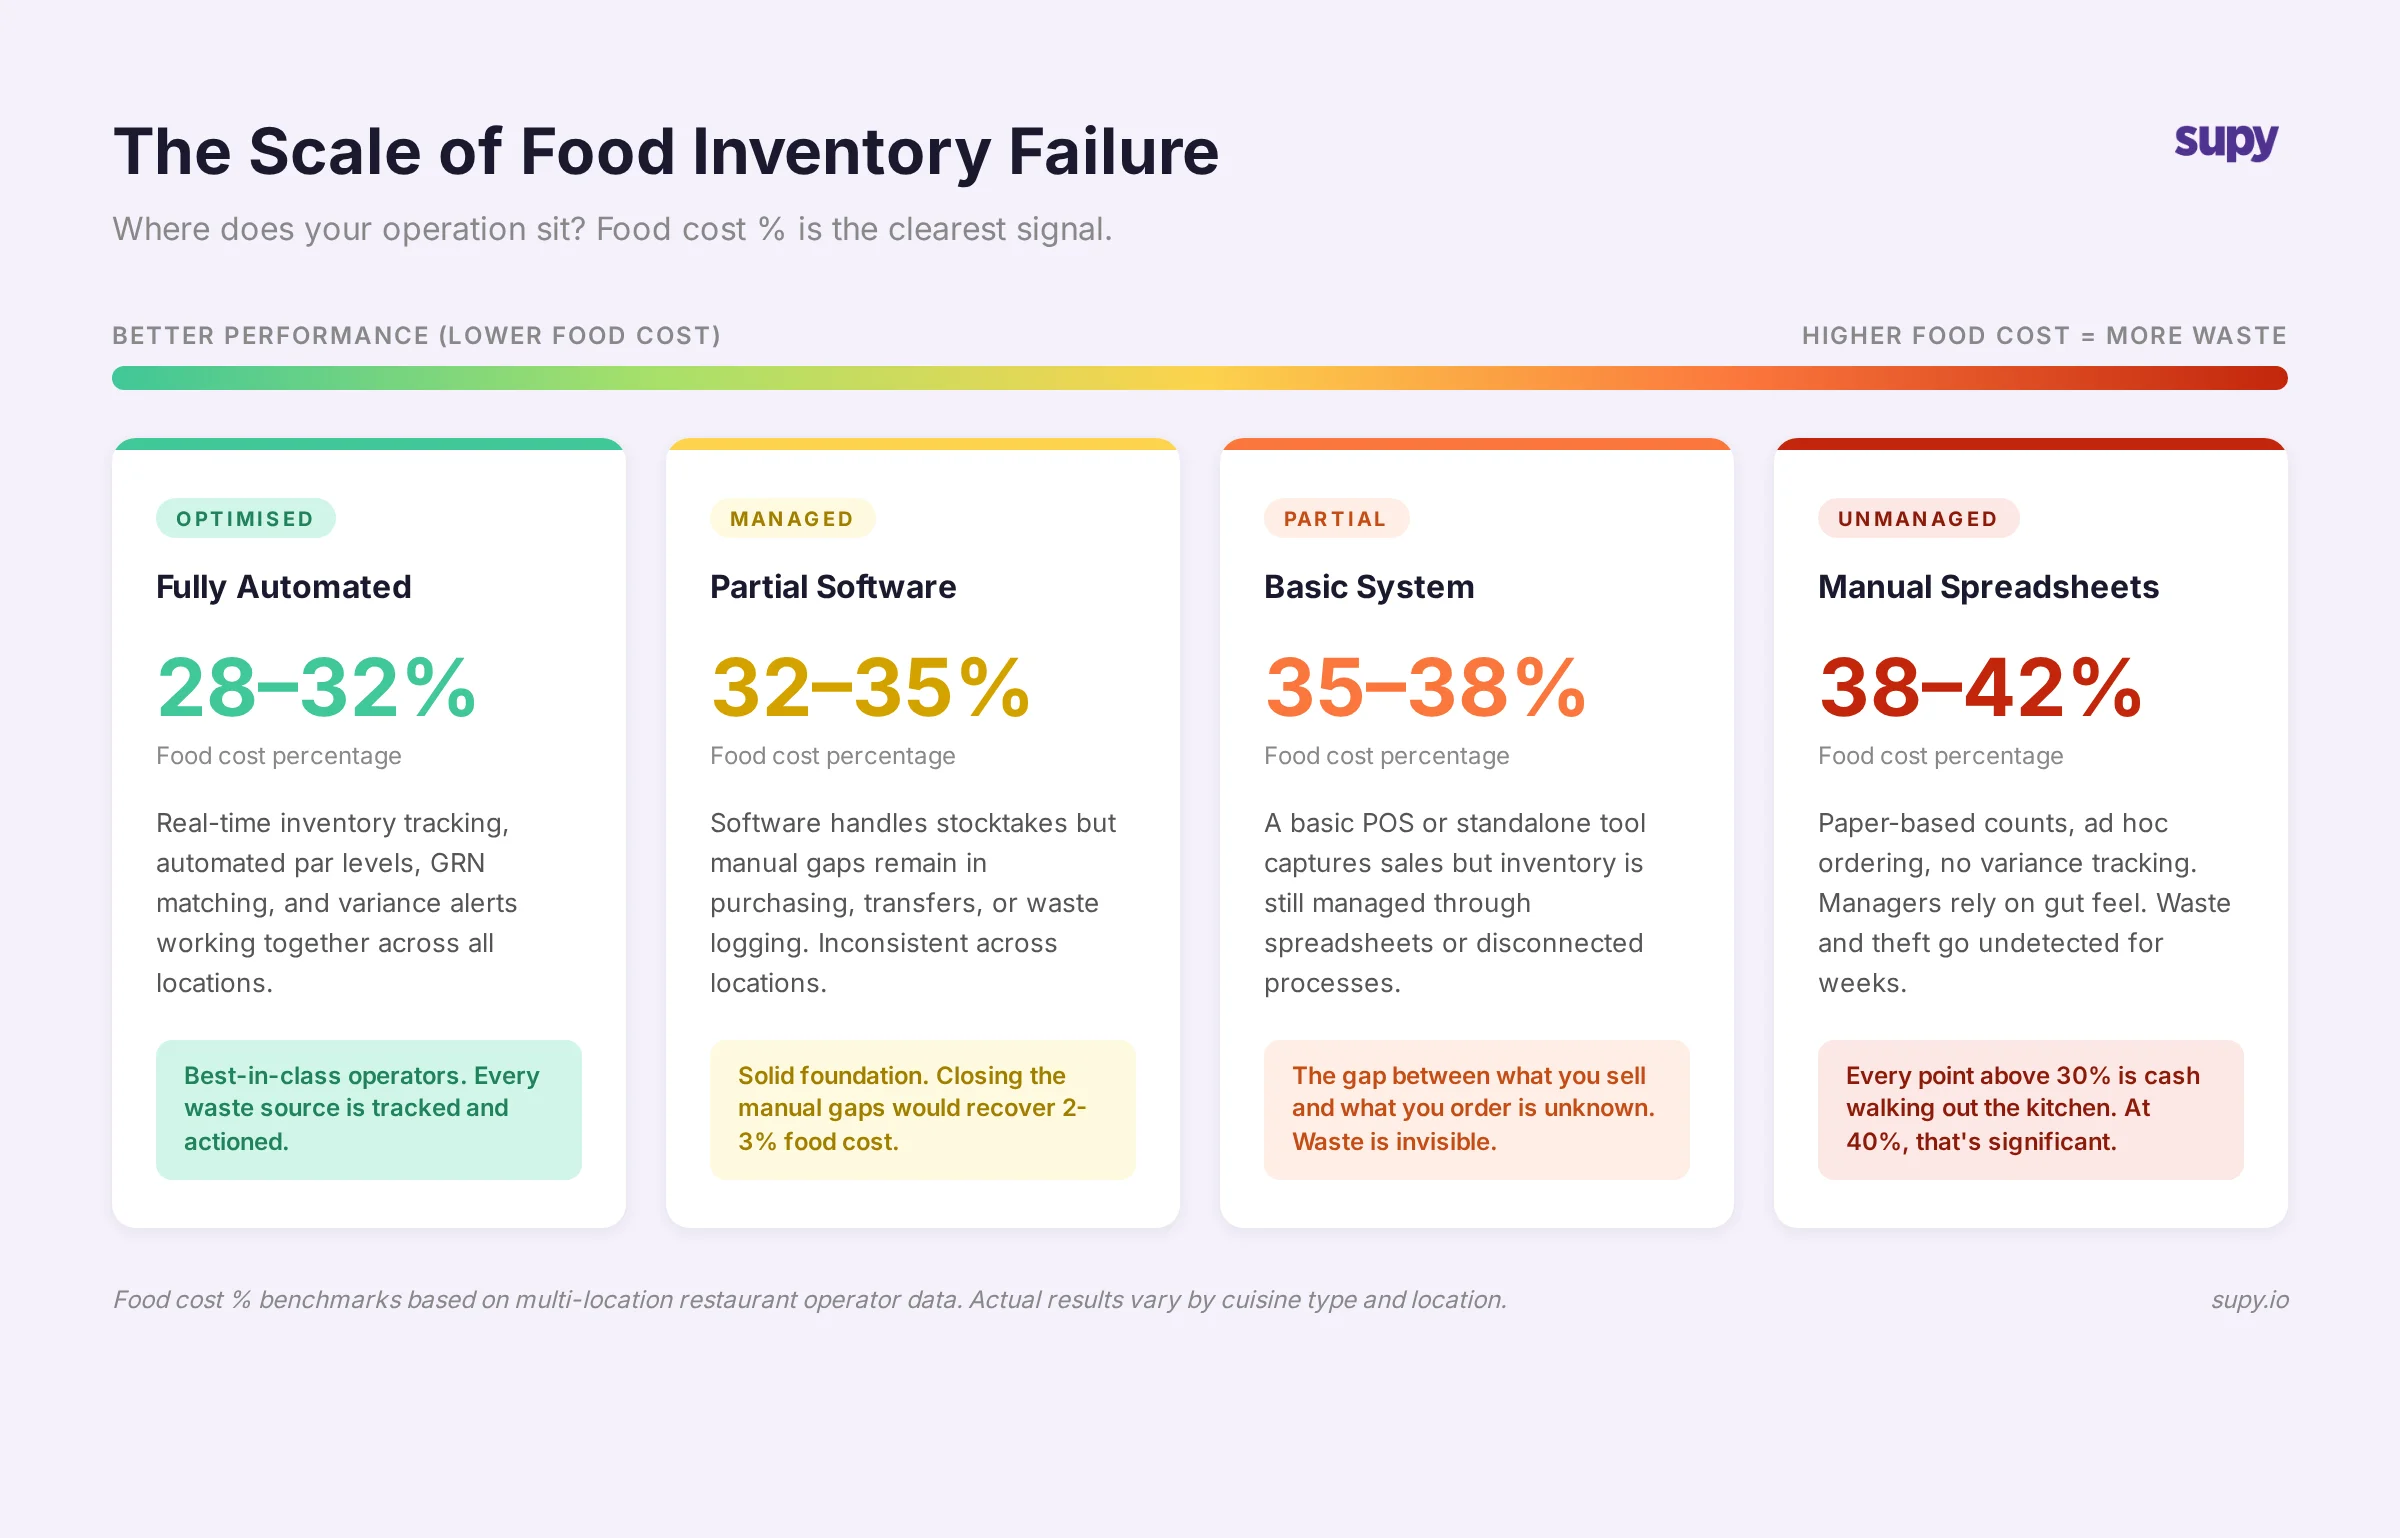
Food inventory management comprises seven key processes. Operators who run all seven well typically achieve food cost in the 28-35% range. Those running them poorly often find themselves at 40% or higher, with no clear idea where the money goes.
1. Goods Receipt (GRN - Goods Receipt Note) When a delivery arrives, it's checked against the purchase order. Quantity is verified (did we receive the full 50 units?), condition is checked (is the temperature maintained on chilled items?), price is verified (is it the agreed amount per unit?), and expiry dates are recorded. Only after this check is the stock received into inventory. A GRN process catches supplier errors immediately instead of discovering them during stocktake.
2. Storage Allocation Stock is placed in the correct storage area - dry storage at room temperature, chilled at 2-4°C, or frozen at -18°C or below. This sounds basic, but temperature drift is a common cause of premature spoilage. FIFO rotation is applied immediately: new stock goes behind existing stock so older items are used first.
3. Stocktakes and Physical Counts How often depends on the ingredient's shelf life and usage rate. High-value, fast-moving items may be counted daily. Slower-moving items may be counted weekly. Expired or damaged stock is removed and logged. Without regular counts, phantom inventory builds up - your system says you have 10 units when you actually have 6.
4. Waste Logging Every bit of spoilage, over-prep, and incorrect prep is recorded: which ingredient, how much, and why. Was it over-prepared and not sold? Did it expire? Was it damaged on arrival? Was it incorrect portioning? This data reveals patterns. If you're losing 15% of your parmesan to spoilage every month, that's a signal - either par levels are too high, or something is wrong with storage or FIFO.
5. Transfer Tracking Stock moves between locations - a delivery was sent to Location A but Location B needs it more urgently. Every transfer gets a paper trail. Without tracking, "phantom inventory" occurs: Location A records the stock sent out, but Location B never records receiving it. Your system is out of balance.
6. Variance Analysis Theoretical usage is calculated from your recipes and sales: if you sold 50 chicken dishes, and each uses 200g, you should have used 10 kg of chicken this week. Actual usage is measured by comparing opening stocktake, plus purchases received, minus closing stocktake. The difference is variance. Large variances signal waste, theft, yield loss, or recipe errors.
7. Replenishment Par levels trigger reorders before you run out. A par level is the minimum stock quantity for each item at each location. When stock drops below par, a reorder is triggered automatically - or at least flagged for manual ordering.
Par Levels and FIFO: The Two Non-Negotiables
Two practices separate well-managed food inventory from poorly managed food inventory: par levels and FIFO.
Par Level Essentials
A par level is the minimum stock quantity for an ingredient at a specific location. It's calculated as: (average daily usage x lead time in days) + safety stock.
Example: Your location uses 2 kg of fresh basil per day. Your supplier's lead time is 2 days. You want 1 day of safety stock in case usage spikes. - Par level = (2 kg x 2 days) + (2 kg x 1 day) = 6 kg
When stock drops below 6 kg, you order more. This prevents both stockouts and overstocking. Set it too high, and perishables expire on the shelf. Set it too low, and you run out of menu items during service.
At scale - managing par levels across 100+ ingredients at 10+ locations - manual par management becomes a scheduling nightmare. You need a system that monitors stock levels automatically and flags when items fall below par.
FIFO (First In, First Out)
FIFO means older stock is used before newer stock. It's critical because food expires. A delivery that arrives on Monday must be used before Wednesday's delivery, assuming both have the same shelf life.
In manual kitchens, FIFO is enforced through careful storage organisation - older items in front, newer items behind. But at scale, with multiple storage areas and high product velocity, enforcement breaks down. Newer deliveries get placed in front because it's convenient. Older items expire unseen.
The cost of poor FIFO is real. A restaurant chain managing 200 ingredients across 5 locations can lose thousands per month to expired stock that was never used because newer deliveries buried it.
How Food Inventory Management Connects to Profitability
Food cost percentage is your food spend divided by revenue. A restaurant serving 500 covers per week at an average check of $25 USD has weekly revenue of $12,500. If food cost is 35%, that's $4,375 spent on ingredients. If you can reduce food cost to 30%, you save $625 per week - that's $32,500 per year from a single location.
Operators often describe their target as: "My goal is to get us down to about 30%, and we are still skating at around 40%." That's a 10 percentage point gap - a gap that food inventory management directly addresses.
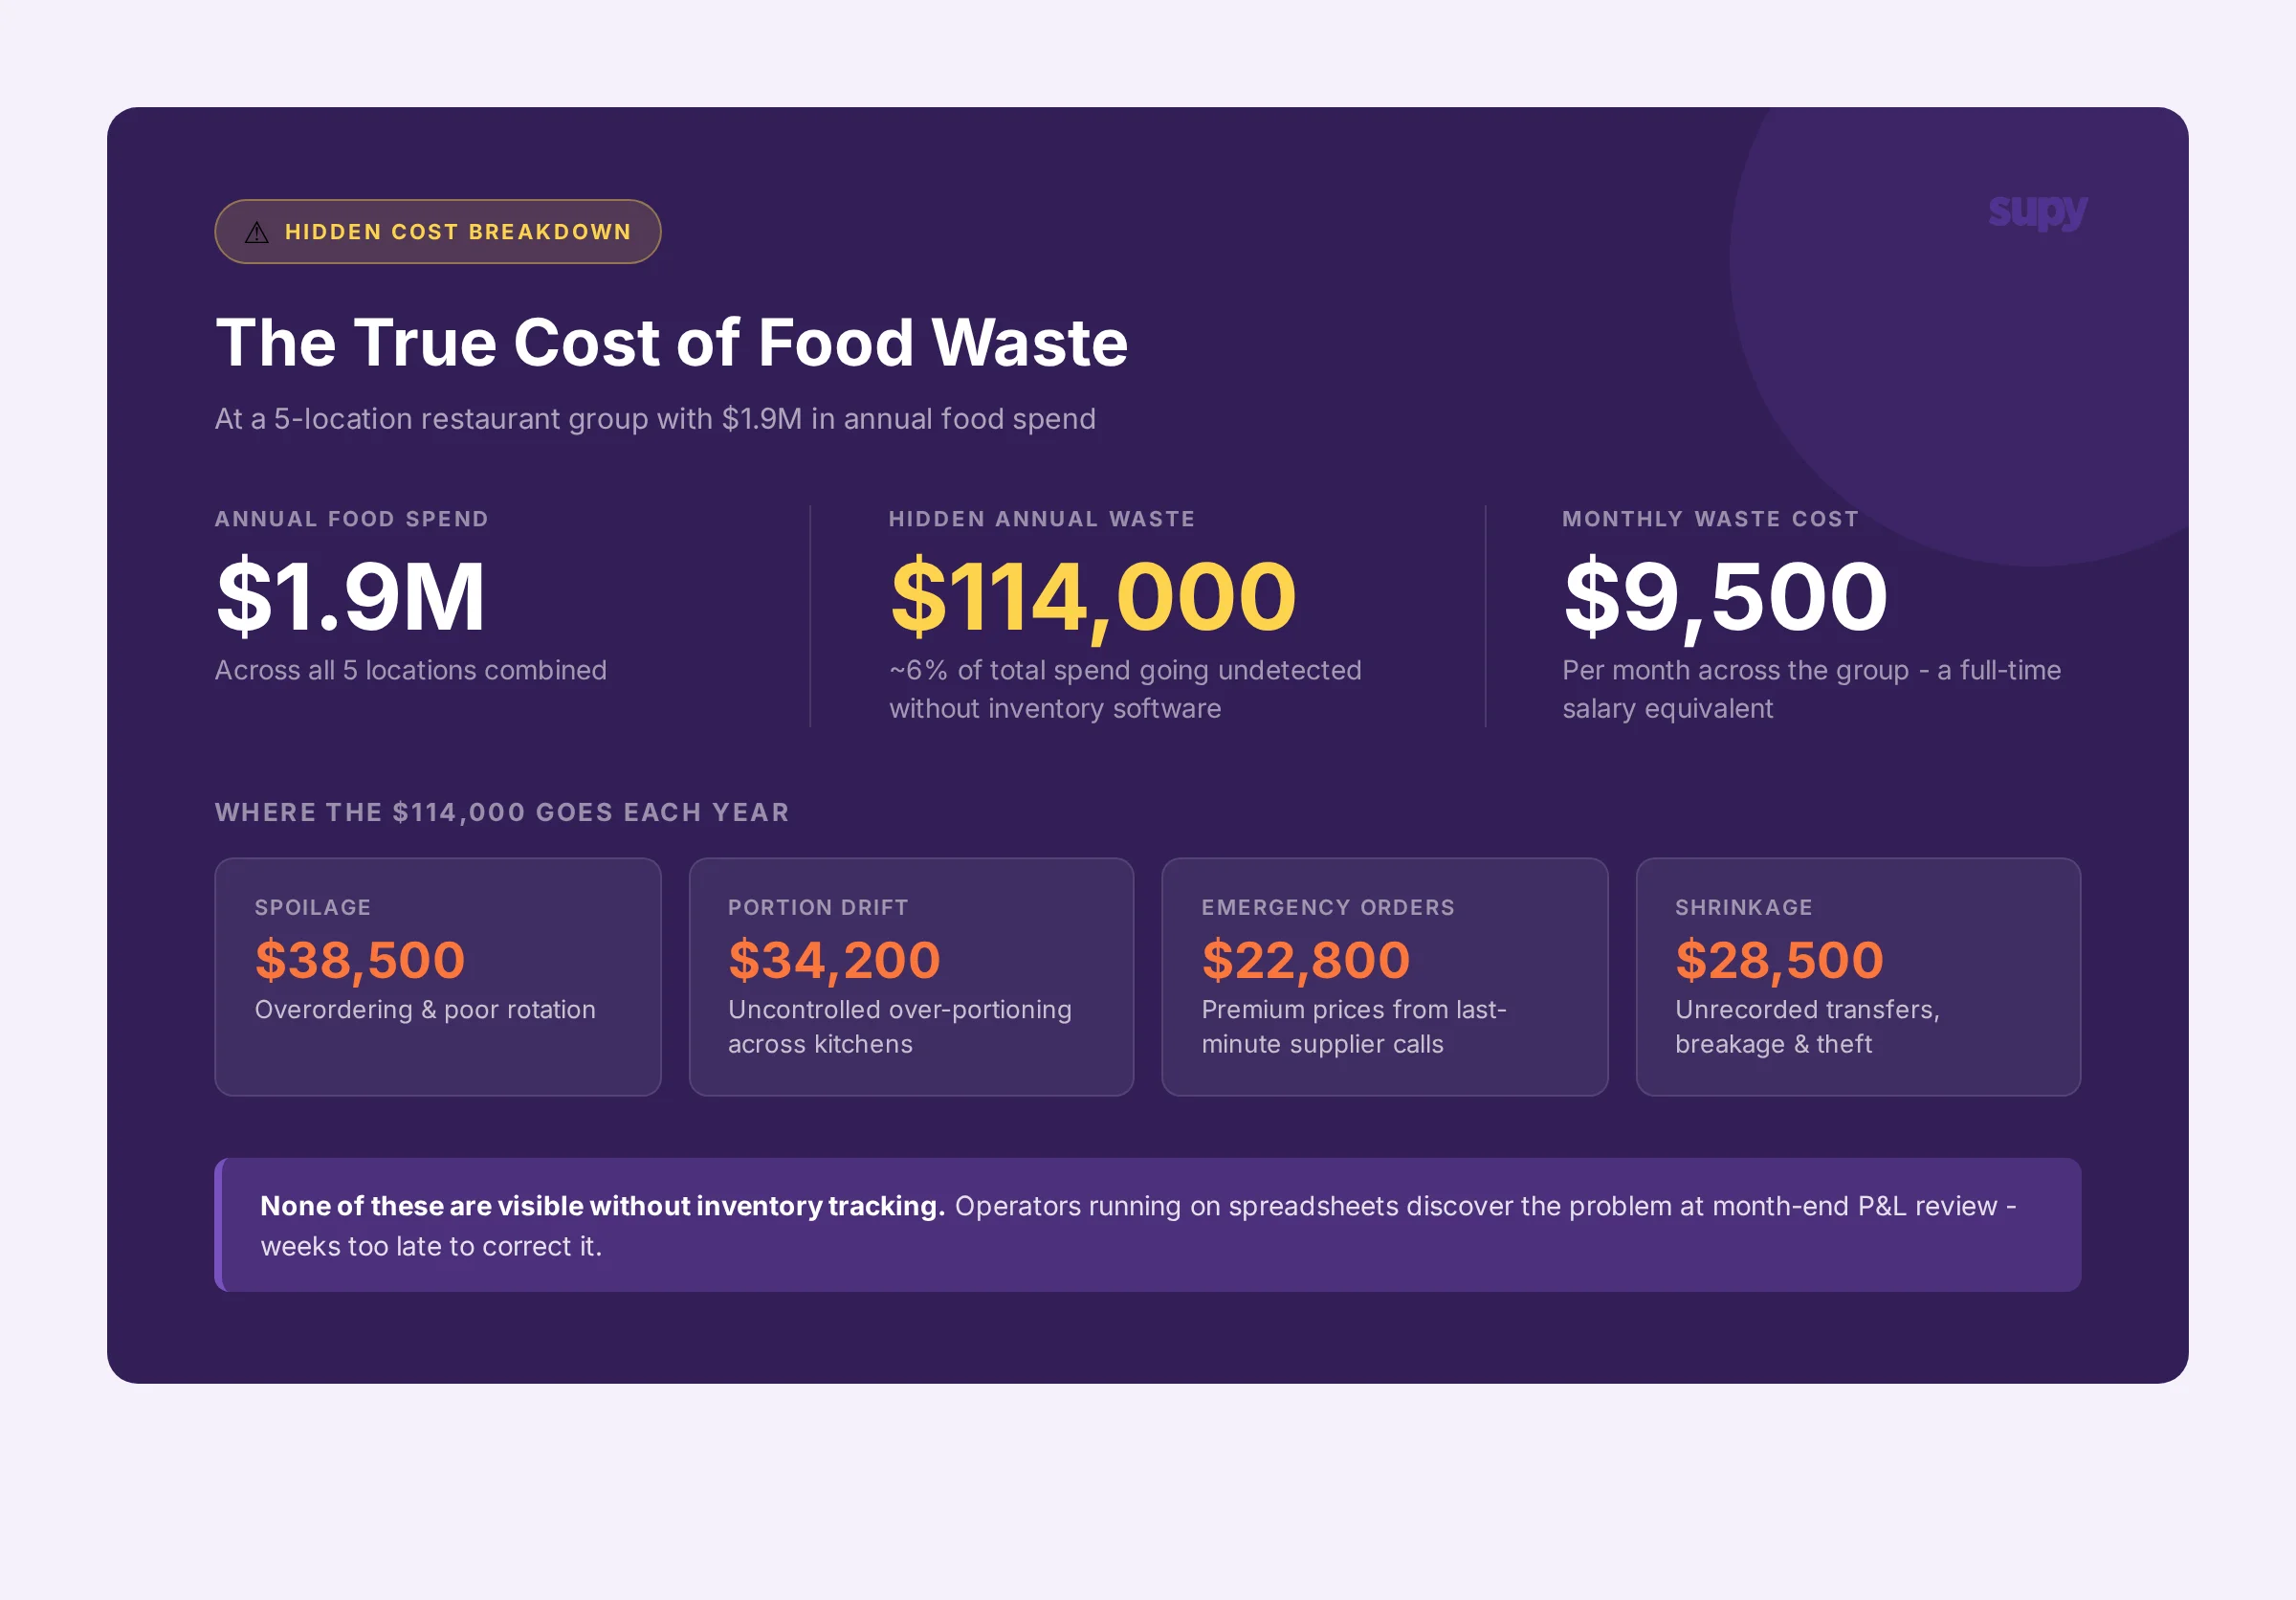
Unmanaged inventory leads to: - Over-ordering due to poor par levels (stock expires before use) - Under-ordering due to inaccurate stock visibility (expensive emergency orders) - Undetected shrinkage (theft, accidental waste, poor FIFO) - Unchecked portion drift (customers get 250g when the recipe calls for 200g) - Recipe costing errors (theoretical cost is wrong because yield loss isn't factored in)
Variance analysis reveals where the money is going. A 5% variance between theoretical usage and actual usage on a $1 million annual food spend is $50,000 unaccounted for. Find it and fix it, and that money goes straight to profit.
Manual vs Software-Based Food Inventory Management
Spreadsheets work at one or two locations with a small menu. They fail at scale.
Where Spreadsheets Work: - Small location with 50-80 ingredients - Manual daily count is feasible - One person responsible for all stock - Minimal inter-location transfers - Supplier orders are simple and regular
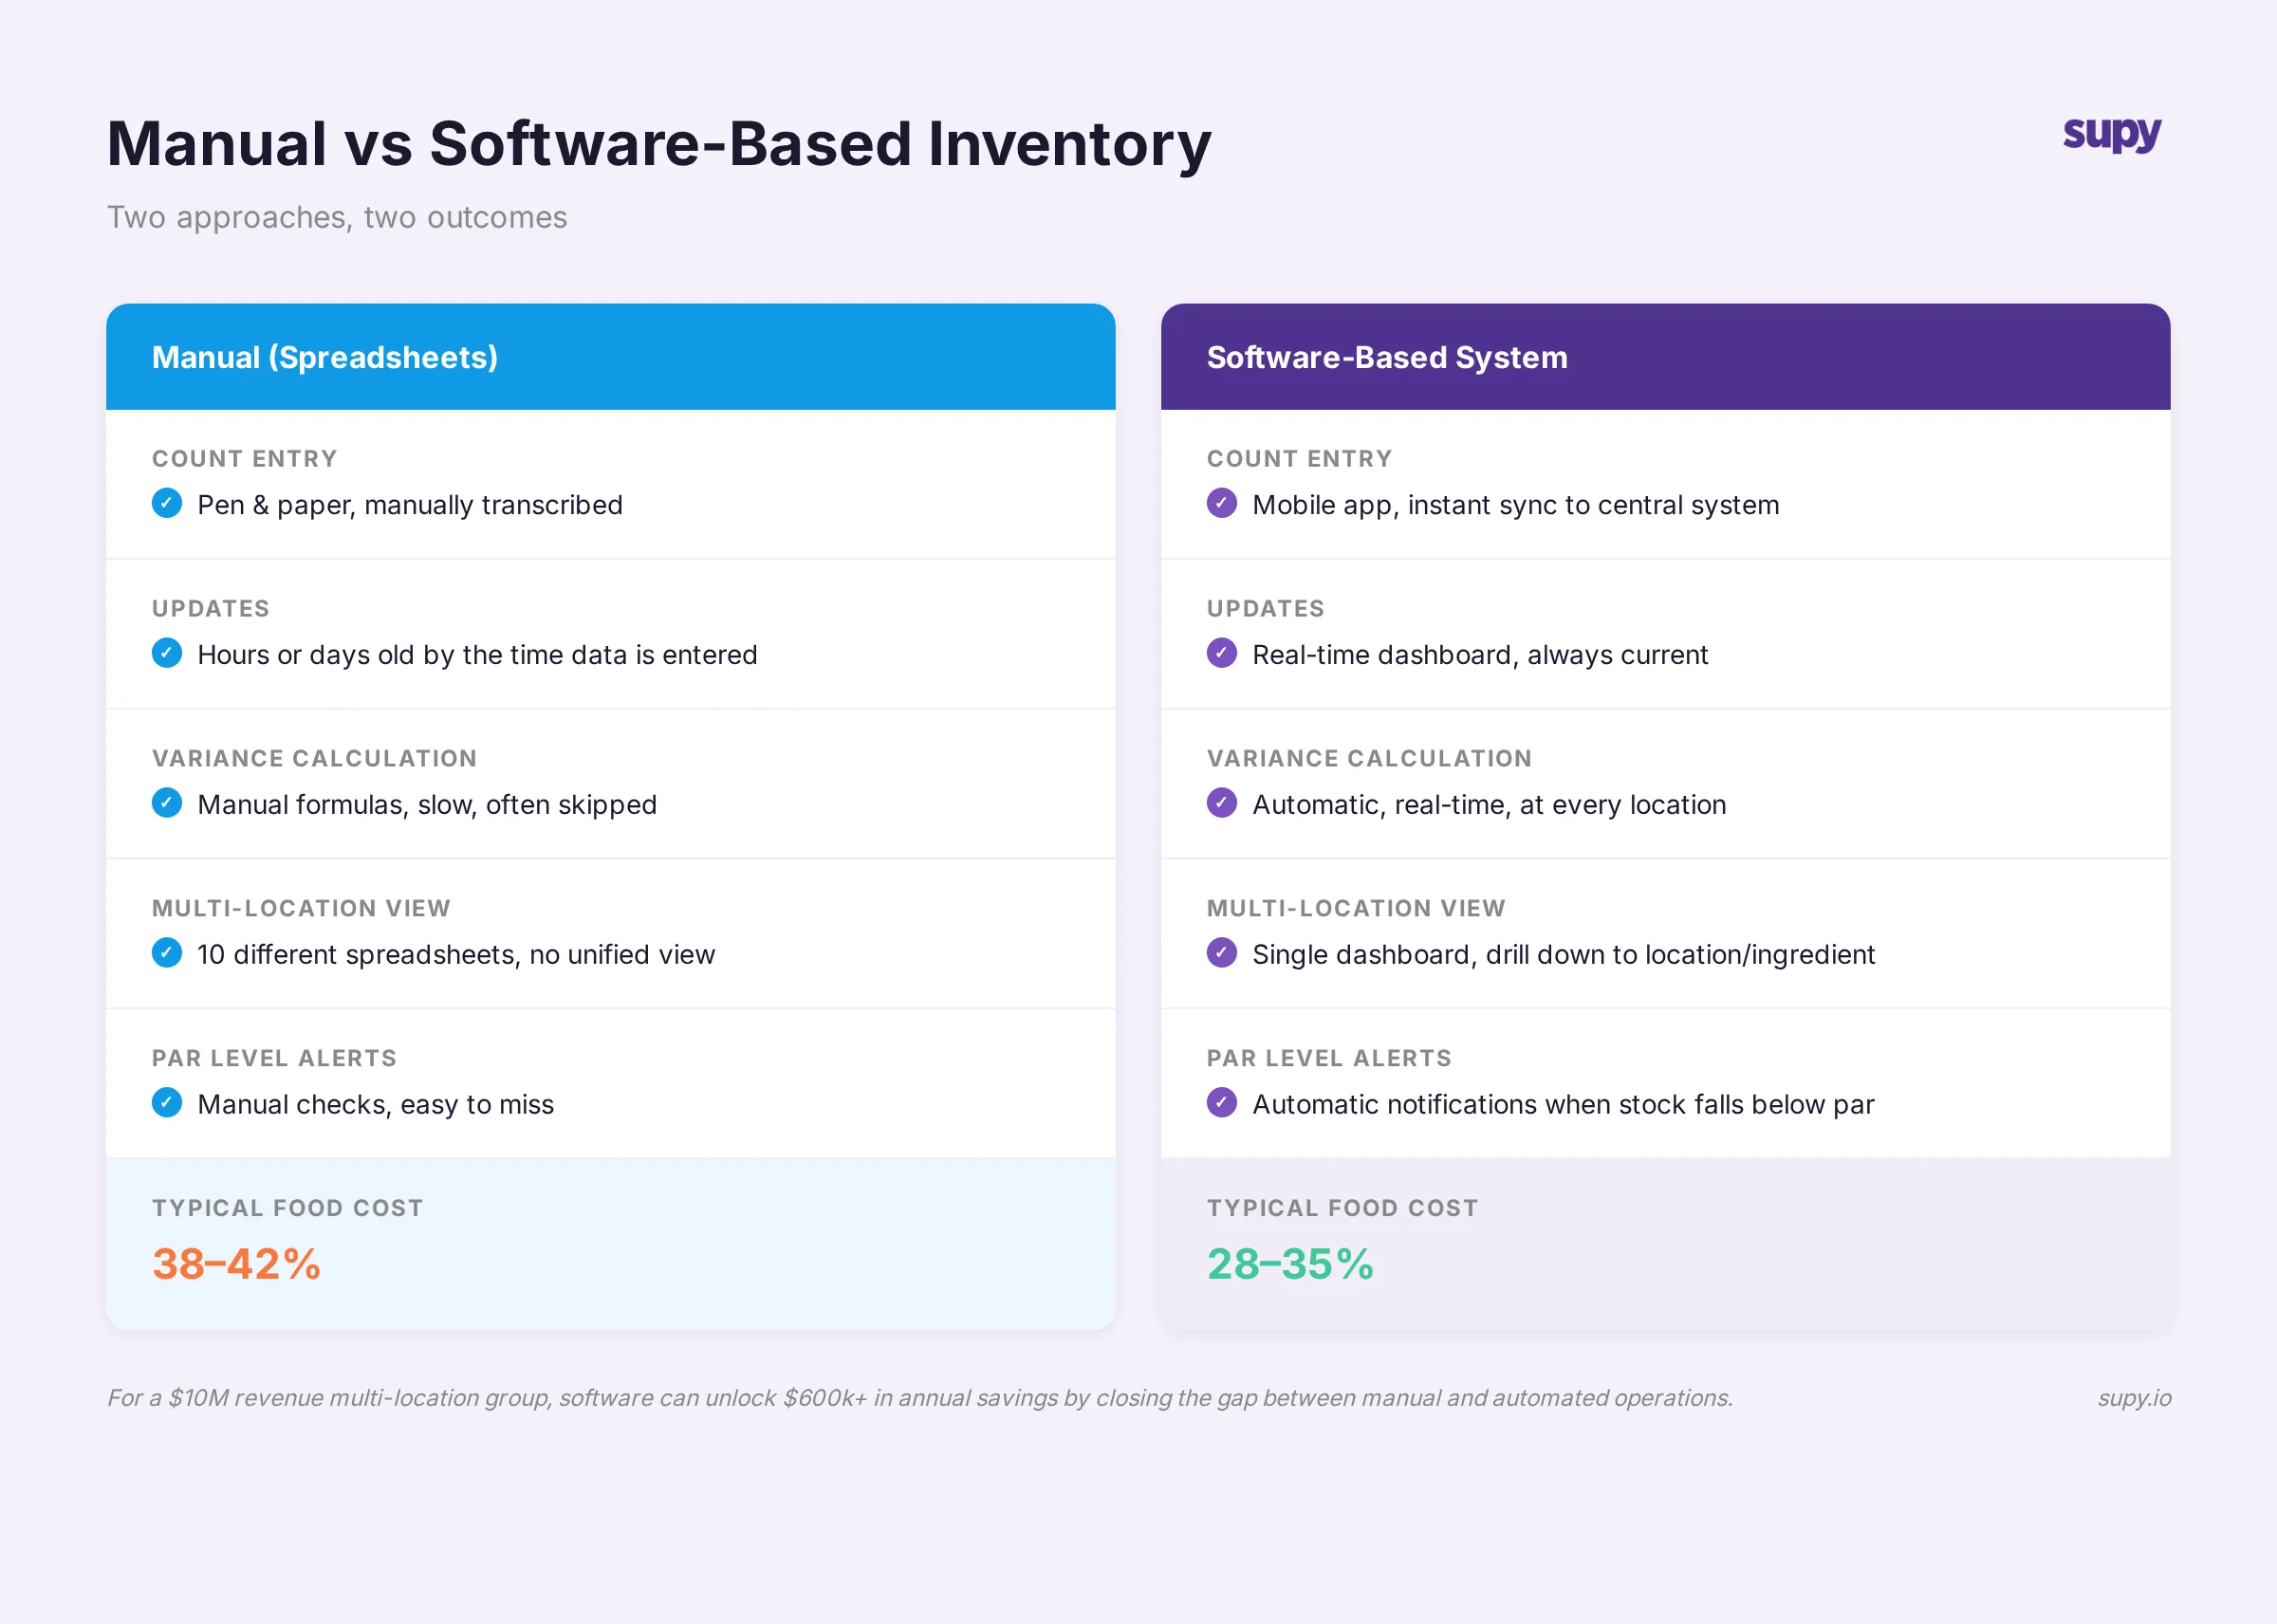
Where Spreadsheets Fail: - Manual count entry errors are inevitable at scale (100+ ingredients) - No real-time updates - counts are hours or days old - Variance calculation is manual and slow (if it happens at all) - No multi-location consolidation - each location has its own sheet, no unified view - No automatic par level alerts - you have to check manually - No automatic GRN matching to purchase orders - price variances aren't caught - FIFO tracking is manual and unreliable - Waste logging is optional and inconsistent
A multi-site cafe group described their situation: "We have many documents, and each one is manually entered into Excel." Every location maintains its own spreadsheet. Data quality degrades because the process is tedious and error-prone. Nobody has time to do variance analysis.
Where Software Excels: - Mobile stocktake: count stock on a phone or tablet, syncs instantly to central system - Automatic variance calculation: theoretical vs actual usage is calculated in real time - Par level alerts: automatic notifications when stock drops below par - Multi-location consolidation: single dashboard showing all locations, with drill-down capability - GRN matching: supplier delivery checked against purchase order, price variances flagged - FIFO enforcement: system enforces stock rotation if configured with batch tracking - Waste logging: recorded in the same system, immediately visible in variance reports - Recipe integration: when a dish is sold via POS, ingredients are automatically deducted from stock, making theoretical usage accurate
Software transforms inventory from a cost centre (management overhead, occasional reconciliations) into a profit centre (real-time visibility, automated waste detection, continuous improvement).
What Good Food Inventory Management Looks Like at 10+ Locations
A well-managed multi-location operation has these characteristics:
- Daily high-value counts and weekly full counts. High-value items (prime cuts, premium spirits) are counted daily. Everything else is counted weekly at minimum. Counts take 30-45 minutes per location because they're entered directly into the system on a mobile device - no manual transcription.
- Par levels are reviewed quarterly. As menus change and sales mix shifts, par levels are updated to reflect new usage patterns. They're not set once and forgotten.
- Variance is reviewed weekly. Every Friday, managers review the week's variance report by location and ingredient. Any ingredient with variance over 5% triggers investigation. Root causes are identified (over-prep, poor FIFO, yield loss, theft) and addressed.
- GRN process is enforced on every delivery. No stock enters inventory without being checked against the purchase order. This catches supplier errors and quality issues immediately.
- Stock transfers are logged and reconciled. When stock moves between locations, both locations record the movement. Monthly reconciliation ensures the system matches physical reality.
- Waste is logged daily. At end of shift, any spoilage or waste is recorded with a reason code. This data informs par level adjustments and training priorities.
- FIFO is enforced through storage organisation and (where available) batch tracking. Newer deliveries are stored behind older deliveries. If possible, barcode scanning with expiry dates automatically surfaces stock nearing expiry.
The result: food cost runs 28-32%, variance is under 3%, and the operation is profitable and resilient. Stock is rarely out, spoilage is minimal, and managers have real-time visibility to make decisions.
How Supy Handles Food Inventory Management
Supy brings three core capabilities to food inventory management: mobility, visibility, and automation.
Mobile Stocktake Count stock on a mobile app or tablet. No pen and paper. Counts are transmitted to the central system instantly, eliminating manual transcription and the errors that come with it. Managers can count from anywhere - the main kitchen, the walk-in, even remote locations via video call if necessary.
Recipe-Linked Inventory When a dish is sold through the POS system, ingredients are automatically deducted from inventory based on the recipe. This makes theoretical usage accurate without manual entry. Variance analysis becomes reliable because it's comparing actual system data (what was sold) against counted stock (what remains).
Multi-Location Dashboard A single view of food inventory across all locations. See which locations have excess stock, which are below par, which have pending orders. Drill down by location or ingredient. No need to check 10 different spreadsheets.
Variance Reports Automatic calculation of variance by location, ingredient, and time period. Identify which locations are wasting the most, which ingredients have the highest variance, and where to focus improvement efforts.
Par Level Automation Set par levels once. The system monitors stock levels and alerts managers (or reorders automatically) when items fall below par. As sales mix changes, par levels can be adjusted quickly across all locations.
Supplier Delivery Matching Goods Receipt Notes are checked against purchase orders. If a delivery arrives with 50 units but the PO was for 40, the system flags the discrepancy. If the unit price is 10% higher than the PO, that's flagged too.
Waste and Shrinkage Tracking Log spoilage, over-prep, and waste in the same system. Track by ingredient, reason, location, and time period. This data is used to refine par levels and identify systemic issues.
Coming Soon: Barcode Scanning with Expiry Date Tracking The product roadmap includes barcode scanning with automatic expiry date capture. This will further automate FIFO enforcement and flag stock nearing expiry before it spoils.
When operators gain real-time visibility into food inventory across all locations, they're excited. One customer captured it: "I think we are really excited to be able to have a better live view of everything." That visibility is what transforms food inventory from an operational burden into a managed profit lever.