.jpeg)

Pourcentages de perte de préparation obsolètes : pourquoi l'écart d'inventaire se creuse quand les rendements de recettes ne sont pas réévalués
Votre écart d'inventaire dérive dans le mauvais sens depuis des semaines. Rien n'a manifestement changé : les mêmes fournisseurs, les mêmes recettes, les mêmes prises d'inventaire. Mais la consommation théorique et la consommation réelle s'écartent de plus en plus, et chaque révision se termine par le même haussement d'épaules et une vague note sur le gaspillage. Avant de chercher un vol ou un problème de réception, vérifiez le chiffre le moins visible de tout le système : le pourcentage de perte de préparation inscrit dans vos recettes. Il a très probablement été défini une fois, lors de l'onboarding, et n'a plus jamais été modifié.
Ce seul chiffre décide de ce que votre plateforme pense que vous auriez dû utiliser. Quand il cesse de correspondre à la réalité, votre écart n'augmente pas d'une manière que quelqu'un remarque. Il s'infiltre, article par article, jusqu'à ce qu'une révision trimestrielle fasse apparaître un écart que personne ne peut rattacher à une cause.
Ce que contrôle réellement un pourcentage de perte de préparation dans vos prises d'inventaire
Un pourcentage de perte de préparation représente la part d'un ingrédient brut perdue lors du nettoyage, de la découpe, du portionnement ou de la cuisson avant d'entrer dans un plat. Si une recette de pulpe d'acaï porte un taux de perte de 10 %, le système suppose que 10 % est perdu en préparation et que seulement 90 % devient un output utilisable. Ce pourcentage unique alimente chaque chiffre de consommation théorique que la plateforme calcule pour cet ingrédient.
Considérez-le comme le pont entre ce que vous achetez et ce que vos recettes indiquent que vous devriez utiliser. Quand le pourcentage est juste, la consommation théorique suit ce qui quitte réellement l'étagère. Quand il est obsolète, chaque chiffre en aval hérite silencieusement de l'erreur, car rien dans le rapport ne signale un pourcentage comme ancien. Il continue simplement à faire les calculs qu'on lui a demandé de faire.

Pourquoi vos rendements réels évoluent mais le pourcentage système reste figé
Les rendements ne sont pas des propriétés fixes d'un ingrédient. Ils varient selon la qualité du fournisseur, la saisonnalité, la personne qui effectue la préparation et l'équipement disponible. Le chiffre que vous avez saisi à l'onboarding était précis le jour où vous l'avez mesuré et se détériore lentement depuis.
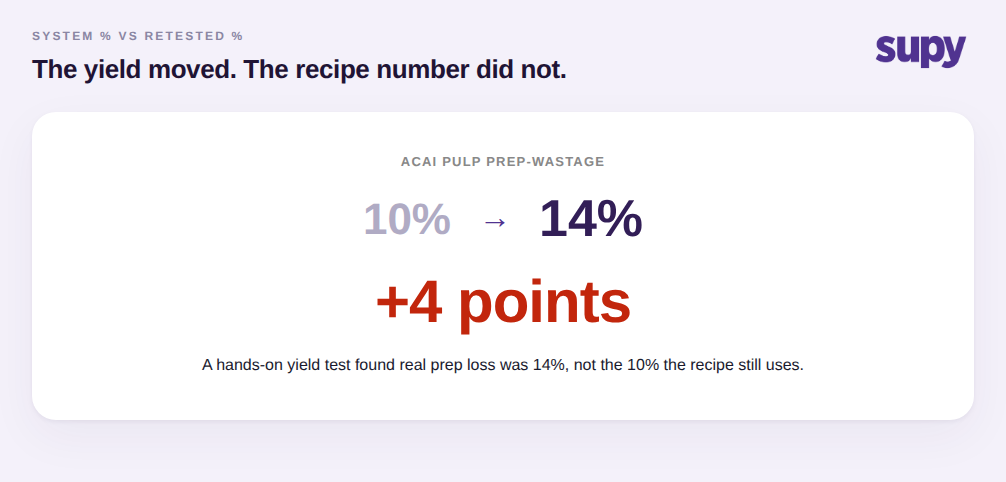
Voici le schéma qui revient sans cesse. Un responsable de préparation ou de cuisine centrale reteste à la main le rendement d'une pulpe d'acaï en pesant ce qui entre et ce qui sort, et constate que la perte réelle est plutôt de 14 %, et non les 10 % sur lesquels la recette était construite. C'est un écart de 4 points sur un seul article. Le retest est discuté, peut-être noté sur un tableau blanc, puis jamais saisi dans le système. La recette indique toujours 10 %. À partir de ce jour, la plateforme calcule la consommation théorique à partir d'un chiffre que l'opérateur sait déjà être erroné.
La même chose se produit chaque fois que les rendements définis dans les recettes diffèrent de l'output réel en production. Une recette indique qu'un kilogramme de protéine découpée donne dix portions ; la ligne n'en obtient réellement que neuf sur un mauvais lot. À moins que quelqu'un n'enregistre le rendement réel au point de production, la recette reste figée sur une spécification qui n'a jamais été validée par rapport à une vraie livraison.
Comment un seul pourcentage obsolète gonfle silencieusement l'écart dans tous les points de vente
Un seul pourcentage erroné serait une erreur d'arrondi s'il restait en un seul endroit. Ce n'est pas le cas. Les chiffres des recettes sont appliqués automatiquement sur les prises d'inventaire, l'enregistrement des pertes, la production et les transferts, de sorte que la consommation théorique est partout construite sur le même chiffre de recette sans que personne ne relance un calcul. Un pourcentage obsolète n'est donc pas une erreur locale. Il se répète à chaque prise d'inventaire, chaque cycle de production et chaque point de vente qui utilise cette recette.
C'est pourquoi le préjudice ressemble à ceci au terme d'une seule semaine dans un point de vente :
Chaque article de préparation dépasse sa consommation théorique
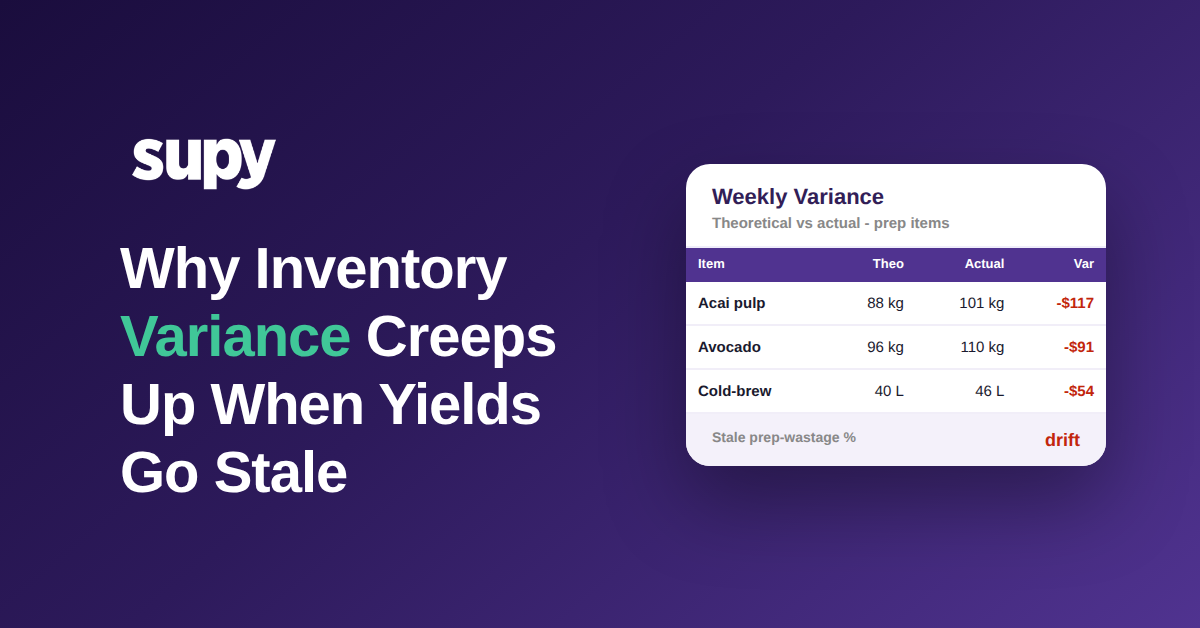
| Article | Théorique | Réel | Écart |
|---|---|---|---|
| Pulpe d'acaï | 88 kg | 101 kg | -13 kg / -$117 |
| Avocat | 96 kg | 110 kg | -14 kg / -$91 |
| Concentré cold-brew | 40 L | 46 L | -6 L / -$54 |
| Poulet, préparé | 64 kg | 69 kg | -5 kg / -$41 |
| Écart inexpliqué total | -$303 |
Chacun de ces articles sous-estime la consommation théorique parce que le pourcentage de perte est trop faible, si bien que l'épuisement réel dépasse ce que le système avait prévu et l'écart devient négatif. Prise individuellement, chaque ligne ressemble à du bruit. Ensemble, elles totalisent environ 303 $ d'écart inexpliqué en une seule semaine, sur quatre articles à forte préparation, dans un point de vente. Multipliez cela sur un groupe multi-sites et le petit pourcentage devient maintenant une fuite mensuelle récurrente qu'aucun comptage plus rigoureux ne comblera, parce que les prises d'inventaire ne sont pas le problème. C'est la base de référence qui l'est.
Distinguer la dérive de rendement du vol, du sur-portionnement et des erreurs de réception
Les rendements obsolètes survivent des mois parce qu'ils se cachent dans un chiffre d'écart qui a toujours trois ou quatre explications plausibles. Quand les opérateurs décomposent enfin un grand écart d'ingrédient par article et par cause, le tableau est généralement mixte plutôt qu'un seul coupable.

Les enquêtes sur les écarts ramènent systématiquement à trois causes récurrentes : des pourcentages de perte de préparation obsolètes qui n'ont jamais été mis à jour après les tests de rendement réels, un gaspillage opérationnel jamais enregistré, et des erreurs de réception ou de saisie de bons de livraison. Le sur-portionnement en ligne s'y ajoute. La démarche pratique consiste à cesser de traiter l'écart comme un seul chiffre et à l'attribuer par article et par cause, de la même façon qu'un responsable boissons décompose un écart élevé par catégorie pour distinguer le vol de la sur-distribution. Une fois que vous voyez qu'une grande partie de l'écart est de la dérive de rendement plutôt que du manque, vous savez que la solution est une modification de recette, pas une caméra de surveillance.
Retester les rendements et recalibrer le pourcentage
C'est la partie qui est véritablement sous votre contrôle, et c'est un workflow de recette, pas un workflow de comptage. La correction suit un ordre fixe :
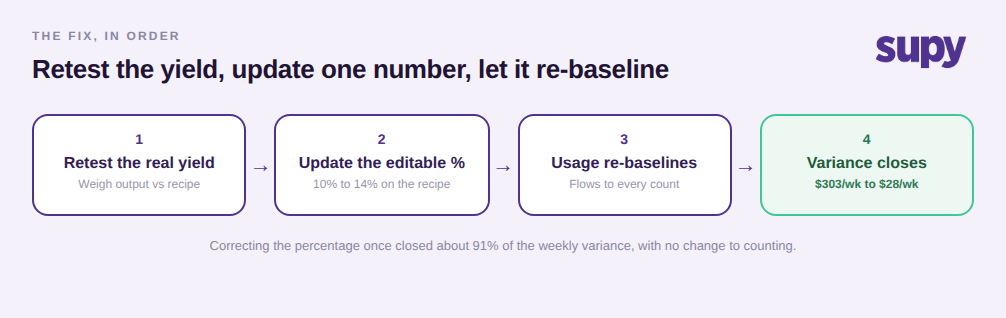
Premièrement, identifiez les articles qui génèrent l'écart : les ingrédients à forte valeur et à forte préparation où quelques points d'erreur de rendement se transforment en argent réel. Deuxièmement, effectuez un vrai test de rendement et enregistrez la quantité réellement produite au point de production, pas seulement la spécification théorique, afin de comparer l'output mesuré à la recette. Troisièmement, mettez à jour le pourcentage de perte ou de rendement modifiable sur la recette elle-même. Supy expose des pourcentages de rendement modifiables par recette dans la vue coût des recettes et préparations, avec le gaspillage calculé automatiquement à partir de ce que vous saisissez, de sorte que la correction est une modification directe plutôt qu'un contournement. Quatrièmement, laissez la consommation théorique se recalibrer d'elle-même ; comme les chiffres de recette se propagent automatiquement, corriger le pourcentage une seule fois se répercute sur chaque future prise d'inventaire, cycle de production et transfert qui l'utilise.
Une règle de sécurité à anticiper : Supy bloque les modifications des recettes déjà utilisées en production, ce qui protège vos données de coûts historiques d'une réécriture après coup. Cela signifie que vous recalibrez à partir de la correction pour l'avenir, pas rétroactivement, ce qui est exactement ce que vous voulez pour une piste d'audit propre. Dans l'exemple ci-dessus, ajuster les quatre articles à leurs pourcentages retestés a ramené l'écart hebdomadaire d'environ 303 $ à 28 $, en comblant environ 91 % sans un seul changement dans la façon dont l'équipe compte.
Cela se produit-il dans votre établissement ?
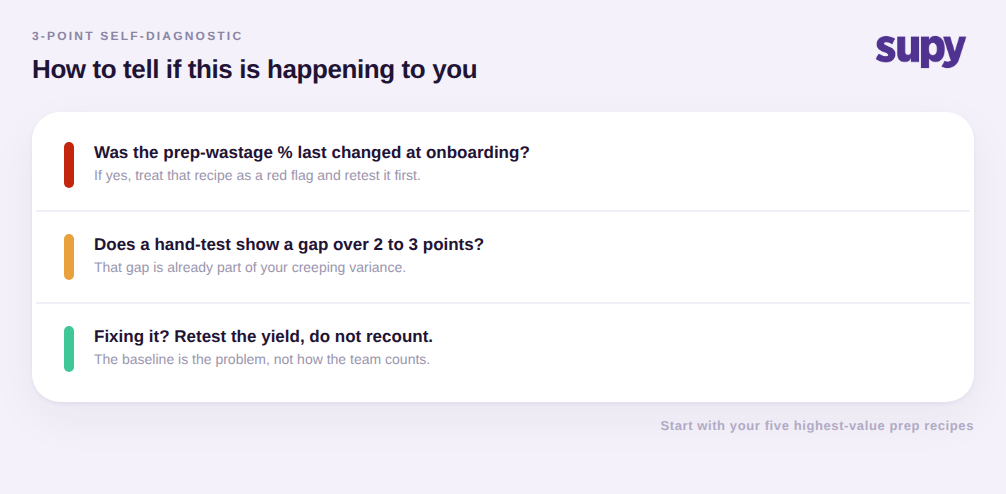
Vous n'avez pas besoin d'un projet pour le savoir. Effectuez un autodiagnostic rapide. Premièrement, tirez vos cinq recettes de préparation ou semi-finies les plus précieuses et vérifiez quand chaque pourcentage de perte a été modifié pour la dernière fois ; si la réponse est à l'onboarding, traitez-le comme un signal d'alarme. Deuxièmement, testez à la main le rendement du seul article présentant le pire écart cette semaine et comparez-le au chiffre de la recette. Troisièmement, si l'écart dépasse deux ou trois points, vous avez trouvé au moins une partie de votre écart rampant. Le premier pas n'est pas un comptage plus important ni un verrou plus strict sur la chambre froide. C'est retester les rendements auxquels vous faisiez confiance aveuglément et mettre à jour le seul chiffre qui pilote silencieusement chaque chiffre théorique que vous signalez.
Pour le contexte plus large sur la façon dont ces écarts s'accumulent, l'article pilier sur l'analyse de l'écart d'inventaire en restauration parcourt l'ensemble des causes, et la fonctionnalité coût des recettes et préparations est l'endroit où les pourcentages de rendement et de perte ci-dessus résident réellement.