.jpeg)


Veraltete Schwundprozentsätze: Warum Bestandsabweichungen zunehmen, wenn Rezeptrenditen nicht neu berechnet werden
Ihre Bestandsabweichung hat sich wochenlang in die falsche Richtung entwickelt. Offensichtlich hat sich nichts geändert: dieselben Lieferanten, dieselben Rezepte, dieselben Zählungen. Aber der theoretische Verbrauch und der tatsächliche Verbrauch weichen immer weiter auseinander, und jede Überprüfung endet mit demselben Achselzucken und einer vagen Notiz zu Schwund. Bevor Sie nach Diebstahl oder einem Warenannahmeproblem suchen, prüfen Sie die am wenigsten sichtbare Zahl im gesamten System: den Schwundprozentsatz, der in Ihren Rezepten steckt. Er wurde mit ziemlicher Sicherheit einmal während des Onboardings festgelegt und seitdem nicht mehr angetastet.
Diese eine Zahl entscheidet, was Ihre Plattform glaubt, dass Sie hätten verwenden sollen. Wenn sie aufhört, der Realität zu entsprechen, steigt Ihre Abweichung nicht auf eine Weise an, die jemand bemerkt. Sie schleicht sich ein, Artikel für Artikel, bis eine Quartalsüberprüfung eine Lücke aufdeckt, die niemand auf eine Ursache zurückführen kann.
Was ein Schwundprozentsatz bei der Vorbereitung tatsächlich in Ihren Zählungen steuert
Ein Schwundprozentsatz gibt den Anteil einer Rohzutat an, der beim Reinigen, Zuschneiden, Portionieren oder Kochen vor dem Eingang in ein Gericht verloren geht. Wenn ein Acai-Pulp-Rezept einen Schwundwert von 10 % enthält, geht das System davon aus, dass 10 % beim Vorbereiten verloren gehen und nur 90 % zu verwendbarem Output werden. Dieser eine Prozentsatz fließt in jede theoretische Verbrauchszahl ein, die die Plattform für diese Zutat berechnet.
Betrachten Sie ihn als Brücke zwischen dem, was Sie kaufen, und dem, was Ihre Rezepte sagen, dass Sie verwenden sollen. Wenn der Prozentsatz stimmt, verfolgt der theoretische Verbrauch das, was das Regal tatsächlich verlässt. Wenn er veraltet ist, erbt jede nachgelagerte Zahl den Fehler still und heimlich, weil nichts im Bericht einen Prozentsatz als veraltet kennzeichnet. Er rechnet einfach weiter, wie er es gelernt hat.

Warum sich Ihre realen Renditen verschieben, der Systemprozentsatz aber eingefroren bleibt
Renditen sind keine fixen Eigenschaften einer Zutat. Sie verändern sich mit dem Lieferantengrad, der Saisonalität, der Person, die die Vorbereitung durchführt, und den Geräten vor ihr. Die Zahl, die Sie beim Onboarding eingegeben haben, war an dem Tag, an dem Sie sie gemessen haben, korrekt und ist seitdem langsam falsch geworden.
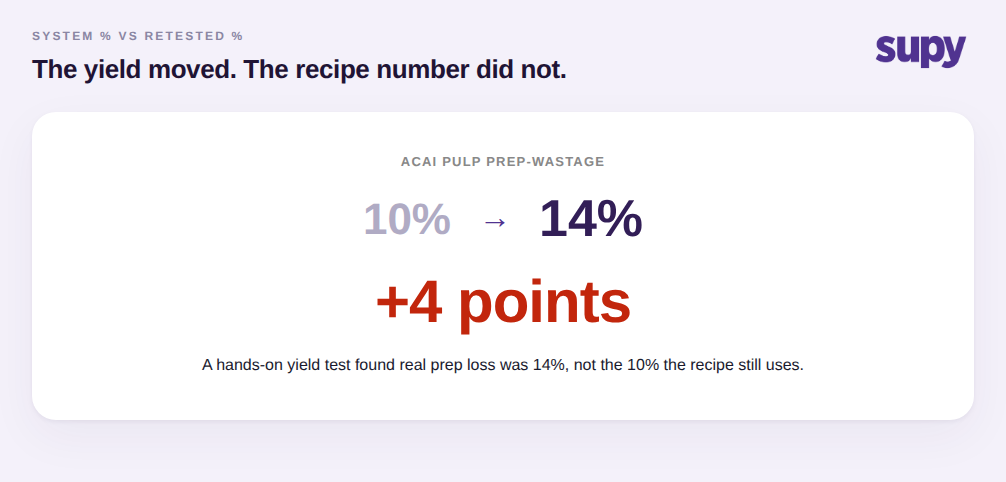
Hier ist das Muster, das immer wieder auftaucht. Ein Vorbereitungs- oder Zentralküchenleiter testet eine Acai-Pulp-Rendite von Hand nach, indem er wiegt, was hineingeht, und was herauskommt, und stellt fest, dass der echte Schwund eher bei 14 % liegt, nicht bei den 10 %, auf denen das Rezept aufgebaut wurde. Das ist eine 4-Punkte-Lücke bei einem einzelnen Artikel. Der Neutest wird besprochen, vielleicht auf ein Whiteboard geschrieben, und dann nie ins System eingetragen. Das Rezept steht immer noch auf 10 %. Von diesem Tag an berechnet die Plattform den theoretischen Verbrauch gegen eine Zahl, von der der Betreiber bereits weiß, dass sie falsch ist.
Dasselbe passiert immer dann, wenn sich rezeptdefinierte Renditen vom tatsächlichen Produktionsoutput unterscheiden. Ein Rezept besagt, dass ein Kilogramm zugeschnittenes Protein zehn Portionen ergibt; die Linie bekommt an einer schlechten Charge tatsächlich nur neun. Wenn niemand die tatsächliche Rendite am Punkt der Produktion erfasst, bleibt das Rezept auf einer Spezifikation fixiert, die nie anhand einer echten Lieferung validiert wurde.
Wie ein einziger veralteter Prozentsatz die Abweichung über alle Standorte hinweg unbemerkt aufbläst
Ein einzelner falscher Prozentsatz wäre ein Rundungsfehler, wenn er an einem Ort bliebe. Das tut er nicht. Rezeptzahlen werden automatisch auf Lagerbestandszählungen, Schwunderfassung, Produktion und Transfers angewendet, sodass der theoretische Verbrauch überall auf derselben Rezeptzahl basiert, ohne dass jemand eine Berechnung erneut auslöst. Ein veralteter Prozentsatz ist daher kein lokaler Fehler. Er wiederholt sich bei jeder Zählung, jedem Produktionslauf und jeder Filiale, die dieses Rezept verwendet.
Deshalb sieht der Schaden am Ende einer einzelnen Woche an einem Standort so aus:
Jeder Vorbereitungsartikel überschreitet seinen theoretischen Verbrauch
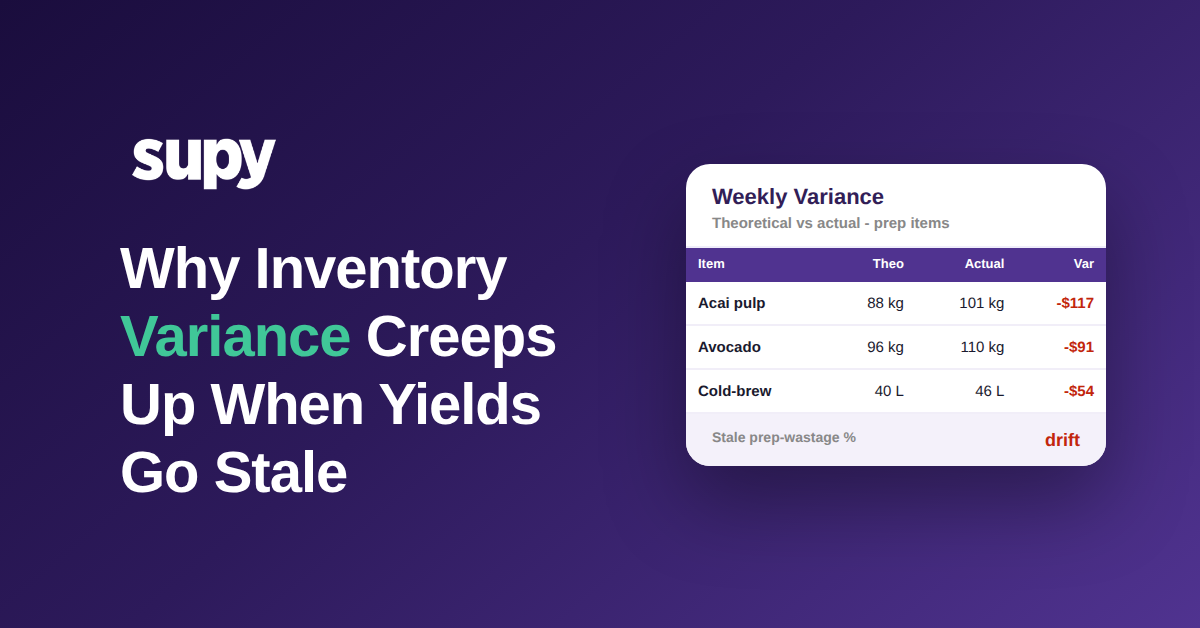
| Artikel | Theoretisch | Tatsächlich | Abweichung |
|---|---|---|---|
| Acai-Pulp | 88 kg | 101 kg | -13 kg / -$117 |
| Avocado | 96 kg | 110 kg | -14 kg / -$91 |
| Cold-Brew-Konzentrat | 40 L | 46 L | -6 L / -$54 |
| Hähnchen, vorbereitet | 64 kg | 69 kg | -5 kg / -$41 |
| Gesamte unerklärte Abweichung | -$303 |
Jeder dieser Artikel unterschätzt den theoretischen Verbrauch, weil der Schwundprozentsatz zu niedrig ist, sodass der tatsächliche Verbrauch über das hinausgeht, was das System vorhergesagt hat, und die Abweichung negativ ausfällt. Einzeln betrachtet sieht jede Zeile nach Rauschen aus. Zusammen summieren sie sich auf rund $303 unerklärter Abweichung in einer einzigen Woche bei vier vorbereitungsintensiven Artikeln an einem Standort. Multiplizieren Sie das auf eine Multi-Standort-Gruppe, und der kleine Prozentsatz ist jetzt ein wiederkehrender monatlicher Verlust, den kein noch so strenges Zählen schließen wird, weil die Zählungen nicht das Problem sind. Die Ausgangsbasis ist es.
Renditenverschiebung von Diebstahl, Überportionierung und Wareneinnahmefehlern trennen
Veraltete Renditen überleben monatelang, weil sie sich in einer Abweichungszahl verstecken, die immer drei oder vier plausible Erklärungen hat. Wenn Betreiber eine große Zutatensabweichung schließlich nach Artikel und Ursache aufschlüsseln, ist das Bild meist gemischt statt ein einzelner Schuldiger.

Abweichungsuntersuchungen führen konsistent auf drei wiederkehrende Ursachen zurück: veraltete Schwundprozentsätze, die nach echten Renditetests nie aktualisiert wurden, operativer Schwund, der nie erfasst wurde, und Wareneinnahme- oder Wareneingangsbelegeingabefehler. Überportionierung an der Linie steht daneben. Der praktische Schritt ist, aufzuhören, Abweichung als eine Zahl zu behandeln, und sie stattdessen nach Artikel und Ursache zuzuordnen, genauso wie ein Getränkeleiter eine hohe Abweichung nach Kategorie aufschlüsselt, um Diebstahl von Überschenken zu unterscheiden. Sobald Sie sehen können, dass ein großer Teil der Lücke auf Renditenverschiebung und nicht auf Schwund zurückzuführen ist, wissen Sie, dass die Lösung eine Rezeptänderung ist, keine Überwachungskamera.
Renditen neu testen und den Prozentsatz neu kalibrieren
Dies ist der Teil, der wirklich in Ihrer Kontrolle liegt, und es ist ein Rezept-Workflow, kein Zähl-Workflow. Die Lösung läuft in einer festen Reihenfolge ab:
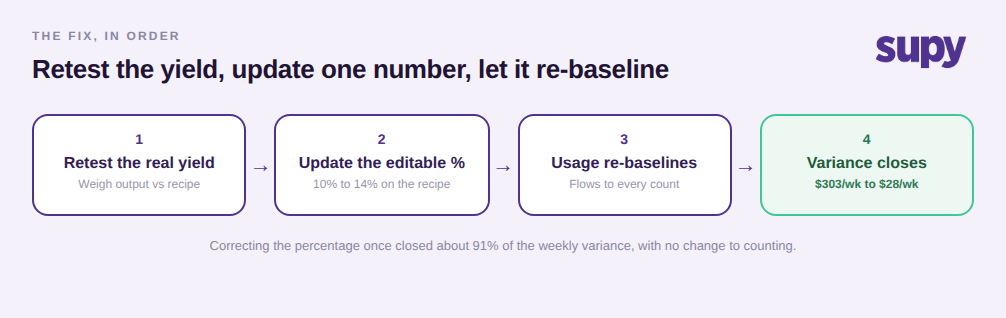
Erstens: Identifizieren Sie die Artikel, die die Abweichung antreiben – die hochwertigen, vorbereitungsintensiven Zutaten, bei denen wenige Renditepunkte Fehler in echtes Geld verwandeln. Zweitens: Führen Sie einen echten Renditest durch und erfassen Sie die tatsächlich produzierte Menge am Produktionspunkt, nicht nur die theoretische Spezifikation, damit Sie den gemessenen Output mit dem Rezept vergleichen. Drittens: Aktualisieren Sie den bearbeitbaren Schwundprozentsatz oder Rendite-Prozentsatz im Rezept selbst. Supy bietet bearbeitbare Rendite-Prozentsätze pro Rezept in der Rezept- und Vorbereitungskalkulation an, wobei Schwund automatisch aus Ihrer Eingabe berechnet wird, sodass die Korrektur eine direkte Bearbeitung ist, kein Workaround. Viertens: Lassen Sie den theoretischen Verbrauch von selbst neu kalibrieren; da Rezeptzahlen automatisch weitergegeben werden, fließt die Korrektur des Prozentsatzes einmalig in jede zukünftige Zählung, jeden Produktionslauf und jeden Transfer, der ihn verwendet.
Eine zu erwartende Sicherheitsbeschränkung: Supy blockiert Bearbeitungen an Rezepten, die bereits in der Produktion verwendet wurden, was Ihre historischen Kostendaten davor schützt, nachträglich umgeschrieben zu werden. Das bedeutet, dass Sie ab der Korrektur für die Zukunft neu kalibrieren, nicht rückwirkend – genau das, was Sie für einen sauberen Prüfpfad wollen. Im obigen Beispiel reduzierte das Anpassen der vier Artikel an ihre neu getesteten Prozentsätze die wöchentliche Abweichung von rund $303 auf $28 – etwa 91 % wurden geschlossen, ohne eine einzige Änderung daran, wie das Team zählt.
Passiert das in Ihrem Betrieb?
Sie brauchen kein Projekt, um das herauszufinden. Führen Sie eine schnelle Selbstdiagnose durch. Erstens: Holen Sie Ihre fünf hochwertigsten Vorbereitungs- oder Halbfertigrezepte hervor und prüfen Sie, wann jeder Schwundprozentsatz zuletzt geändert wurde; wenn die Antwort beim Onboarding war, behandeln Sie das als Warnsignal. Zweitens: Testen Sie die Rendite des einzelnen schlechtesten Abweichungsartikels dieser Woche von Hand und vergleichen Sie sie mit der Rezeptzahl. Drittens: Wenn die Lücke mehr als zwei oder drei Punkte beträgt, haben Sie zumindest einen Teil Ihrer schleichenden Abweichung gefunden. Der erste Schritt ist keine größere Zählung oder ein strengeres Schloss am Kühlraum. Es ist das erneute Testen der Renditen, denen Sie blind vertraut haben, und das Aktualisieren der einen Zahl, die still und heimlich jede theoretische Zahl antreibt, die Sie berichten.

Wenn Sie den weiteren Kontext dazu möchten, wie sich diese Lücken zusammensetzen, geht der Hauptartikel über Bestandsabweichungsanalyse im Restaurant die vollständige Ursachenliste durch, und die Rezept- und Vorbereitungskalkulation ist der Bereich, in dem die obigen Rendite- und Schwundprozentsätze tatsächlich hinterlegt sind.