Restaurant Cost of Sales: Work It Out From Usage, Not Purchases

Work out cost of sales from what the kitchen used
Work out restaurant cost of sales from what the kitchen used, not from what you bought: opening stock plus purchases minus closing stock. On $140,000 of sales, $49,000 of used stock is a cost of sales of 35%, a figure you can act on. This article shows how to run that sum, how often to count, and how to read it across sites.
The formula is one line. Opening stock plus purchases minus closing stock gives the stock the kitchen used. Divide that by sales for the period, and you have cost of sales as a percentage.

Run it on real figures. A site opens the month with $12,000 of stock, takes $48,000 of deliveries, and counts $11,000 left at the end. It used $49,000, which on $140,000 of sales is 35%.
The count at each end is what makes the figure real. Without a closing count you are guessing at what is left, so the figure you report no longer matches what the kitchen did. Cost of sales feeds straight into your food cost percentage, so a loose count moves both numbers at once.
Why purchase totals give you the wrong number
A cost of sales built from purchase totals moves with your buying, not with what the kitchen used.
One nine-site bakery group worked its figure out from the purchase totals in the accounts. The number then rose and fell with delivery timing. It never showed whether dishes were hitting the group's food-cost target.
A purchase-based figure goes wrong when your buying and the kitchen's usage fall in different months. Say the branch buys ahead for a promotion and takes $56,000 of deliveries while the kitchen still uses $49,000 of stock.
Read from purchases alone, cost of sales looks like 40% of sales. Worked from usage it is 35%.
The extra $7,000 did not go into dishes. It sat in closing stock, waiting to be used next month.
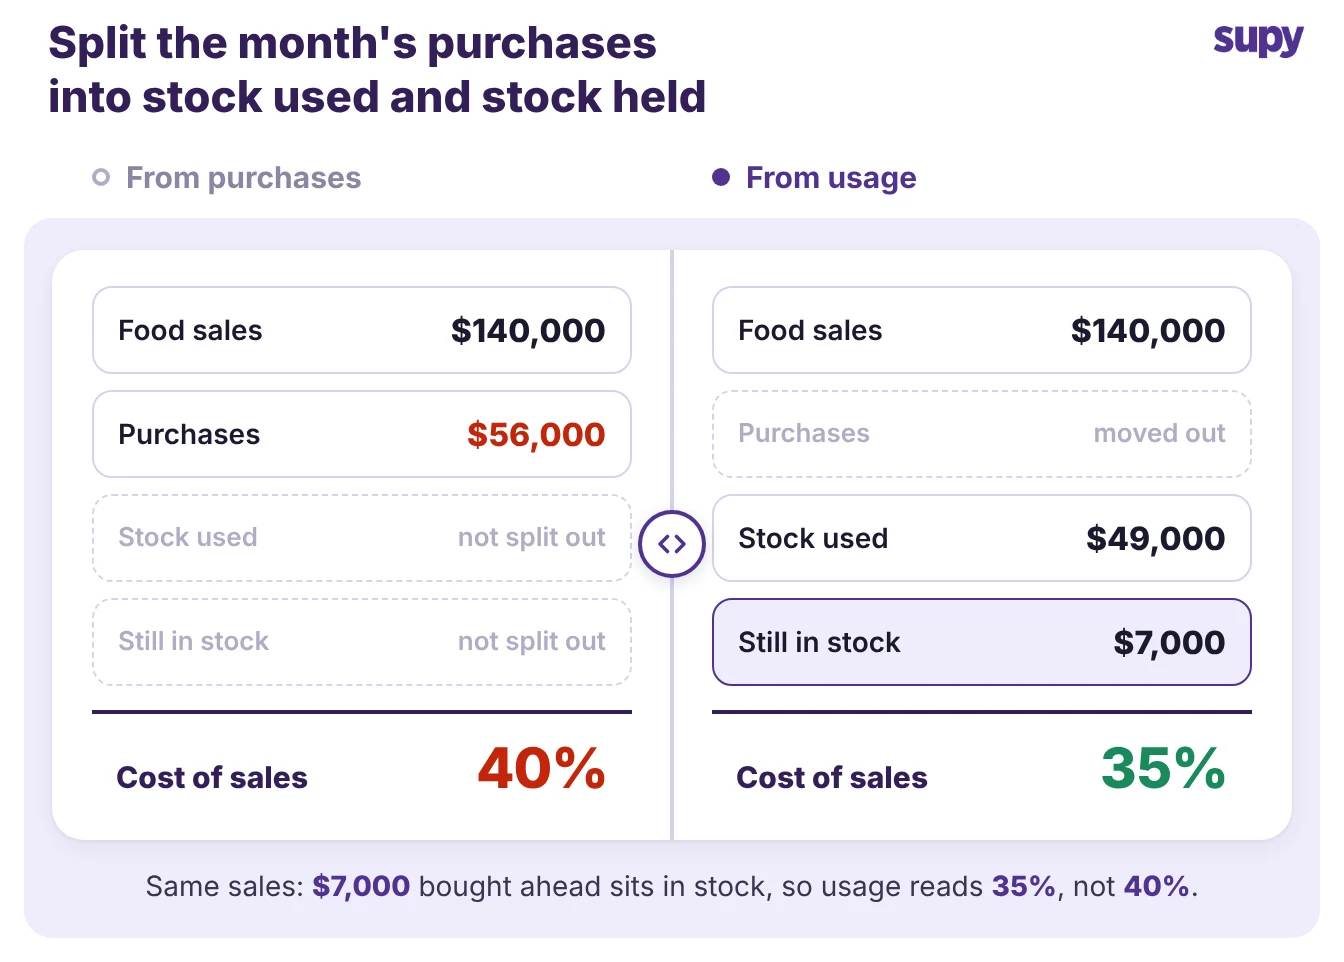
Working from usage catches that. It subtracts the $7,000 you are still holding, so the figure tracks what left the shelves, not what arrived at the door. A purchase-based number can only tell you what you spent that month, never whether the kitchen used it well.
How often to count so the number means something
The usage figure is only as good as the count behind it. Theoretical cost of sales, what your recipes say the kitchen should have used, is available every day.
The actual figure needs a stock count. The gap between counts is how long you wait to see a problem.
- Counting by hand. One operations lead counted every 15 days by hand. A monthly count showed a swing weeks after it had started, too late to act on.
- Counting more often. Count more often and the figure holds up. Businesses that count fewer than eight times a year have accurate stock records on only about a quarter of their count days, 24.5%, according to The Spread. Count more than weekly, 63 or more times a year, and records are about three times as accurate.
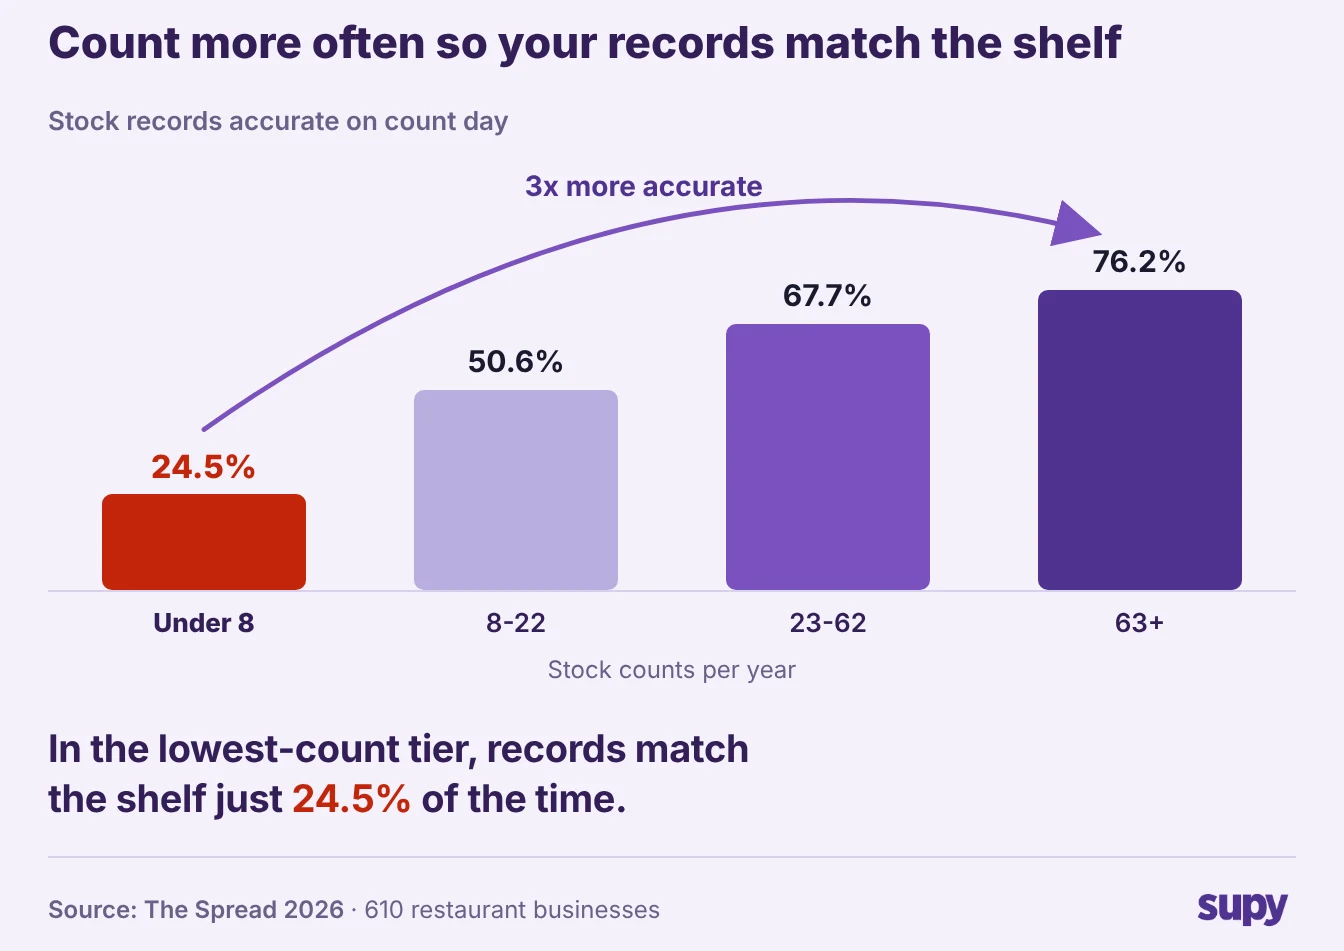
Weekly is the practical floor for a busy kitchen. It is frequent enough to catch a swing while it is happening. It also keeps each closing count close to the next opening count, so every cost of sales figure rests on a fresh number.
What a blended group figure hides
A single group figure hides the branches sitting above target, so you cannot tell which kitchen to check. Blend five sites into one cost of sales of 42% and you stop seeing the kitchen at 50% behind the one at 35%. Across one nine-site group the number ranged from 35% to 50%, yet the blended 42% looked healthy.
The difference between sites is worth real money. Take a branch turning over $180,000 a month. A 5 to 10 point swing in its cost of sales is $9,000 to $18,000 in one month. Nobody could say why. Read per site, you know which kitchen to walk into; read blended, you know only that something, somewhere, is off.

Supy's analytics reports cost of sales per site, per category and per dish, so a manager can see which branch to walk into. The group number still matters for the board, but the site number is the one you can act on this week.
Read actual cost of sales against what the recipes predict
Actual cost of sales tells you what the kitchen spent. It does not tell you whether that was right.
- Compare to theoretical. For that, set it against theoretical cost of sales, what your recipes say the kitchen should have used for the dishes it sold. The gap between the two is your variance, and its cause is where the money is.
- Line up items. Line the two up by item so you can see where the gap is.
| Item | Theoretical | Actual | Variance |
|---|---|---|---|
| Flour | $9,500 | $3,100 | -$6,400 |
| Cooking oil | $8,000 | $3,200 | -$4,800 |
| Sugar | $8,000 | $4,500 | -$3,500 |
| Total | $25,500 | $10,800 | -$14,700 |
A large gap is not a saving. Theoretical and actual sat $14,700 apart for one kitchen, $25,500 against $10,800. That means the recipes and the stock records were not describing the same thing.
Flour counted in bags against a recipe written in kilograms, a sub-recipe nobody mapped: fix the data first, then read the variance. Once the two line up, the variance you are left with is real, and you can trace it to waste, over-portioning or a supplier price you did not catch.
Where to start
Start with one branch and one month. Work cost of sales from opening stock plus purchases minus closing stock, divide by sales, and you have a figure like the 35% above. Set it against the target your group has chosen, not an industry average, and watch the trend.
Walk into the branch that sits two or three points above its own target two months running, before the next count. Count weekly so you catch that drift while you can still do something about it.

Supy reports live cost of sales and food-cost percentage at group, site and menu-category level. It shows theoretical against actual variance and wastage by type, site and item. The per-branch figure and its cause sit in front of you, without the Excel reconciliation.