.jpeg)

Modèle de gestion des stocks pour restaurants gratuit (Excel, Google Sheets, PDF)

Gérer un restaurant ou un bar rentable implique de savoir exactement ce que vous avez en stock - et ce que cela vous coûte - à tout moment. Pourtant, de nombreux restaurateurs s'appuient encore sur des feuilles papier ou des tableurs déconnectés qui ne permettent pas un suivi réel des stocks alimentaires ni une analyse précise des écarts d'inventaire.
Cela change aujourd'hui avec le Modèle d'inventaire gratuit pour restaurants de Supy, conçu spécifiquement pour la gestion des stocks en restauration. Il vous permet de :
- Suivre les stocks d'ouverture, les achats et les stocks de clôture
- Calculer automatiquement le coût des marchandises vendues (COGS)
- Identifier les écarts d'inventaire par catégorie
- Améliorer vos systèmes de contrôle du food cost
- Poser les bases pour les commandes prédictives et l'automatisation en restauration
Disponible en Excel et Google Sheets, ce système gratuit de contrôle des stocks vous offre un suivi structuré au niveau des ingrédients, sans investir dans un logiciel complet de gestion des stocks pour restaurants.
Téléchargez le modèle en remplissant le formulaire ci-dessous et, pour plus d'informations, consultez notre Blog sur le fonctionnement détaillé du modèle et son utilisation efficace.
Ce que contient le modèle : un système à 6 onglets conçu pour la restauration
.png)
Contrairement à une simple liste d'inventaire, ce modèle fonctionne comme un logiciel léger de gestion des opérations en restauration. Chaque onglet se connecte automatiquement - vous saisissez les données une seule fois et générez instantanément des tableaux de bord en temps réel.
Il comprend six onglets structurés, conçus spécifiquement pour la gestion en cuisine.
Onglet 1 - Mode d'emploi
Un guide pas à pas est intégré au modèle lui-même. Les nouveaux membres de l'équipe peuvent se former seuls, sans formation de votre part. Les cinq étapes vous accompagnent depuis la création de votre copie jusqu'à la lecture de votre rapport récapitulatif - tout est expliqué clairement, en langage simple.
Onglet 2 - Paramètres
Configurez le modèle une fois pour votre établissement :
- Nom du restaurant ou de l'établissement
- Dates de début et de fin de la période d'inventaire
- Description de la période (p. ex., « Janvier 2026 » ou « Semaine 4 »)
- Taux de TVA
- Marge brute cible (calcule automatiquement votre food cost cible en %)
- Symbole de devise (AED, $, £, €, etc.)
- Catégories cuisine - 8 emplacements personnalisables (Fruits de mer, Viandes & Volailles, Fruits & Légumes, Produits laitiers & Œufs, Boulangerie, Épicerie sèche & Conserves, Sauces & Condiments, Surgelés)
- Catégories bar - 7 emplacements personnalisables (Spiritueux & Liqueurs, Bière & Cidre, Vins & Champagne, Sodas & Mixers, Jus & Eau, Sirops & Amers, Bière – Pression)
Toutes les cellules jaunes sont des champs de saisie. Tout le reste se calcule automatiquement. Vous ne remplissez l’onglet Paramètres qu’une seule fois par établissement - tous les autres onglets s’y référencent.
Onglet 3 - Référentiel articles
Votre liste principale de tous les articles en stock. Ajoutez chaque article avec :
- Nom de l'article
- Catégorie (liée à vos Paramètres)
- Unité de mesure (UM) - p. ex., 1 kg, 750 ml, Pièce
- Prix unitaire
- Nom du fournisseur
- SKU / Code
- Notes
Le Référentiel articles est divisé en Articles cuisine et Articles bar. Une fois vos articles saisis, ils s’intègrent automatiquement dans les onglets de prise d’inventaire - sans copier-coller ni ressaisies.
Le modèle est livré avec plus de 50 articles d’exemple préchargés dans les catégories cuisine et bar, notamment protéines, produits frais, produits laitiers, spiritueux, vins, bières, boissons sans alcool et consommables de bar. Remplacez-les par vos propres articles en quelques minutes.
Onglet 4 - Prise d’inventaire cuisine
Votre feuille d’inventaire cuisine mensuelle (ou hebdomadaire). Les articles se remplissent automatiquement depuis le Référentiel articles. Vous n’avez qu’à renseigner trois colonnes :
- Qté d’ouverture - le stock disponible en début de période
- Qté achetée - ce que vous avez reçu/acheté durant la période
- Qté de clôture - le stock restant en fin de période
Tout le reste se calcule automatiquement :
- Valeur d’ouverture, Valeur des achats, Valeur de clôture - toutes calculées au coût unitaire
- COGS (Coût des marchandises vendues) - Valeur d’ouverture + Valeur des achats – Valeur de clôture
- Écart (Valeur) - la différence entre le stock de clôture attendu et le stock de clôture réel
- Écart % - exprimé en pourcentage de la valeur du stock d’ouverture
Les résultats sont regroupés par catégorie avec des sous-totaux, ce qui permet de voir facilement où se produisent vos pertes.
Onglet 5 - Prise d’inventaire bar
La même logique que l’inventaire cuisine - conçu spécifiquement pour votre bar. Les articles bar s’intègrent automatiquement depuis le Référentiel articles. Renseignez la Qté d’ouverture, les Achats et la Qté de clôture ; le reste se calcule.
Le bar est divisé en sept catégories : Spiritueux & Liqueurs, Bière & Cidre, Vins & Champagne, Sodas & Mixers, Jus & Eau, Sirops & Amers et Bière – Pression. Chaque catégorie dispose de sa propre ligne de sous-total.
Onglet 6 - Rapport récapitulatif
Votre vue d’ensemble de l’exploitation complète - Cuisine et Bar combinés - pour la période d’inventaire. Le Rapport récapitulatif affiche :
- Valeur d’ouverture, Valeur des achats, Valeur de clôture et COGS par catégorie
- % du COGS total par catégorie - pour identifier les zones les plus coûteuses
- Lignes Total cuisine et Total bar
- COGS total combiné (Cuisine + Bar)
Aucune agrégation manuelle. Aucun copier-coller de chiffres d’une feuille à l’autre. Le Rapport récapitulatif se met à jour dès que vous complétez vos onglets de prise d’inventaire.
Comment utiliser le modèle : 5 étapes pour votre première prise d’inventaire
Étape 1 : Créez votre copie
Dans Google Sheets, allez dans Fichier > Faire une copie. Dans Excel, enregistrez le fichier sous un nouveau nom pour votre établissement ou votre période d’inventaire. Ne modifiez jamais l’original - travaillez toujours à partir d’une copie.
Étape 2 : Configurez vos paramètres
Ouvrez l’onglet Paramètres et renseignez les cellules jaunes : le nom de votre restaurant, les dates de la période d’inventaire, le taux de TVA, la marge bénéficiaire cible et la devise. Personnalisez vos catégories cuisine et bar pour correspondre à l’organisation réelle de votre établissement.
Étape 3 : Construisez votre Référentiel articles
Remplacez les articles d’exemple préchargés par les vôtres. Ajoutez tous les articles que vous stockez - en cuisine et au bar - avec leur coût unitaire, leur UM, leur catégorie et leur fournisseur. Cette étape est la base. Plus votre Référentiel articles est précis, plus vos inventaires et votre COGS seront fiables.
Étape 4 : Effectuez votre prise d’inventaire
En fin de période, ouvrez l’onglet Prise d’inventaire cuisine. Pour chaque article, saisissez la Qté d’ouverture (ce que vous aviez au départ), les Achats (ce qui est entré) et la Qté de clôture (ce que vous avez physiquement compté). Répétez l’opération pour l’onglet Prise d’inventaire bar.
Étape 5 : Lisez votre Rapport récapitulatif
Ouvrez l’onglet Rapport récapitulatif. Votre COGS total, les coûts par catégorie et les performances combinées cuisine et bar sont calculés et prêts à être analysés. Comparez vos coûts réels de restauration avec votre marge cible - définie dans l’onglet Paramètres - et examinez les catégories présentant des écarts importants.
8 meilleures pratiques pour tirer le meilleur de votre modèle d’inventaire
Le modèle effectue les calculs - à vous d’apporter la rigueur. Voici les pratiques qui distinguent les restaurants qui maîtrisent leurs coûts de ceux qui se demandent où est passé l’argent.
1. Faites l’inventaire selon un calendrier fixe - et respectez-le
Que vous fassiez l’inventaire chaque semaine, toutes les deux semaines ou chaque mois, le calendrier importe plus que la fréquence. Les inventaires ponctuels produisent des données ponctuelles. Définissez une date d’inventaire récurrente - le dernier jour de chaque semaine ou le premier lundi de chaque mois - et considérez-la comme non négociable. Des intervalles d’inventaire réguliers rendent vos données d’écart significatives et comparables d’une période à l’autre.
2. Renseignez toujours les trois colonnes
La formule du COGS dépend de la Qté d’ouverture, des Achats et de la Qté de clôture. Laisser l’une de ces colonnes vide - ou l’estimer - fausse le calcul. Si vous ne connaissez pas vraiment un chiffre, c’est le signe qu’il faut améliorer votre processus de réception, pas sauter le champ. Apprenez à votre équipe qu’une cellule vide coûte autant qu’un frigo vide.
3. Utilisez le Référentiel articles comme votre unique source de vérité
Tous les articles que vous stockez doivent être dans le Référentiel articles avant de commencer l’inventaire - pas ajoutés en cours de comptage. Dès que vous commencez à compter des articles non répertoriés, vous créez des lacunes dans votre COGS. Constituez d’abord un Référentiel articles complet, comptez ensuite.
4. Séparez les inventaires cuisine et bar - et désignez des responsables
Le modèle est conçu avec des onglets séparés pour la cuisine et le bar pour une raison : ce sont des centres de coûts différents, gérés par des équipes différentes, avec des profils de pertes différents. Désignez une personne responsable de l’inventaire cuisine et une autre de l’inventaire bar. La responsabilité par zone produit des données bien plus précises qu’une seule personne essayant de tout compter.
5. Enregistrez les achats avec précision - pas approximativement
La colonne Achats représente tout ce qui est entré dans votre stock durant la période. Cela inclut chaque livraison, chaque transfert entrant d’un autre établissement ou d’une cuisine centrale, chaque achat d’urgence. Si vous ne capturez pas tous les achats, votre COGS sera sous-estimé et vos écarts sembleront artificiellement bons. Conservez vos bons de livraison et recoupez-les lorsque vous remplissez la colonne Achats.
6. Analysez les écarts - ne les acceptez pas simplement
L’écart représente la différence entre ce que votre stock devrait valoir (basé sur le stock d’ouverture + les achats – le COGS) et ce que vous avez réellement compté. Un écart positif suggère des mouvements de stock non enregistrés ou des erreurs de comptage. Un écart négatif - où le stock réel est inférieur aux prévisions - signale un vol, des pertes, un surportionnement ou des transferts non enregistrés. Utilisez les sous-totaux par catégorie dans le Rapport récapitulatif pour cibler les zones à examiner.
7. Mettez à jour votre Référentiel articles lorsque les coûts changent
Les coûts unitaires fluctuent. Lorsqu’un fournisseur augmente ses prix, mettez à jour le Prix unitaire dans le Référentiel articles immédiatement - pas en fin de mois. Un coût obsolète dans le Référentiel articles signifie que vos chiffres de COGS sont erronés, et les décisions prises sur des données de COGS incorrectes sont pires que l’absence de données.
8. Utilisez le modèle sur un appareil mobile pendant l’inventaire
Les feuilles d’inventaire papier introduisent des erreurs de transcription lors du transfert des valeurs vers le tableur. Ouvrez le modèle sur une tablette ou un téléphone pendant l’inventaire physique et saisissez directement les quantités. Cela élimine entièrement l’étape papier-écran et réduit considérablement les erreurs humaines.
Ressources associées
- Qu’est-ce que l’écart de food cost et comment le contrôler - supy.io/blog/what-is-food-cost-variance-and-how-to-control-it
- Comment calculer les pourcentages de food cost - supy.io/blog/how-to-calculate-restaurant-food-cost-percentage
- Gestion des stocks pour restaurants : les 8 conseils à connaître - supy.io/blog/restaurant-inventory-management-tips
- 10 conseils pour réduire les pertes alimentaires en restaurant - supy.io/blog/10-tips-to-reduce-restaurant-food-waste
- Les fonctionnalités à rechercher dans un logiciel de gestion des stocks pour restaurants - supy.io/blog/the-features-to-look-for-in-a-restaurant-inventory-management-software-in-2024
Prêt à dépasser les tableurs ?
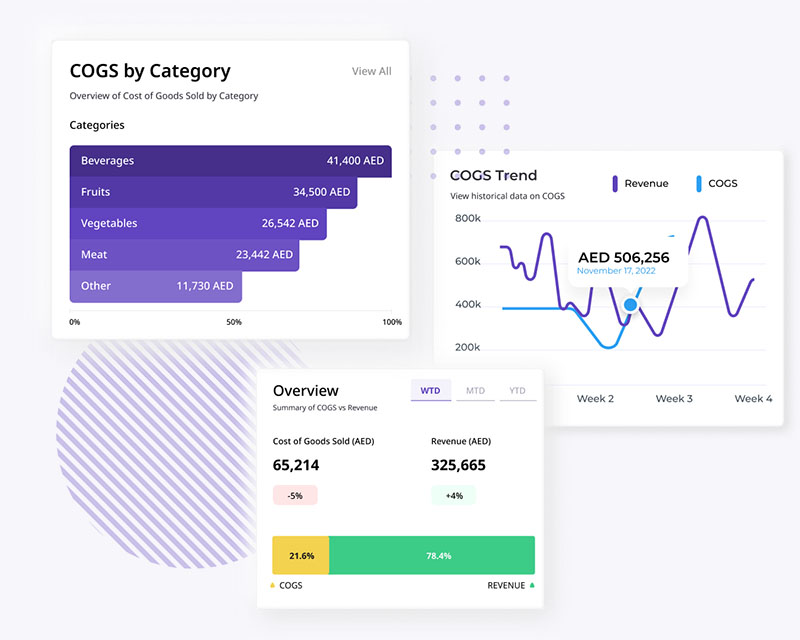
Ce modèle est conçu pour vous aider à faire des inventaires plus intelligents dès aujourd’hui. Lorsque vous serez prêt à automatiser votre COGS, connecter votre caisse et gérer vos achats sur plusieurs établissements, la plateforme de gestion des stocks Supy est l’étape suivante.
Réservez une démo sur supy.io/book-a-demo - et découvrez comment les principaux restaurateurs et exploitants de bars de la région réduisent leur food cost et éliminent le travail manuel.