.jpg)


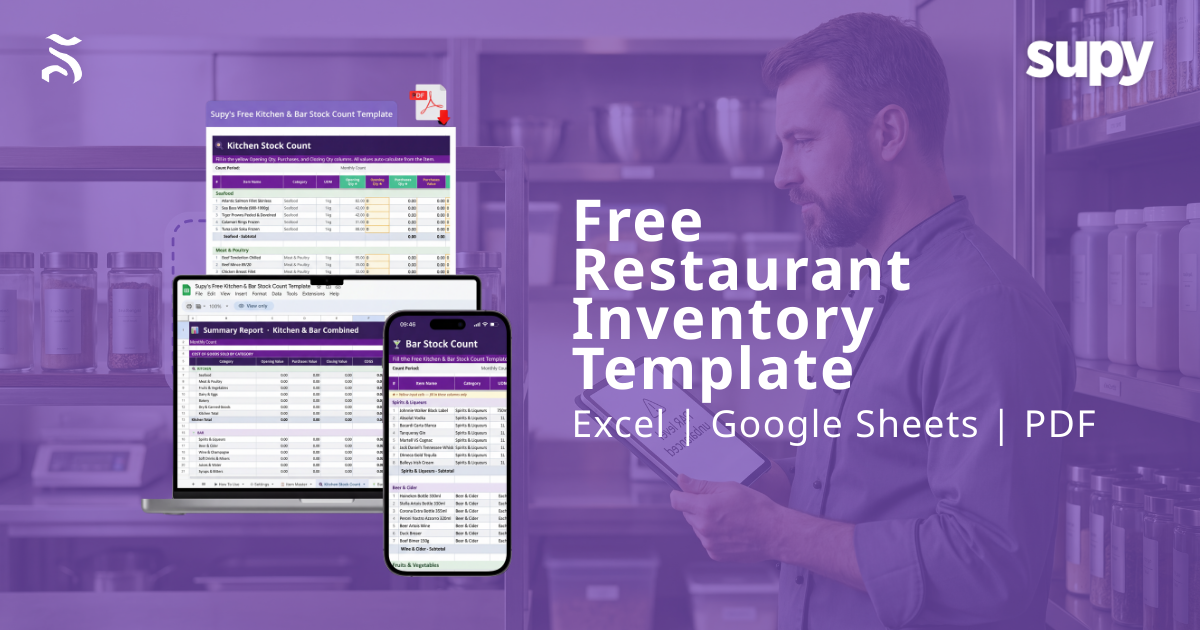
Free Restaurant Inventory Template (Excel, Google Sheets, PDF)
Running a profitable restaurant or bar means knowing exactly what you have in stock - and what it costs - at all times. Yet many operators still rely on paper sheets or disconnected spreadsheets that don’t support real food stock monitoring or accurate stock variance analysis.
That changes today with Supy’s Free Restaurant Inventory Template, designed specifically for restaurant inventory management. It helps you:
- Track opening, purchases, and closing stock
- Automatically calculate Cost of Goods Sold (COGS)
- Identify stock variance by category
- Improve food cost control systems
- Build the foundation for predictive ordering and restaurant automation
Available in Excel and Google Sheets, this free stock control system gives you structured, ingredient-level tracking without investing in full restaurant inventory management software.
Download by filling out the form below, and for more information, read our blog on exactly how the template works and how to use it effectively.
What's Inside the Template: A 6-Tab System Built for F&B Operations
.png)
Unlike a basic inventory list, this template functions like lightweight restaurant operations software. Each tab connects automatically - so you enter data once and generate real-time reporting dashboards instantly.
It includes six structured tabs built specifically for back-of-house software use.
Tab 1 - How To Use
A step-by-step walkthrough is built into the template itself. New team members can onboard themselves without any training from you. The five steps take you from creating your copy through to reading your Summary Report - everything is explained clearly in plain language.
Tab 2 - Settings
Configure the template once for your operation:
- Restaurant or outlet name
- Count period start and end dates
- Period description (e.g., 'January 2026' or 'Week 4')
- VAT/tax rate
- Target gross profit margin (auto-calculates your target food cost %)
- Currency symbol (AED, $, £, €, etc.)
- Kitchen categories - 8 customisable slots (Seafood, Meat & Poultry, Fruits & Vegetables, Dairy & Eggs, Bakery, Dry & Canned Goods, Sauces & Condiments, Frozen Items)
- Bar categories - 7 customisable slots (Spirits & Liqueurs, Beer & Cider, Wine & Champagne, Soft Drinks & Mixers, Juices & Water, Syrups & Bitters, Beer – Draught)
All yellow cells are input fields. Everything else calculates automatically. You only fill in the Settings tab once per location - every other tab references it.
Tab 3 - Item Master
Your master list of every item you stock. Add each item with:
- Item name
- Category (linked to your Settings)
- Unit of Measure (UOM) - e.g., 1 kg, 750ml, Each
- Unit Cost
- Supplier name
- SKU / Code
- Notes
The Item Master is split into Kitchen Items and Bar Items. Once you've added your items here, they flow automatically into the stock count tabs - no copy-pasting, no re-entry errors.
The template ships with 50+ pre-loaded example items across both kitchen and bar categories, including proteins, produce, dairy, spirits, wines, beers, soft drinks, and bar consumables. Replace them with your own items in minutes.
Tab 4 - Kitchen Stock Count
Your monthly (or weekly) kitchen count sheet. Items auto-populate from the Item Master. You only need to fill in three columns:
- Opening Qty - how much stock you had at the start of the period
- Purchases Qty - how much you received/purchased during the period
- Closing Qty - how much stock remains at the end of the period
Everything else calculates automatically:
- Opening Value, Purchases Value, Closing Value - all costed at unit cost
- COGS (Cost of Goods Sold) - Opening Value + Purchases Value – Closing Value
- Variance (Value) - the difference between the closing stock expected and the closing stock actual
- Variance % - expressed as a percentage of the opening stock value
Results are grouped by category with subtotals, making it easy to see exactly where your losses are occurring.
Tab 5 - Bar Stock Count
The same logic as the kitchen count - but purpose-built for your bar. Bar items flow in from the Item Master automatically. Fill in Opening Qty, Purchases, and Closing Qty; the rest calculates.
The bar is split into seven categories: Spirits & Liqueurs, Beer & Cider, Wine & Champagne, Soft Drinks & Mixers, Juices & Water, Syrups & Bitters, and Beer – Draught. Each category has its own subtotal row.
Tab 6 - Summary Report
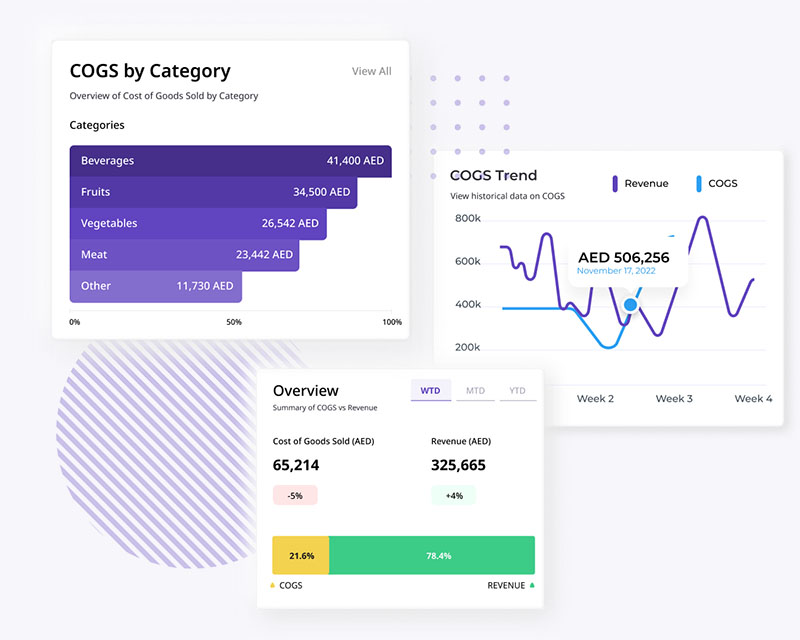
Your at-a-glance view of the full operation - Kitchen and Bar combined - for the count period. The Summary Report shows:
- Opening Value, Purchases Value, Closing Value, and COGS per category
- % of Total COGS per category - so you can see which areas drive the most cost
- Kitchen Total and Bar Total rows
- Combined Total COGS (Kitchen + Bar)
No manual aggregation. No copying and pasting numbers from one sheet to another. The Summary Report updates as soon as you complete your stock count tabs.
How to Use the Template: 5 Steps to Your First Count
Step 1: Create Your Copy
In Google Sheets, go to File > Make a copy. In Excel, save the file under a new name for your outlet or count period. Never edit the original - always work from a copy.
Step 2: Configure Your Settings
Open the Settings tab and fill in the yellow cells: your restaurant name, count period dates, VAT rate, target profit margin, and currency. Customise your kitchen and bar categories to match how your actual operation is organised.
Step 3: Build Your Item Master
Replace the pre-loaded example items with your own. Add every item you stock - in the kitchen and behind the bar - with its unit cost, UOM, category, and supplier. This step is the foundation. The more accurate your Item Master, the more accurate your counts and COGS will be.
Step 4: Run Your Stock Count
At the end of your count period, open the Kitchen Stock Count tab. For each item, enter the Opening Qty (what you had at the start), Purchases (what came in), and Closing Qty (what you physically counted). Repeat for the Bar Stock Count tab.
Step 5: Read Your Summary Report
Open the Summary Report tab. Your total COGS, cost by category, and combined kitchen and bar performance are all calculated and ready to analyse. Compare your actual food and beverage costs against your target margin - set in the Settings tab - and investigate any categories showing high variance.
8 Best Practices to Get the Most from Your Stock Count Template
The template does the calculation - you supply the discipline. Here are the practices that separate the restaurants that control their costs from the ones that wonder where the money went.
1. Count on a Fixed Schedule - and Stick to It
Whether you count weekly, bi-weekly, or monthly, the schedule matters more than the frequency. Ad hoc counts produce ad hoc data. Set a recurring count date - the last day of each week or the first Monday of each month - and treat it as non-negotiable. Consistent counting intervals make your variance data meaningful and comparable period over period.
2. Always Fill In All Three Columns
The COGS formula depends on Opening Qty, Purchases, and Closing Qty. Leaving any of these blank - or estimating them - breaks the calculation. If you genuinely don't know a figure, that's a signal to fix your receiving process, not to skip the field. Train your team that a blank cell is as costly as an empty fridge.
3. Use the Item Master as Your Single Source of Truth
Every item you stock should be in the Item Master before you start counting - not added mid-count. The moment you start counting items that aren't listed, you create gaps in your COGS. Build a comprehensive Item Master first, count second.
4. Separate Kitchen and Bar Counts - and Assign Ownership
The template is designed with separate tabs for kitchen and bar for a reason: these are different cost centres, driven by different teams, with different waste patterns. Assign one person to own the kitchen count and another to own the bar count. Accountability by area produces far more accurate data than a single person trying to count everything.
5. Record Purchases Accurately - Not Roughly
The Purchases column represents everything that entered your stock during the period. This means every delivery, every transfer in from another outlet or central kitchen, every emergency purchase. If you don't capture all purchases, your COGS will be understated and your variance will look artificially good. Keep your delivery notes and cross-reference them when filling in the Purchases column.
6. Investigate Variance - Don't Just Accept It
Variance is the gap between what your stock should be worth (based on opening stock + purchases – COGS) and what you actually counted. A positive variance suggests unrecorded stock movements or counting errors. A negative variance - where actual stock is lower than expected - signals theft, wastage, over-portioning, or unrecorded transfers. Use the category subtotals in the Summary Report to narrow down which area needs investigating.
7. Update Your Item Master When Costs Change
Unit costs fluctuate. When a supplier increases prices, update the Unit Cost in the Item Master immediately - not at the end of the month. An outdated cost in the Item Master means your COGS figures are wrong, and decisions made on wrong COGS data are worse than no data at all.
8. Use the Template on a Mobile Device During the Count
Paper count sheets introduce transcription errors when values are transferred to the spreadsheet. Open the template on a tablet or phone during the physical count and enter quantities directly. This eliminates the paper-to-screen step entirely and reduces human error significantly.
Related Resources
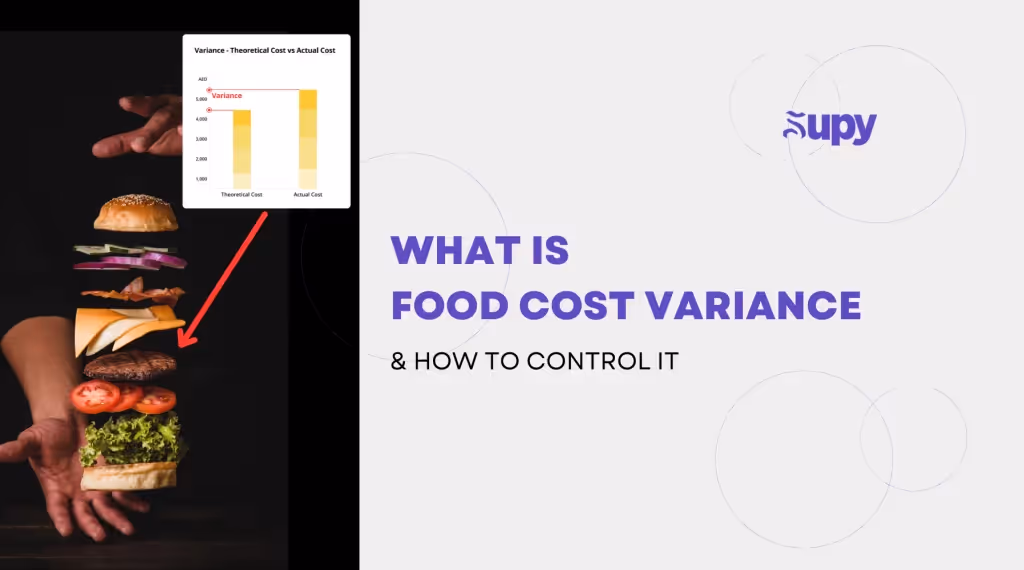
- What Is Food Cost Variance & How To Control It - supy.io/blog/what-is-food-cost-variance-and-how-to-control-it
- How To Calculate Food Cost Percentages - supy.io/blog/how-to-calculate-restaurant-food-cost-percentage
- Restaurant Inventory Management: The 8 Tips You Need To Know - supy.io/blog/restaurant-inventory-management-tips
- 10 Tips To Reduce Restaurant Food Waste - supy.io/blog/10-tips-to-reduce-restaurant-food-waste
- The Features To Look For In A Restaurant Inventory Management Software - supy.io/blog/the-features-to-look-for-in-a-restaurant-inventory-management-software-in-2024
Ready to Move Beyond Spreadsheets?
This template is built to help you count smarter today. When you're ready to automate COGS, connect your POS, and manage purchasing across multiple outlets, Supy's inventory management platform is the next step.
Book a demo at supy.io/book-a-demo - and see how leading restaurant and bar operators across the region are cutting food costs and eliminating manual work.