F&B Management Across Sites: Control Cost, Stock and Supplier Spend
What F&B management covers when you run several sites
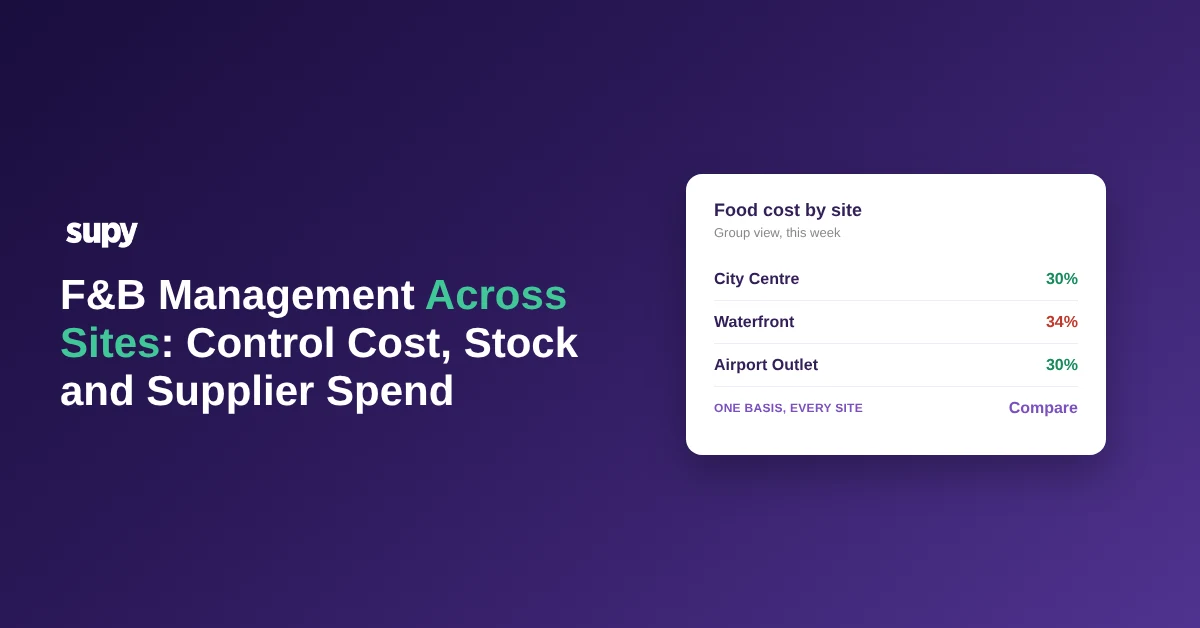
F&B management keeps food and beverage cost, stock and supplier spend under control across every site a group runs. One site can hold all of it in a spreadsheet. A group of 12 sites cannot, because each site counts stock, prices suppliers and reports margin its own way, so the numbers never line up. The job across a group is to make the sites comparable, not just to run each one well. This article shows what the discipline has to control, where it breaks, and what to standardise first.
Across a group, F&B management comes down to four things you have to keep straight at the same time:
- Stock and counts. Every site counts the same items the same way, on the same cadence, so on-hand stock and usage mean the same thing from one site to the next.
- Procurement and supplier prices. Sites buy from shared and local suppliers, and someone has to see the price each site actually pays per ingredient, not just what the catalogue says.
- Recipe and beverage costing. Each dish and each drink has a cost built from current ingredient prices, so a plate that stops making money shows up before month end.
- Margin and cost of goods sold (COGS) reporting. The group needs food cost percentage and variance per site, per menu category and per outlet, on numbers that were gathered the same way everywhere.
Run those four well at one site and you have a tidy restaurant. Run them the same way at every site and you have a group you can actually manage, because you can compare one site against another and act on the gap.
The rest of this article works through where the four areas break across sites, and how a group pulls them back into one picture.
Why each site counts stock and prices suppliers its own way
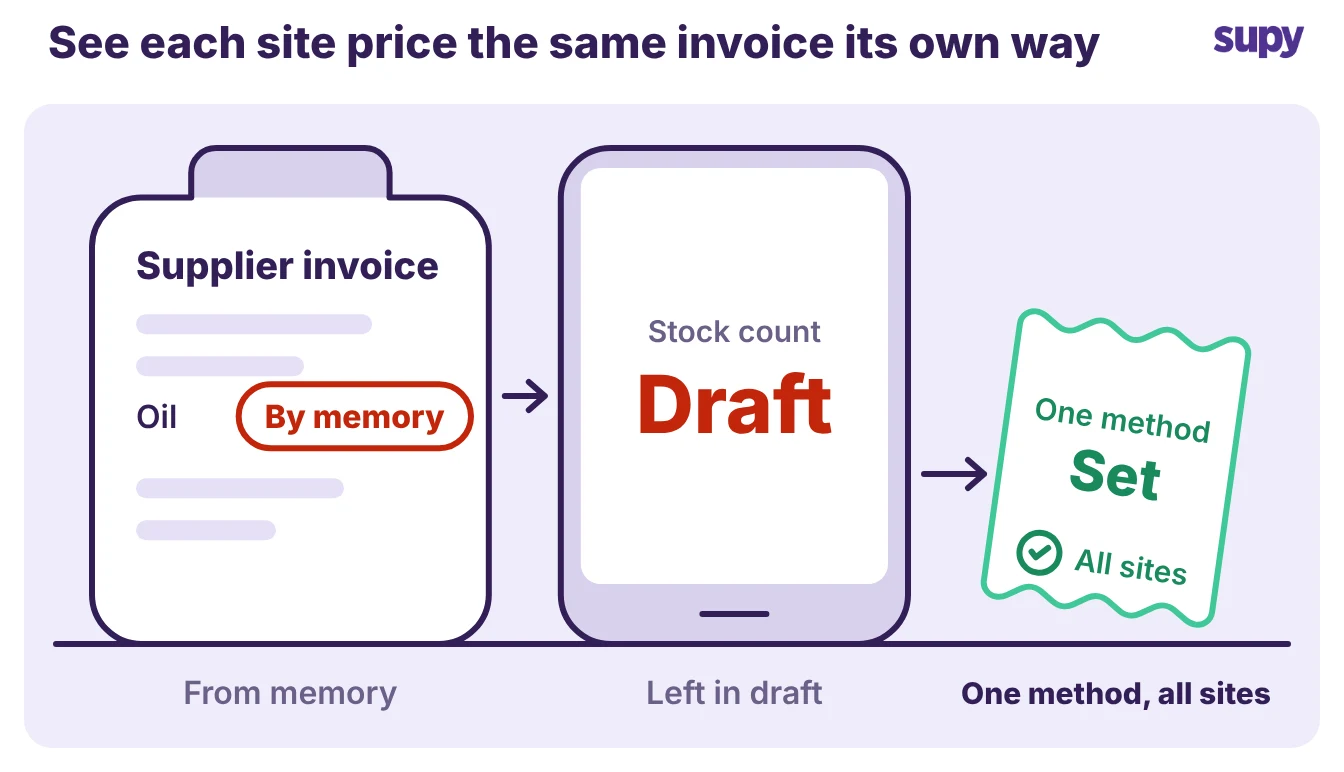
Each site does the work its own way because nobody made the sites do it the same way. One site counts on a Sunday night, another mid-week. One manager prices the supplier invoice against last month, another against a number in their head.
In many groups procurement is not even run centrally. One casual dining group had supplier and purchasing decisions sitting with a separate sister company, so head office could not see the price any single site paid.
- Mismatched costs. The result is that the same ingredient carries a different cost at each site, and the group number is an average of things that were never measured the same way. A finance lead at one mid-market quick-service group kept the whole group's COGS and forecasting in a manual spreadsheet model. One overloaded analyst maintained it by hand, so every top-line figure was fragile and slow to produce.
- Ordering by feel. Ordering has the same problem. Each site decides how much to hold and when to reorder on feel, so one site runs out while another sits on stock it will throw away. Setting a par level per item per site, the amount to keep on hand so you reorder to a known number, is what makes ordering repeatable instead of a guess.
If you'd rather not work par out by hand, the free par level calculator does it for every item on your sheet from your usage, delivery days and supplier lead times.
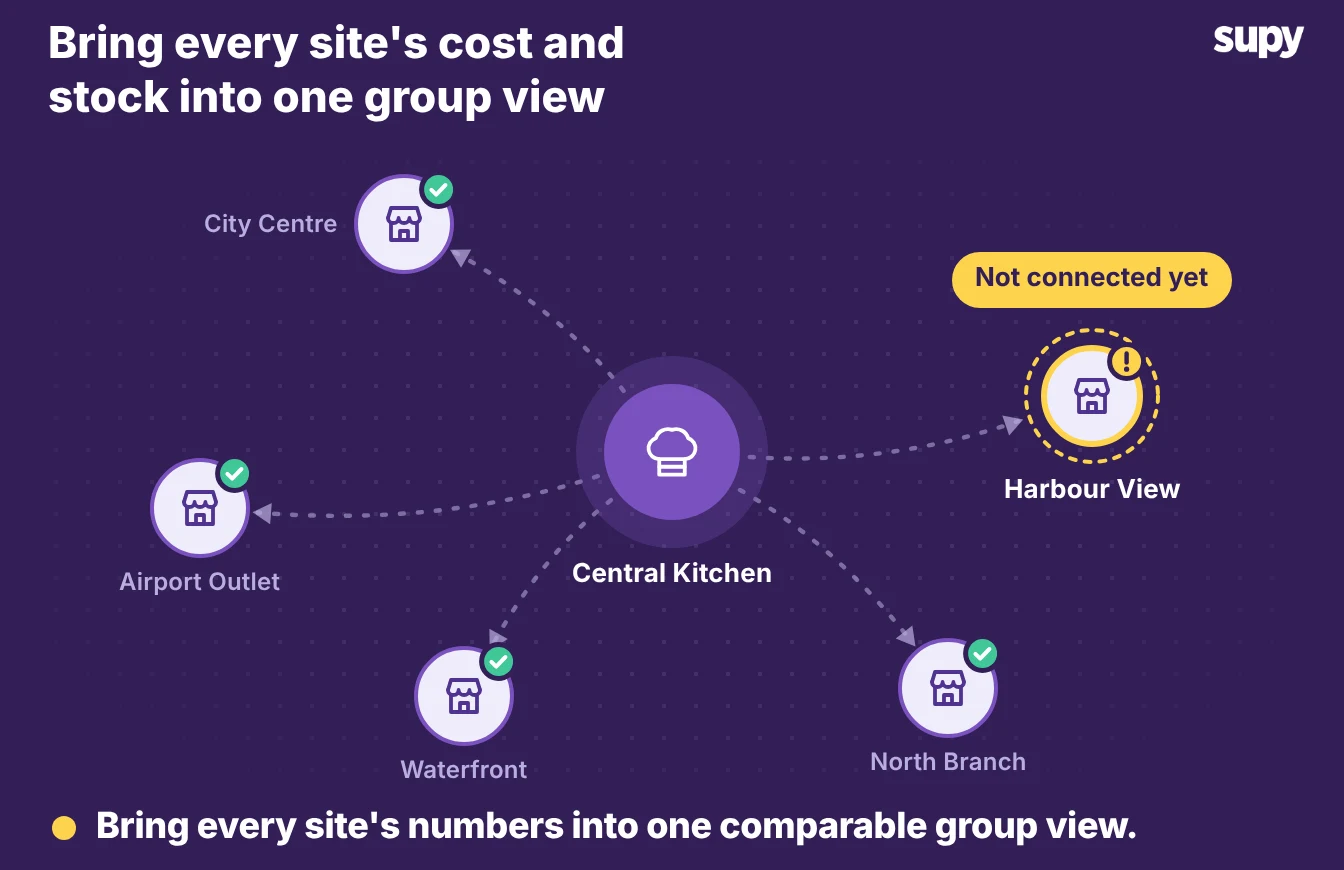
When a new outlet opens, the drift repeats unless the group hands it a standard to copy. Operators ask for exactly this. Give the new branch the same cost-centre structure, item list and counts as an existing site, so it reports in the same shape from day one.
Where margin leaks between the point of sale and the real cost
Reported margin and real margin come apart in a few predictable places, and across a group each gap is multiplied by the number of sites.
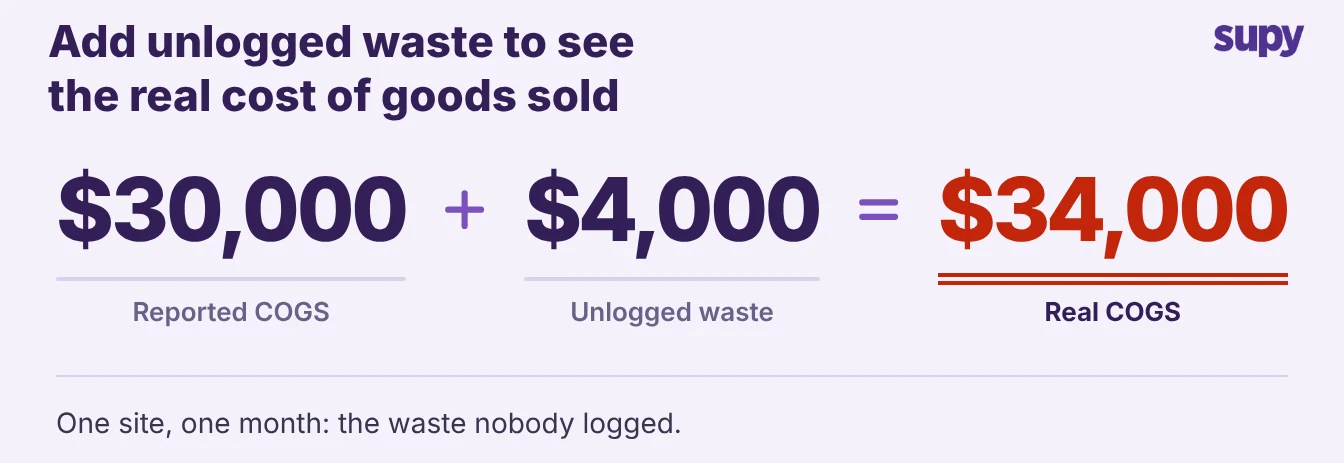
- Wastage that never gets recorded. When a site does not log its waste, that wastage counts as zero, so the report shows a lower food cost than the site really runs. A site can report a 30% food cost while the real figure is 34% once the unlogged waste is counted, and nobody questions it because the report looks clean.
- Delivery-platform orders that the point of sale (POS) rings at full price. A discounted delivery order shows up in the POS at the full menu price, but the operator keeps roughly 80% of it after the platform takes about 20% in fees. Depletion and sales both look right, yet the margin on those covers is lower than the report says, and the busier the delivery channel the wider the gap.
- Theoretical versus actual variance that no one chases. A 3% gap between what a site should have used and what it actually used is normal to see and expensive to ignore. On its own it is a line on a report. Across a group it is the difference between sites that count and price properly and sites that do not. It only means something when every site measures it the same way.
None of these is exotic. They are the everyday reasons a group's margin on paper is not the margin in the bank, and they all trace back to sites measuring cost in their own way.
One comparable cost and margin picture across sites
The fix is not more spreadsheets, it is one place where every site records cost the same way and the group reads it together. That is what closes the gap between the four control areas above and a number you can trust.
Supy gives a group one place where every site records cost the same way:
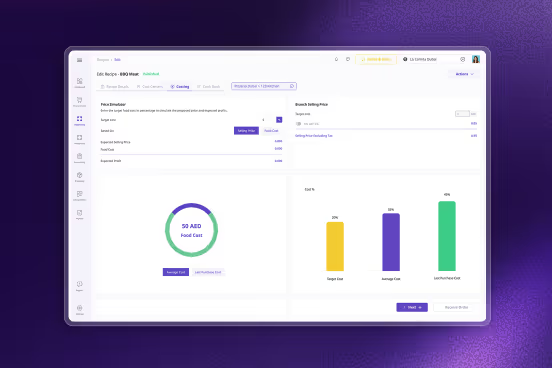
- Live food cost and variance. Food cost percentage and COGS show at group, site and menu-category level, with theoretical-versus-actual variance and wastage by site and item. The manager compares the sites on those figures and chases the worst one.
- Recipe costs linked to the POS. Recipe and prep-recipe costs link to the POS menu items, so a sale depletes the right ingredients and a costly dish shows up before month end.
- Wastage in the cost figure. Wastage is logged in seconds and deducts from stock, so the food cost figure includes the waste instead of hiding it.
- Reports without a hand-built model. One-click spreadsheet reports cover procurement, sales, COGS and recipe costing across the group, so finance stops rebuilding the model by hand.
- Central kitchen transfers that carry cost. A central kitchen can order on behalf of branches and bill them, so transfers between sites carry their cost instead of disappearing.
- Data that flows in. Supy connects to 75+ POS and accounting systems, so sales and cost data flow in without re-keying, and the demand forecast looks 14 days ahead.
The table below shows what changes when the four control areas move off per-site spreadsheets and into one system every site shares.
| Control area | Per site, in spreadsheets | One system across sites |
|---|---|---|
| Stock counts | Each site counts its own way and cadence | Same items, same method, same cadence everywhere |
| Supplier prices | Priced by feel, invoice by invoice | Actual price per ingredient per site, visible to head office |
| Recipe and beverage costing | Rebuilt by hand, stale between updates | Live cost per dish and drink, linked to the POS |
| Margin and COGS reporting | An average of numbers gathered differently | Food cost and variance per site on one basis |
You do not move all four at once. Standardise in the order that makes the next step possible:
- The item master first. Agree one list of ingredients and units that every site uses, because counts, prices and recipe costs all sit on top of it. If two sites call the same product by two names, nothing above lines up.
- The count cadence next. Set one count day and method for every site, so on-hand stock and usage mean the same thing group-wide.
- The cost-centre structure. Give every site, and every new outlet, the same cost-centre shape, so reports compare like with like from day one.
- One reporting cadence last. Read food cost percentage and variance per site on the same schedule, so a drifting site shows up in days, not at month end.
Here is the quick self-diagnostic: can you, today, put this week's food cost percentage for every site next to each other on one basis and trust the comparison? If you cannot, the gap is not effort at each site, it is that the sites were never made to measure the same way. Fix the item master first, then the counts, and the rest of the picture starts to line up. To see it on your own numbers, you can explore Supy's restaurant analytics software or read how groups bring food cost under control across sites.