Actual vs Theoretical Food Cost: Find the Ingredient That Moved It
What the Gap Between Theoretical and Actual Food Cost Is Telling You
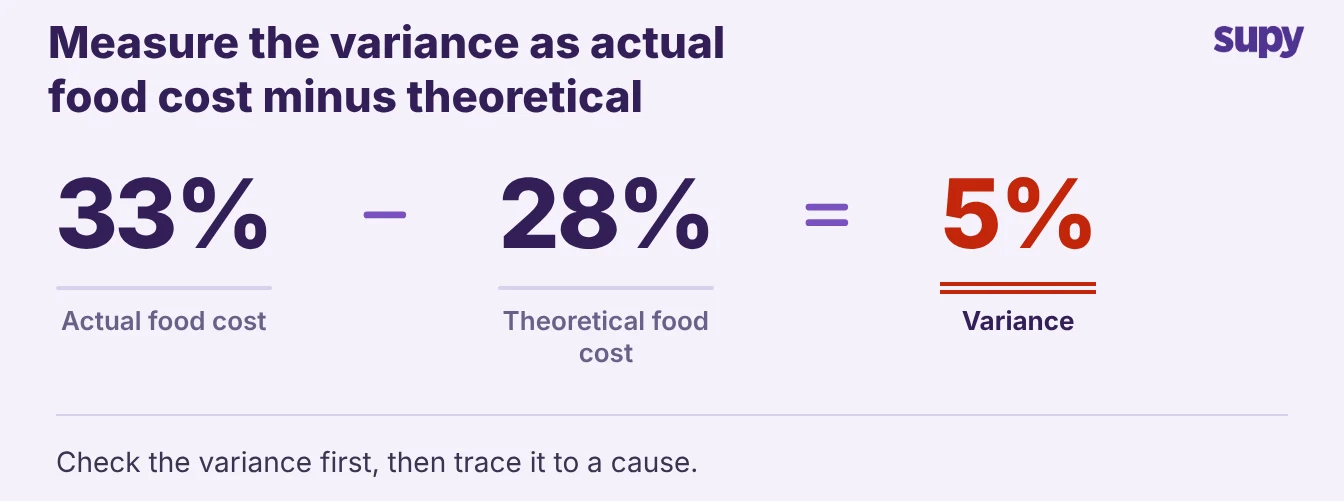
Actual versus theoretical food cost variance is the difference between what your recipes say a dish should cost and what you actually spent to make it. A couple of points is normal; a group at 33% against a theoretical 28% has 5 points to explain. When the variance is bigger than that, the cause is usually a supplier price change, an ingredient swap, or a yield or wastage problem. This article shows how to trace a live variance to the one ingredient or event that moved it, and which site drove it.
Most teams see the variance and stop at the headline number. A cost controller rebuilds the actual-versus-theoretical sum in a spreadsheet every period, confirms the group is running 33% against a theoretical 28%, and still cannot say what caused the 5 points. Knowing the number without the cause gives you nothing to act on.
- Question, not verdict. So treat the variance as a question, not a verdict. The number is an average of every dish, every site and every week stacked together, and the cause is hidden inside it. The work is to pull the variance apart until it points at one ingredient or one event you can fix.
- Live breakdown. Supy's dashboards show live food cost percentage and theoretical-versus-actual variance by group, site and menu category. You start from the real breakdown, not a blended figure in a spreadsheet. You can see the same split in Supy's restaurant analytics reporting.
Split a Blended Multi-Site Number Before You Chase It
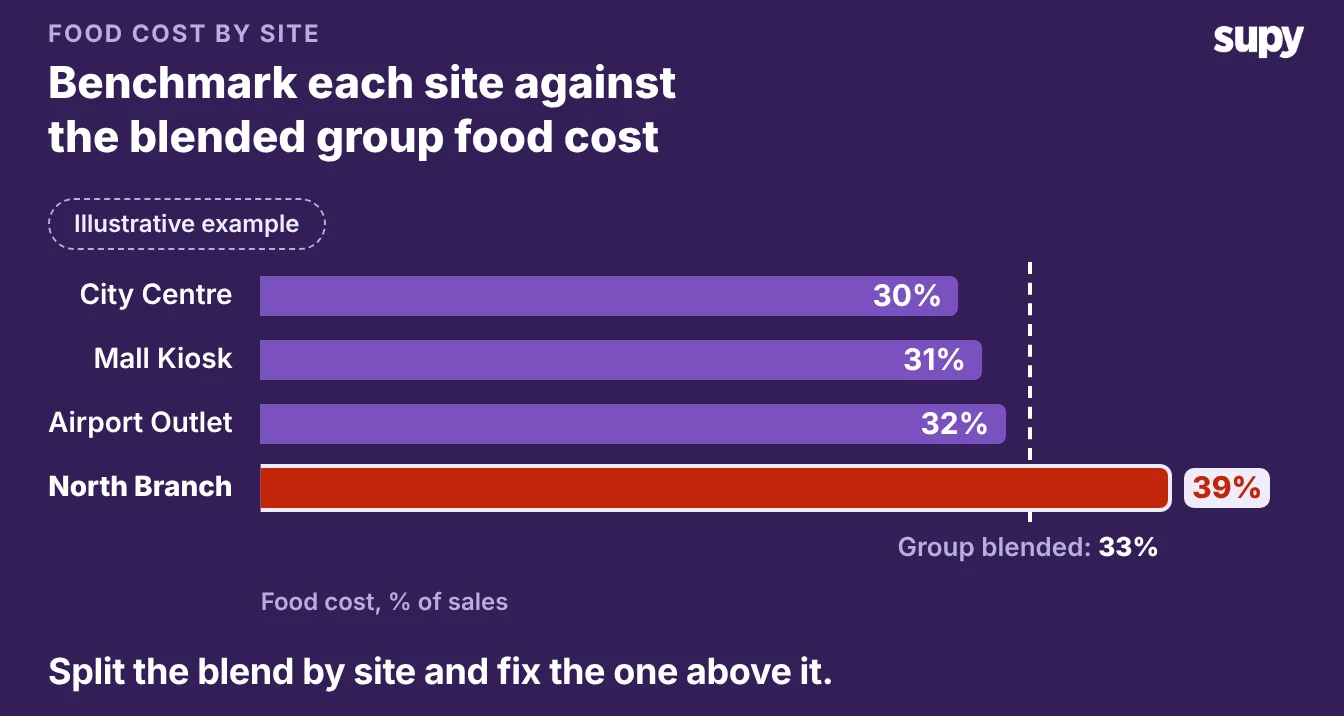
A group variance is an average, and an average hides the site that caused it.
- Split by site. Before you touch a single recipe, split the variance by location.
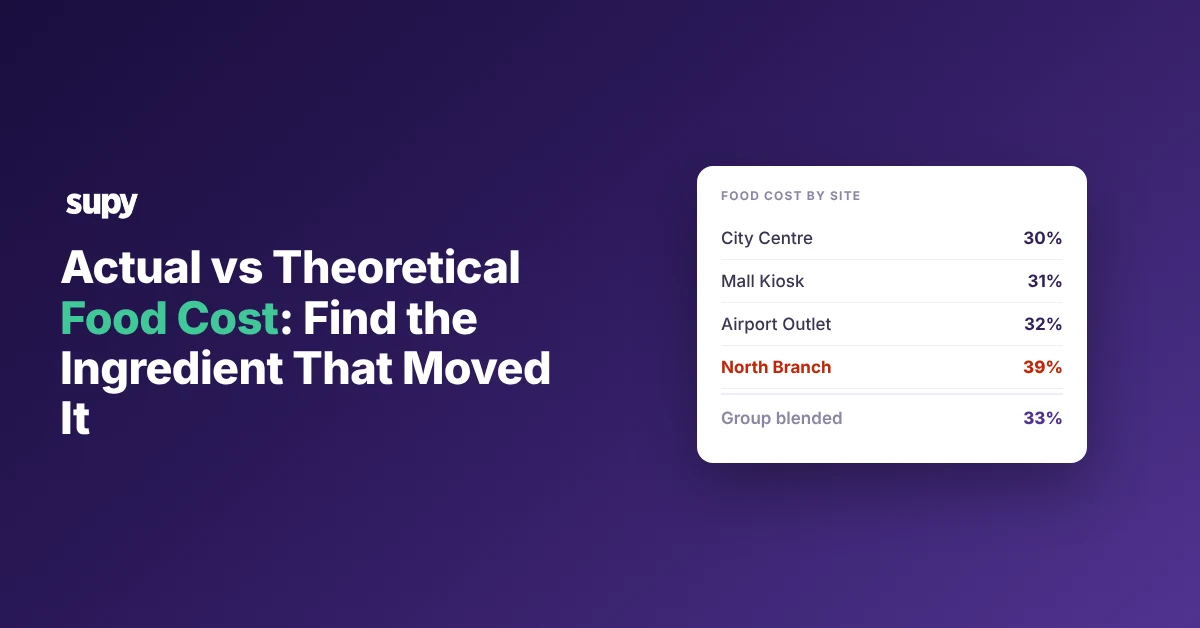
- Find the outlier. Say the group runs 33% food cost against a theoretical 28%, a 5 point gap. Pull it apart by site and three sites sit between 30 and 32% while one runs at 39%. The group number told you to fix everything; the split tells you to fix the one site at 39%.
This is the first fork in the tree, and it saves you from reworking recipes that were never the problem:
- One site is far worse than the rest. The cause is local: that site's supplier prices, that site's substitutions, or that site's counts. Work the branches below against that site only.
- Every site is over by about the same amount. The cause is shared: a group-wide recipe, a supplier that delivers to all of them, or a costing method that is wrong everywhere.
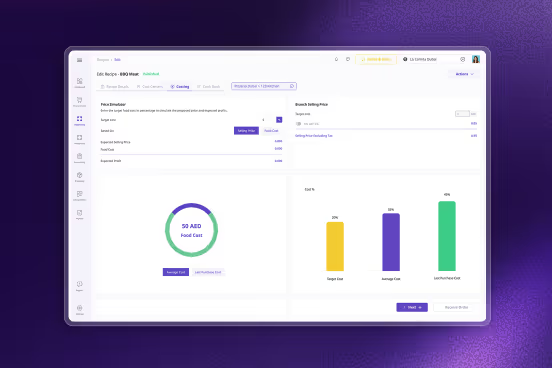
Supy lets you view recipe cost per location in two modes, average cost over time or the most recent purchase price, so you can see how each site's own supplier pricing moves its food cost.
The site that looks worst on most-recent price but normal on average cost has taken a recent price hit, which points you straight at the next branch.
Branch One: A Supplier Price Moved Under the Recipe
Start here, because it is the most common cause and the easiest to confirm. A supplier raises a price.
- The cost shifts. Every recipe that uses that ingredient costs more from the next delivery, while your theoretical cost still shows the old price until someone updates it. The dishes did not change. The cost of making them did.
- Look for clusters. The tell is that the variance clusters in dishes that share an ingredient. If a case of frying oil moved from $28 to $34, a 21% rise, then your fried items cost more while everything else stays the same. You are looking for that pattern, not a flat rise across the menu.
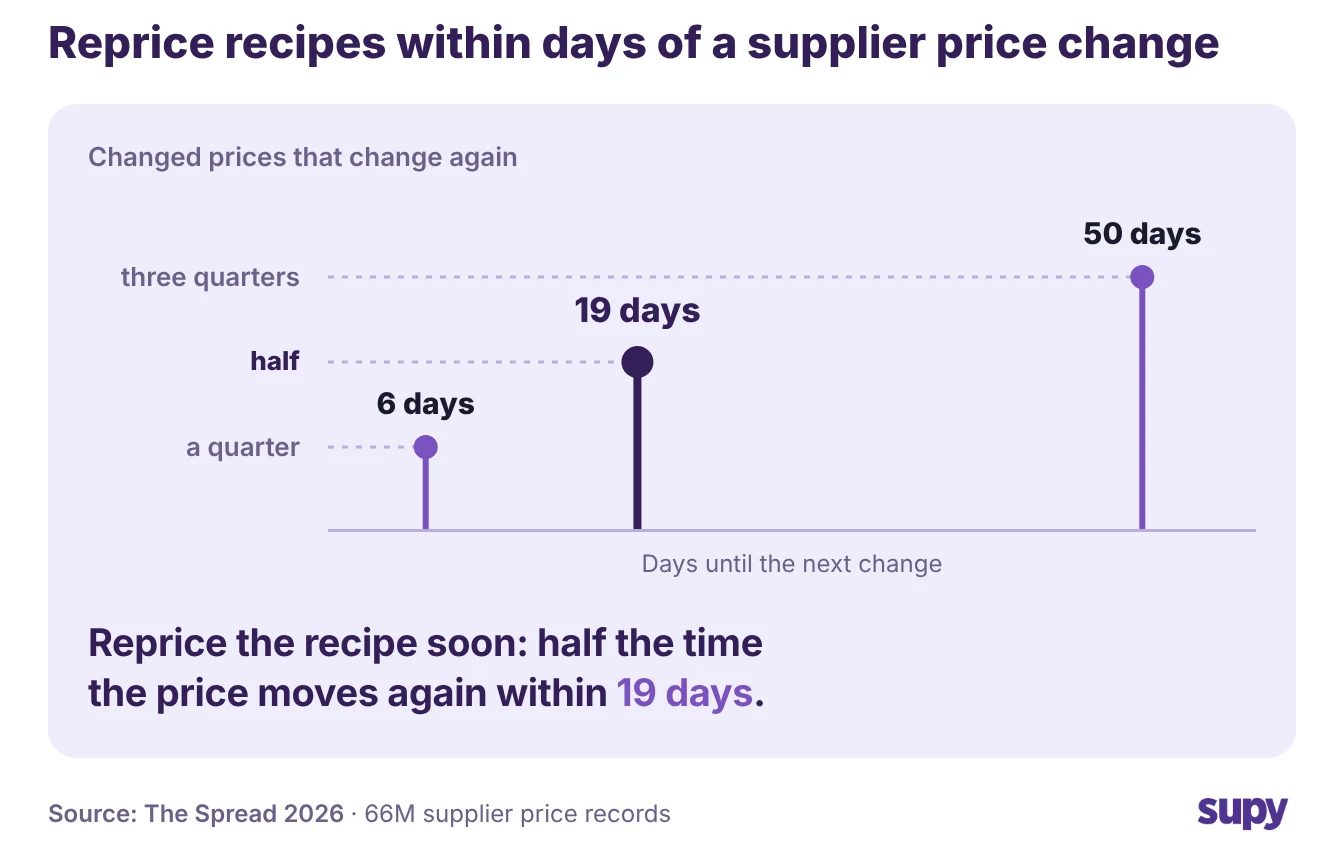
- Prices move again. A moved price rarely stays put. In The Spread, Supy's analysis of genuine supplier list-price changes, half the time a supplier changes the same price again within 19 days, so a cost sheet you updated last month is already behind.
Those are list prices rather than the agreed price a site pays, but the lesson holds either way: reprice soon after a move.
Supy attributes this for you. Every recipe carries a Cost Adjustments view, a timeline of ingredient-level cost changes, so when a dish drifts you drill into which ingredient moved and when.
- Find the invoice. Click the ingredient row and Supy takes you to the stock movement that changed its cost, which is the delivery or the price change that caused the variance. That closes the loop from a drifting percentage to the exact invoice behind it.
- Reprice the recipe. The fix is to get the theoretical cost current so it stops lying to you, then decide whether to act on the dish. Re-price the recipe against the new cost, and if the margin no longer works, re-engineer the dish, move the price, or go back to the supplier.
Keeping recipe costs in step with supplier price changes is the difference between a variance you can explain and one that reappears every month.
Branch Two: Someone Swapped an Ingredient Mid-Service
If the variance sits in one dish and no supplier price moved, a substitution is the likely cause. Supply gaps force swaps.
- How swaps happen. The kitchen runs out of shortening and fries in oil, or trades one cut of chicken for another. The dish still sells at the same price, but it now costs more to make. Nobody logged the change against the recipe, so theoretical cost never saw it.
- The margin hit. A substitution that costs 15% more per unit moves the food cost of every dish it touches. Because the menu price held, that extra cost comes straight off your margin. The variance looks like a mystery because the recipe on file is not the recipe the kitchen cooked.
Confirm it by asking the head chef what they ran out of this period, then check it against the cost timeline. The fix is to record the swap properly.
- Swap it everywhere. Supy's Replace Item tool swaps an ingredient across every recipe that uses it, and can backdate the change up to two months.
- Why backdating matters. The cost history then reflects when the swap actually happened, not the day you got around to logging it. Backdating matters here: without it, you cannot explain the variance for the weeks the kitchen was already cooking the substitute.
- Permanent or one-off. Then make the call the swap forces. If the substitute is permanent, it is now the recipe, so cost and price it as one. If it was a one-off, flag the dish so the next count does not read the variance as a fresh problem.

Branch Three: The Variance Is Yield or Wastage, Not Price
If no price moved and no ingredient was swapped, the variance is in how much of each ingredient actually reaches the plate. This branch is the one teams skip, because it does not show up on an invoice. The price per unit is right; the quantity the recipe assumes is wrong.
Two things drive it:
- Yield is lower than the recipe costs against. A recipe assumes a 10% trim loss on a vegetable, but the kitchen is actually losing 18%. Those 8 extra points mean every portion uses more raw ingredient than the cost card says. The recipe costs against a 90% yield while the kitchen gets 82%, so you pay the difference on every portion.
- Wastage is leaving before it reaches a dish. Food that spoils, over-production and over-portioning all raise actual usage above theoretical without changing a single price.
Take a $5.00 dish whose ingredients should cost $1.00 a portion at the recipe's yield:
| Per portion | At the recipe yield | At the real yield |
|---|---|---|
| Trim loss | 10% | 18% |
| Portion cost | $1.00 | $1.10 |
| Food cost | 20% | 22% |
The portion cost rises to $1.10 at the real yield, so the dish runs a 22% food cost instead of 20% while the menu price holds.
Confirm the branch against your variance report. Supy's Cost per Location report breaks the variance into opening stock, purchases, transfers, wastage and closing stock. You can see whether the extra cost is usage or loss before you blame the recipe.
- Usage runs high. If purchases match but usage runs high, the recipe yield is wrong.
- Wastage line moved. If wastage is the line that moved, the problem is on the floor, not in the cost card.
The fix depends on which it is. Re-measure the real yield and update the recipe so theoretical reflects what the kitchen gets, or tighten prep and storage so actual usage comes back down to what the recipe already assumes. One is a costing fix, the other is an operations fix, and the report tells you which.
A food cost variance is only useful once it points at a single cause you can act on. So close every period by running the variance through the tree in order, and stop at the first branch that fits:
- Split the blended number by site first. If one site is far worse, everything below applies to that site alone.
- Did a supplier price move? Find the dishes that share the ingredient, get the theoretical cost current, then decide whether to re-price or re-engineer the dish.
- Was an ingredient swapped? Record the swap against the recipe, backdate it to when it really started, and cost the dish as it is now cooked.
- Is it yield or wastage? Read the variance report: fix the recipe yield if usage is wrong, tighten the floor if wastage is the line that moved.
A single-site operator running food cost at 35% of $30,000 in weekly sales does not need a better average. They need to know that the variance came from one site's fryer, one swapped ingredient or one recipe yield.
Work it down to that one line this period and fix it. The variance you carry into next period is then the one you chose to keep.