.jpeg)

Modèle de plan d’action coût matière : Transformer les surprises de fin de mois en objectif hebdomadaire
Ce qu’un modèle de plan d’action coût matière change réellement
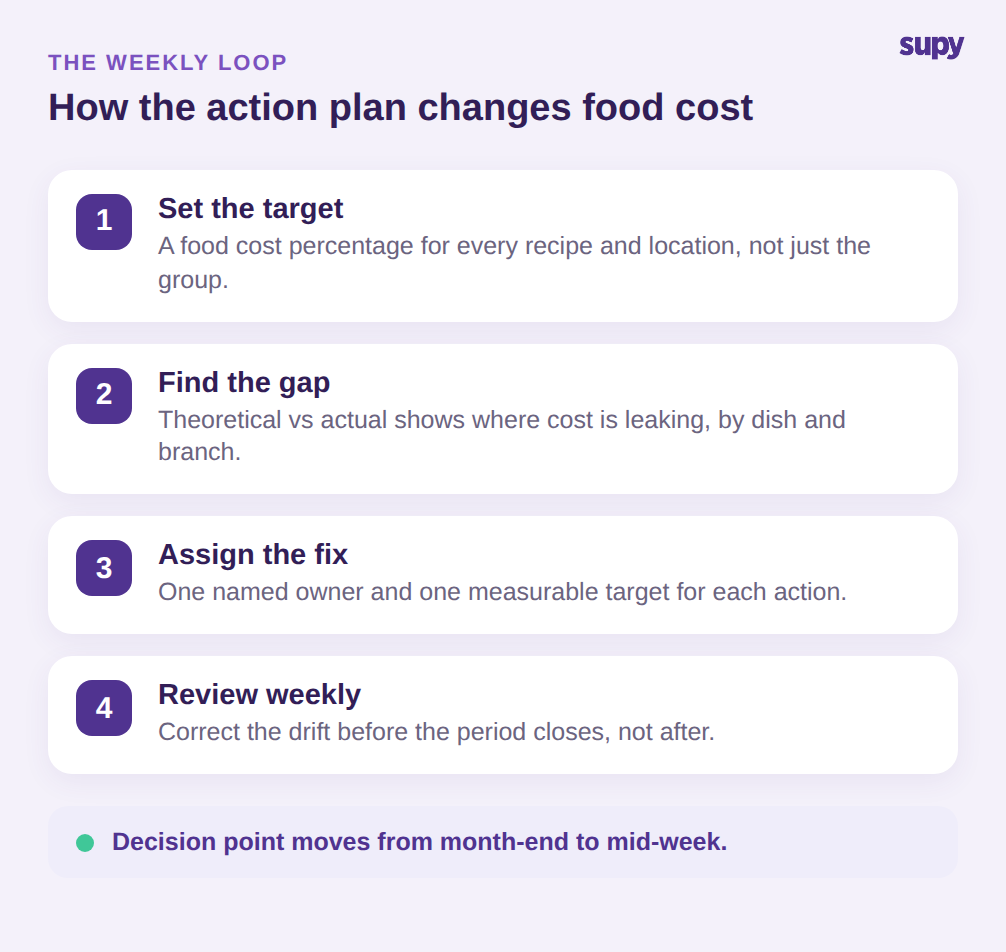
Les restaurateurs qui maintiennent leur coût matière dans les objectifs à chaque période ne travaillent pas plus dur en fin de mois. Ils appliquent une routine courte et reproductible chaque semaine : un objectif pour chaque recette et chaque site, une lecture rapide pour identifier où le coût réel s’écarte de cet objectif, et un responsable désigné nommément pour combler chaque écart avant la clôture de période. Un modèle de plan d’action coût matière transforme cette routine en quelque chose que l’ensemble d’un groupe peut appliquer de la même façon, semaine après semaine, sur chaque site.
Ce guide vous présente ce modèle et, tout aussi important, le mécanisme de données qui le fait fonctionner. Un tableau vide avec des colonnes bien définies est facile à construire. La différence entre un plan qui fait réellement baisser votre ratio coût matière et un plan qui se contente de documenter les pertes du mois précédent tient à une seule chose : si les chiffres qu’il contient sont suffisamment actuels pour que vous puissiez agir dessus. Vous trouverez ci-dessous les quatre étapes du plan, l’objectif de référence à viser pour chacune, et la façon dont les données en temps réel sur le coût des recettes et les écarts théorique/réel alimentent le plan pour qu’il reste mesurable sur l’ensemble de vos sites.
Un modèle de plan d’action coût matière n’est pas un rapport. C’est un rythme opérationnel hebdomadaire mis par écrit : fixer l’objectif, identifier l’écart, attribuer la correction, vérifier le résultat. Sa seule mission est d’avancer le moment de décision : non plus à la revue de fin de mois, quand l’argent est déjà dépensé, mais au milieu de la semaine, quand vous pouvez encore modifier une taille de portion, un prix fournisseur ou une routine de préparation et en voir l’effet dans la même période.
C’est précisément ce timing que la plupart des modèles génériques ratent. Un groupe multi-sites de taille intermédiaire a affiché un coût matière de 38 % pendant six semaines avant qu’un processus manuel sur tableur ne détecte enfin l’écart : six semaines de marge perdue parce que le plan ne regardait qu’en arrière. Le modèle présenté dans ce guide est conçu pour éviter exactement cela. Chaque ligne pointe vers un chiffre actuel et une date de revue proche, de sorte qu’une dérive apparaît pendant qu’il est encore temps d’agir. Maîtrisez ce rythme et le coût matière cesse d’être un chiffre que vous expliquez après la clôture pour devenir un objectif que vous pilotez tout au long du mois.
Le modèle lui-même est volontairement compact : quatre éléments que vous répétez chaque semaine. Premièrement, un objectif pour chaque recette et chaque site. Deuxièmement, une lecture théorique/réel qui montre où le coût réel s’éloigne de cet objectif. Troisièmement, les pertes attribuées classant vos principales fuites par site. Quatrièmement, un responsable et une date de revue pour chaque action corrective. Le reste de ce guide traite ces quatre points, un par section, avec l’objectif de référence à viser et les données en temps réel qui permettent de rendre chacun mesurable sur l’ensemble des sites.
Définissez un ratio coût matière cible pour chaque recette et chaque site
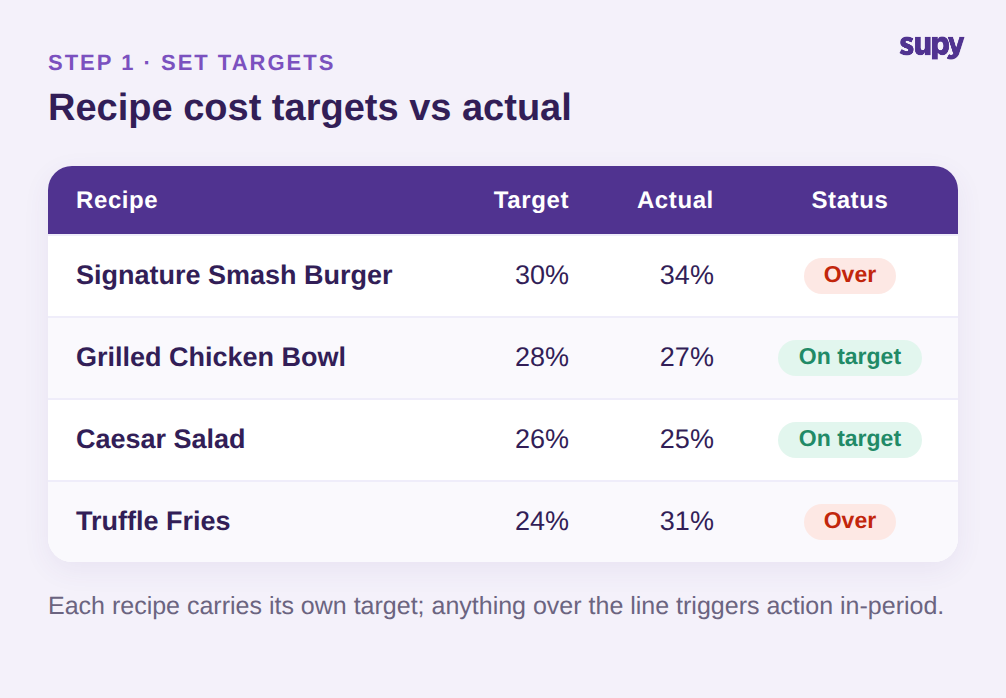
Le plan commence par un objectif, et cet objectif doit être fixé au niveau de la recette, pas seulement au niveau du groupe. Un chiffre unique de « 30 % de coût matière » à l’échelle du groupe masque les plats qui tournent discrètement à 34 % et ceux qui les subventionnent à 25 %. Fixez un ratio coût matière cible pour chaque recette et chaque site, et vous donnez à chaque site une ligne claire à tenir et un signal immédiat dès qu’un plat la dépasse.
Un point de départ courant se situe aux alentours de 28 à 32 % selon le concept, mais le chiffre qui compte est le vôtre : construisez l’objectif de chaque recette à partir de ses ingrédients et de son prix de carte, puis tenez-vous-y pour ce plat. Le faire par site est également important, car la même recette peut afficher un coût différent dans un établissement à loyer élevé avec plus de pertes que dans un site stable, et un objectif unique de groupe masquerait les deux.
C’est là que la couche de données prend toute sa valeur. Dans Supy, chaque recette porte un coût cible, et le système alerte l’équipe dès que le coût réel en ingrédients d’une recette franchit ce seuil. Un plat qui a dérivé au-delà de l’objectif déclenche une action pendant la période, plutôt qu’apparaître comme une ligne que quelqu’un remarque des semaines plus tard. L’objectif cesse d’être un exercice budgétaire annuel et devient un déclencheur en cours de période auquel le site peut répondre le jour même. Dans le modèle, c’est un tableau simple : recette, pourcentage cible, pourcentage réel actuel, et un indicateur de statut pour tout ce qui dépasse la ligne, de sorte que les plats de la semaine au-dessus de l’objectif sont la première chose que le plan met en évidence.
Utilisez l’écart théorique/réel pour identifier précisément où se situe la fuite
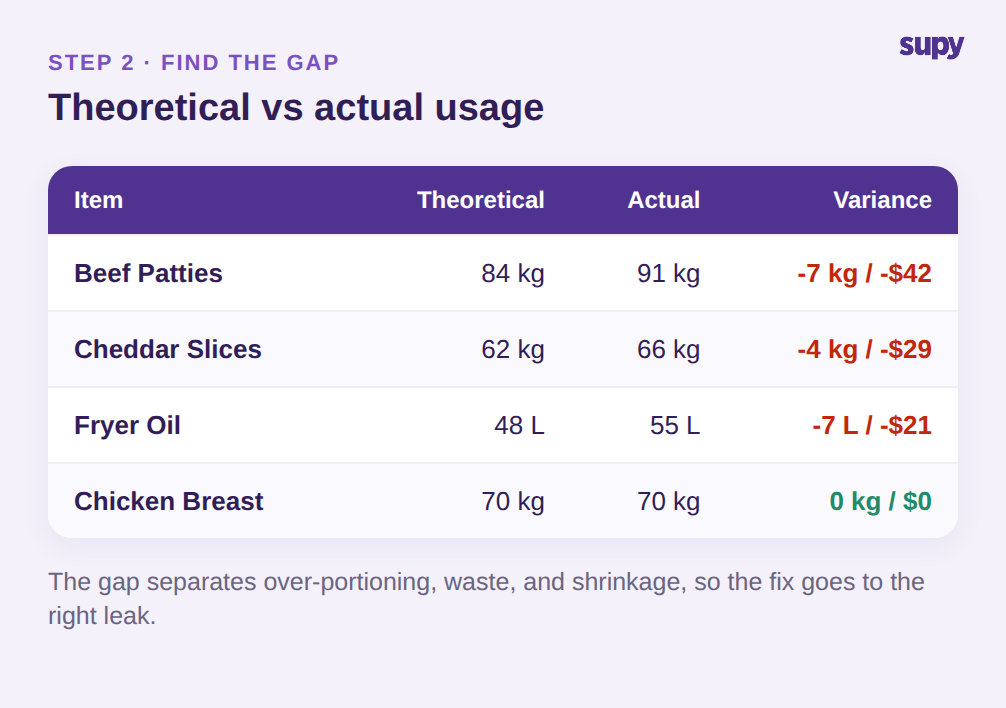
Savoir que votre coût matière dépasse l’objectif de quatre points vous indique que vous avez un problème. Cela ne vous dit pas où. L’étape la plus utile du plan consiste à comparer le coût théorique – ce que vos recettes et vos ventes indiquent que vous auriez dû utiliser – avec la consommation réelle issue de vos inventaires. L’écart entre les deux est la fuite, et sa taille et sa localisation vous indiquent où envoyer la correction.
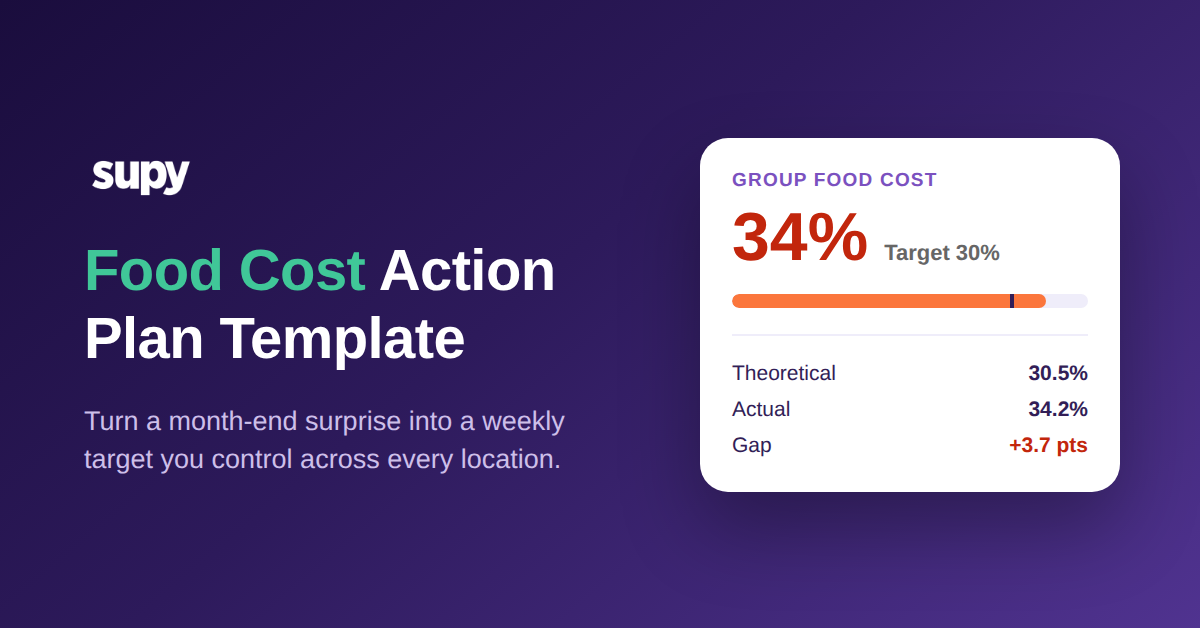
Les exploitants citent systématiquement cette comparaison comme leur plus grand angle mort. Sans suivi lié aux recettes, un dépassement n’est qu’un chiffre : vous ne pouvez pas déterminer s’il provient de surportionnement, de pertes ou de vols, donc vous ne pouvez pas corriger la bonne chose. Chacune de ces causes a une correction différente : un écart de portionnement est un problème de formation et de fiche technique, les pertes relèvent de la préparation et des commandes, et un écart inexpliqué malgré des portions serrées et peu de pertes enregistrées pointe vers la réception des marchandises ou les retraits. Envoyer la mauvaise correction sur une fuite gaspille la seule chose que le plan cherche à préserver : le temps disponible dans la période. Les tableaux de bord Supy calculent le coût théorique à partir des ventes de recettes réelles et des coûts d’ingrédients actuels, puis le comparent à la consommation réelle, de sorte que vous pouvez voir en temps réel où le coût dérive et identifier quels plats et quels sites génèrent l’écart. Un écart de 3,7 points concentré sur deux plats dans un site est un plan d’action totalement différent du même écart dilué sur l’ensemble du menu, et seul le théorique/réel vous permet de les distinguer avant de consacrer des efforts à la mauvaise correction.
Attribuez les pertes par site et traitez la plus grande fuite en premier
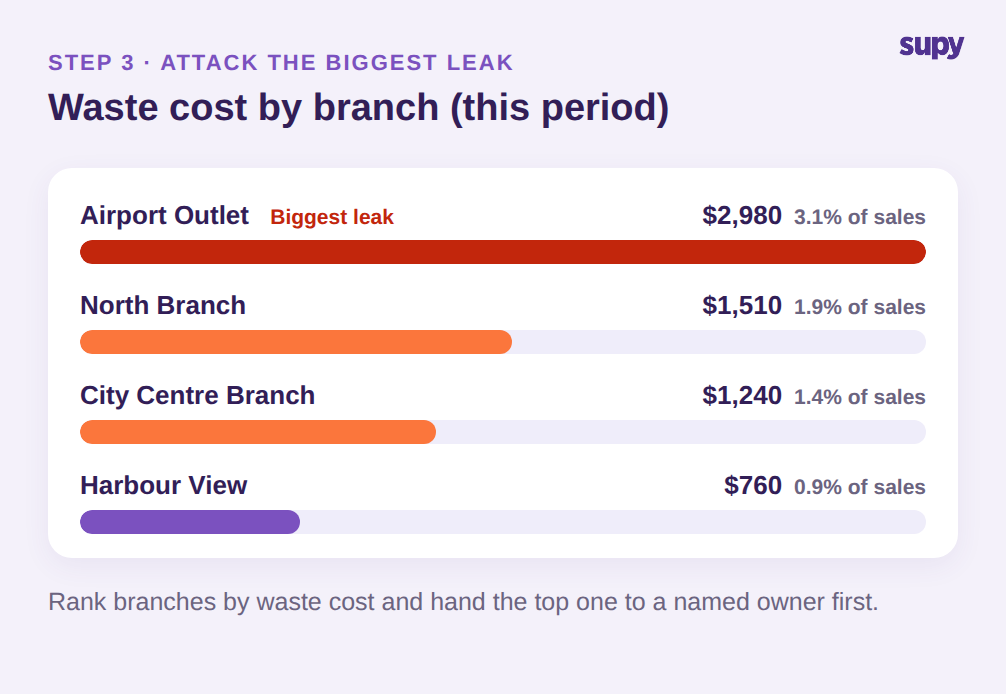
Les pertes constituent généralement la ligne individuelle la plus importante sur laquelle vous pouvez agir rapidement, mais seulement si elles sont mesurées et attribuées. « Réduire les pertes » n’est pas une action. « Réduire d’un tiers les 2 980 USD de pertes de période de l’établissement de l’aéroport, dues à l’huile de friture et à la surproduction » en est une. Attribuer le coût des pertes par site et par catégorie transforme un objectif vague en une liste classée par ordre de priorité, et le plan traite la plus grande fuite en premier plutôt que de répartir l’attention uniformément sur des sites qui fonctionnent déjà bien.
Supy enregistre le coût des pertes pour les articles individuels comme pour les recettes complètes, donnant une image complète du coût des invendus et de la surproduction par site et par période. La saisie prend quelques secondes au moment où cela se produit : article, quantité, motif. Le coût est automatiquement déduit du stock, de sorte que la ligne pertes dans votre plan d’action reflète la réalité plutôt qu’une estimation faite lors de l’inventaire. Les références sectorielles situent un écart de pertes acceptable autour de 6 à 7 %, et l’objectif de cette ligne du plan est de maintenir chaque site sous ce seuil.
L’avantage est réel et rapide : un groupe de restauration décontractée de huit établissements a fait état d’une réduction de 28 % des pertes alimentaires dans les 90 jours suivant l’adoption de l’enregistrement des pertes avec attribution du coût par site. Classez vos sites par coût de pertes, confiez le premier à un responsable nommément désigné avec un objectif précis, et vous disposez de l’action à plus fort retour sur investissement du plan. Comme les mêmes motifs reviennent dans le journal : surproduction les jours creux, pertes à la préparation à un poste donné, invendus liés à une surcommande, le plan indique aussi au responsable ce qu’il doit modifier, pas seulement combien économiser.
Désignez des responsables et instaurez un rythme de suivi hebdomadaire
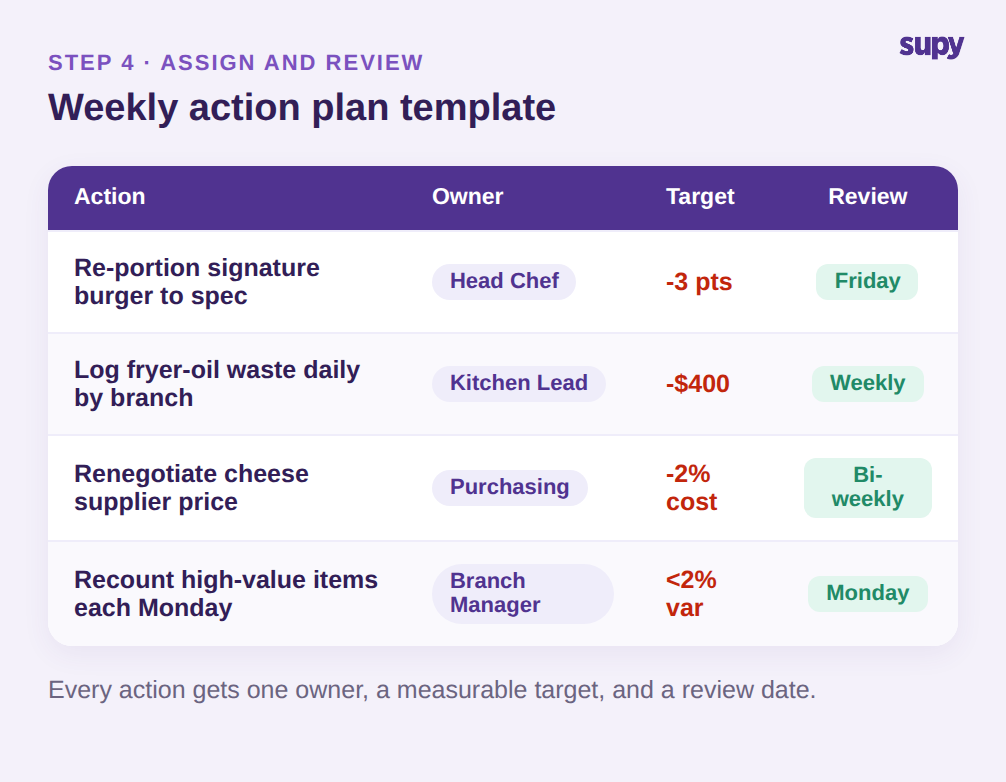
Un plan sans responsable ni date n’est qu’une liste de vœux. La dernière étape du modèle attribue chaque action corrective à une personne nommément désignée, lui fixe un objectif mesurable et établit un rythme de suivi. La plupart des groupes réalisent cette revue chaque semaine, les articles à forte valeur étant recomptés plus fréquemment. Le modèle tient sur quatre colonnes : action, responsable, objectif et date de revue, de sorte que rien ne peut rester abstrait.
La rigueur d’inventaire est ce qui rend l’ensemble du plan fiable. Une chaîne de restauration rapide multi-sites a constaté que le comptage manuel des stocks engendrait un écart de coût matière de 4 à 6 % chaque mois, les responsables passant des heures à réconcilier des tableurs sans piste d’audit fiable pour isoler l’origine des pertes. Des modèles de comptage réutilisables par ordre de rayonnage, un comptage en parallèle avec attribution, et un écart instantané par rapport au système, avec une réduction annoncée du temps de comptage de plus de 50 %, éliminent cette source d’erreur. Ainsi, les chiffres sur lesquels repose votre plan d’action sont dignes de confiance. Quand les inventaires sont rapides et précis, la revue hebdomadaire prend quelques minutes, et une revue qui prend quelques minutes est une revue qui se fait réellement chaque semaine.
Lancez votre première semaine
Vous disposez maintenant du modèle complet : un ratio coût matière cible par recette et par site, une lecture théorique/réel pour trouver l’écart, des pertes attribuées par site, et des responsables avec des dates de revue hebdomadaires. Pour le lancer cette semaine, commencez par un chiffre et une règle. Fixez votre objectif de groupe : 30 % est un point de départ courant, mais tenez-le à votre propre menu. Puis relevez votre coût matière en cours. Si l’écart dépasse deux points, ou si l’écart de pertes d’un seul site dépasse le seuil sain de 6 à 7 % deux semaines de suite, c’est votre signal pour agir maintenant plutôt qu’attendre la clôture.
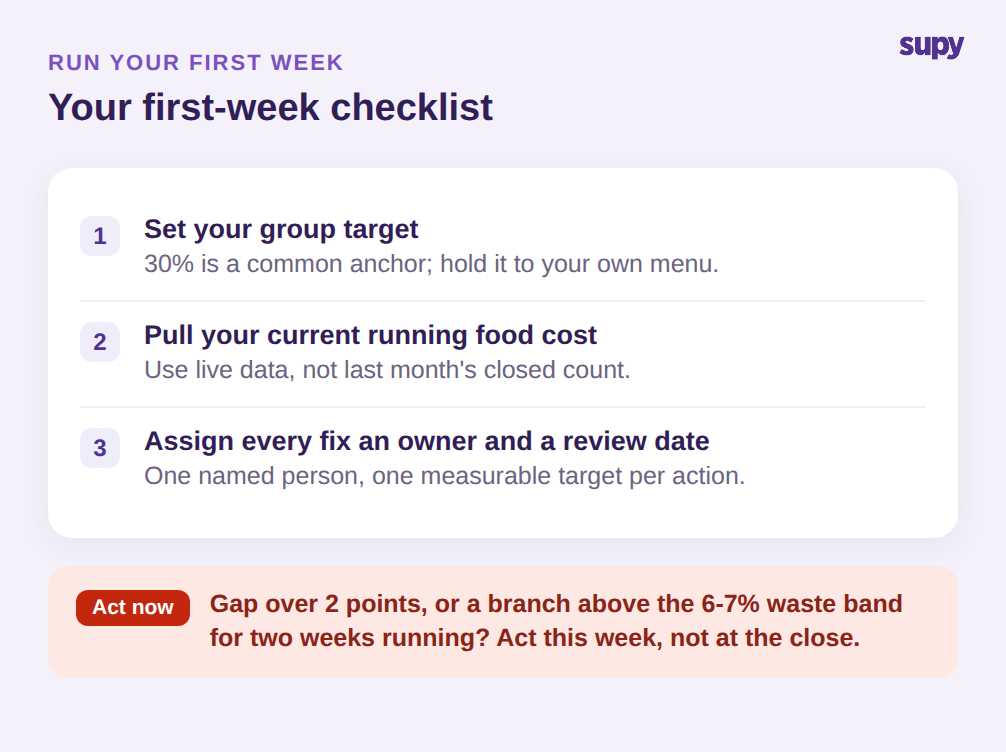
Le plan ne fonctionne qu’avec des données actuelles. Un modèle rempli à partir d’un inventaire vieux d’un mois ne fait que consigner l’historique ; le même modèle alimenté par les coûts de recettes en temps réel et les données d’écart théorique/réel transforme le coût matière d’un chiffre que vous expliquez après coup en un objectif que vous pilotez tant qu’il reste une période pour le corriger.