.jpg)


Food Cost Action Plan Template: Turn a Month-End Surprise Into a Weekly Target You Control
What a Food Cost Action Plan Template Actually Changes
The operators who keep food cost on target every period are not working harder at month-end. They are running a short, repeatable loop every week: a target for each recipe and location, a fast read on where actual cost is drifting away from that target, and a named owner assigned to close each gap before the period closes. A food cost action plan template is what turns that loop into something an entire group can run the same way, week after week, in every outlet.
This guide gives you that template and, just as important, the data mechanism that makes it work. A blank spreadsheet with tidy columns is easy to build. The difference between a plan that actually moves your food cost percentage and one that just documents last month's loss is whether the numbers inside it are current enough to act on. Below are the four steps of the plan, the healthy benchmark to aim for at each one, and how live recipe costing and theoretical-vs-actual data feed the plan so it stays measurable across every site.
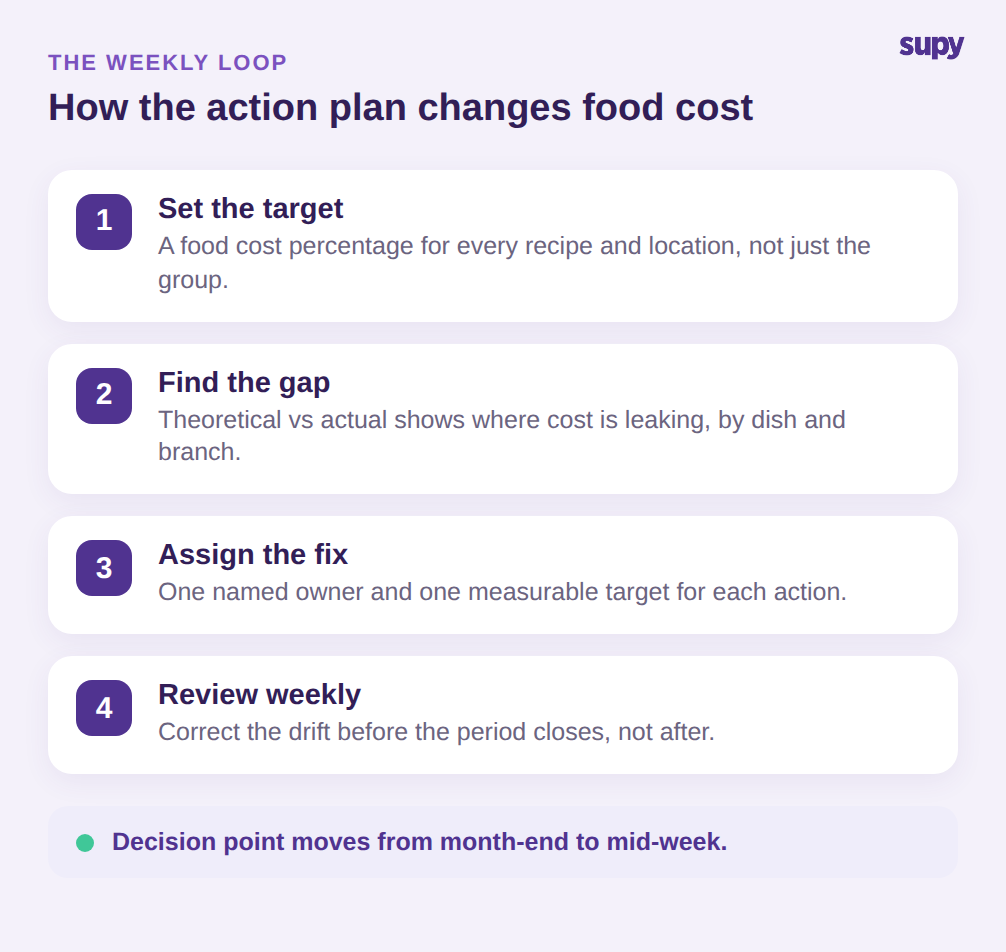
A food cost action plan template is not a report. It is a weekly operating rhythm written down: set the target, find the gap, assign the fix, review the result. Its whole job is to move the decision point earlier - from the month-end review, when the money is already spent, to the middle of the week, when you can still change a portion size, a supplier price, or a prep routine and see the effect in the same period.
That timing is the point most generic templates miss. One mid-sized multi-branch group ran at a 38% food cost for six weeks before a manual spreadsheet process finally caught the variance - six weeks of margin gone because the plan only looked backward. The template in this guide is built to prevent exactly that. Every row points at a current number and a near-term review date, so a drift surfaces while there is still time to act on it. Get the rhythm right and food cost stops being a figure you explain after the close and becomes a target you steer toward all month.
The template itself is deliberately small: four moving parts you repeat every week. First, a target for each recipe and location. Second, a theoretical-vs-actual read that shows where actual cost is pulling away from that target. Third, attributed waste that ranks your biggest leaks by branch. Fourth, an owner and a review date against every corrective action. The rest of this guide is those four parts, one section each, with the benchmark to aim for and the live data that keeps each one honest across sites.
Set a Target Food Cost Percentage for Every Recipe and Location
The plan starts with a target, and the target belongs at the recipe level, not just the group level. A single group-wide "30% food cost" number hides the dishes quietly running at 34% and the ones subsidising them at 25%. Set a target food cost percentage for each recipe and each location and you give every branch a clear line to hold and a clear signal the moment a dish crosses it.
A common starting anchor is somewhere around 28-32% depending on the concept, but the number that matters is your own: build each recipe's target from its ingredients and menu price, then hold the dish to it. Doing this per location matters too, because the same recipe can run a different cost in a high-rent branch with more spoilage than in a steady suburban site, and a single group target would mask both.
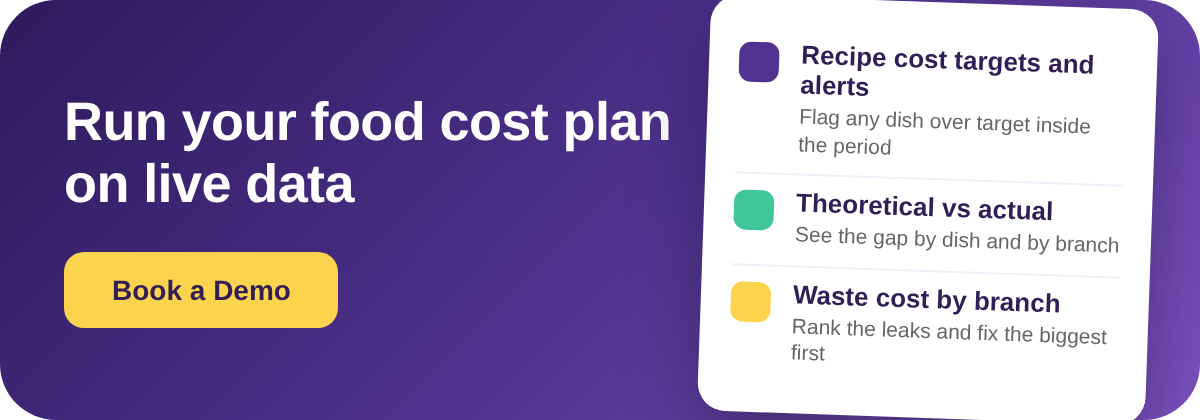
This is where the data layer earns its place. In Supy, each recipe carries a target cost, and the system alerts the team the moment a recipe's actual ingredient cost crosses that threshold. A dish that has drifted over target triggers action inside the period rather than showing up as a line item someone notices weeks later. The target stops being an annual budgeting exercise and becomes an in-period trigger the branch can respond to the same day. In the template, this is a short table: recipe, target percentage, current actual percentage, and a status flag for anything over the line, so the week's over-target dishes are the first thing the plan surfaces.
| Recipe | Target | Actual | Status |
|---|---|---|---|
| Signature Smash Burger | 30% | 34% | Over |
| Grilled Chicken Bowl | 28% | 27% | On target |
| Caesar Salad | 26% | 25% | On target |
| Truffle Fries | 24% | 31% | Over |
Use Theoretical vs Actual to Find Exactly Where the Gap Is
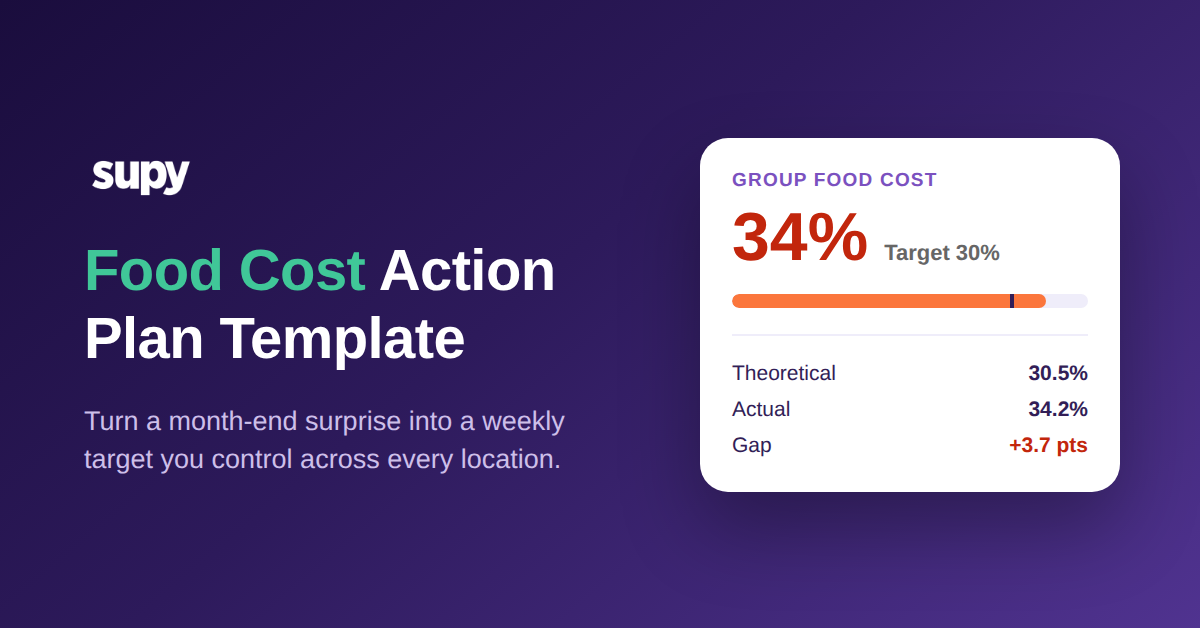
Knowing your food cost is four points over target tells you that you have a problem. It does not tell you where. The single most useful step in the plan is comparing theoretical cost - what your recipes and sales say you should have used - against actual usage from your counts. The gap between the two is the leak, and its size and location tell you where to send the fix.
Operators consistently name this comparison as their biggest blind spot. Without recipe-linked tracking, an overrun is just a number: you cannot tell whether it came from over-portioning, waste, or theft, so you cannot fix the right thing. Each of those has a different fix - a portioning gap is a training and spec problem, waste is a prep and ordering problem, and an unexplained gap with tight portions and low logged waste points at receiving or shrinkage - and sending the wrong fix at a leak wastes the one thing the plan is built to save, which is time inside the period. Supy dashboards calculate theoretical food cost from actual recipe sales and current ingredient costs, then compare that to actual usage, so you can see in real time where cost is diverging and drill into which dishes and branches drive the gap. A 3.7-point gap concentrated in two dishes at one branch is a completely different action plan from the same gap spread thinly across the menu - and only theoretical-vs-actual lets you tell them apart before you spend effort on the wrong fix.
| Item | Theoretical | Actual | Variance |
|---|---|---|---|
| Beef Patties | 84 kg | 91 kg | -7 kg / -$42 |
| Cheddar Slices | 62 kg | 66 kg | -4 kg / -$29 |
| Fryer Oil | 48 L | 55 L | -7 L / -$21 |
| Chicken Breast | 70 kg | 70 kg | 0 kg / $0 |
Attribute Waste by Branch and Fix the Biggest Leak First
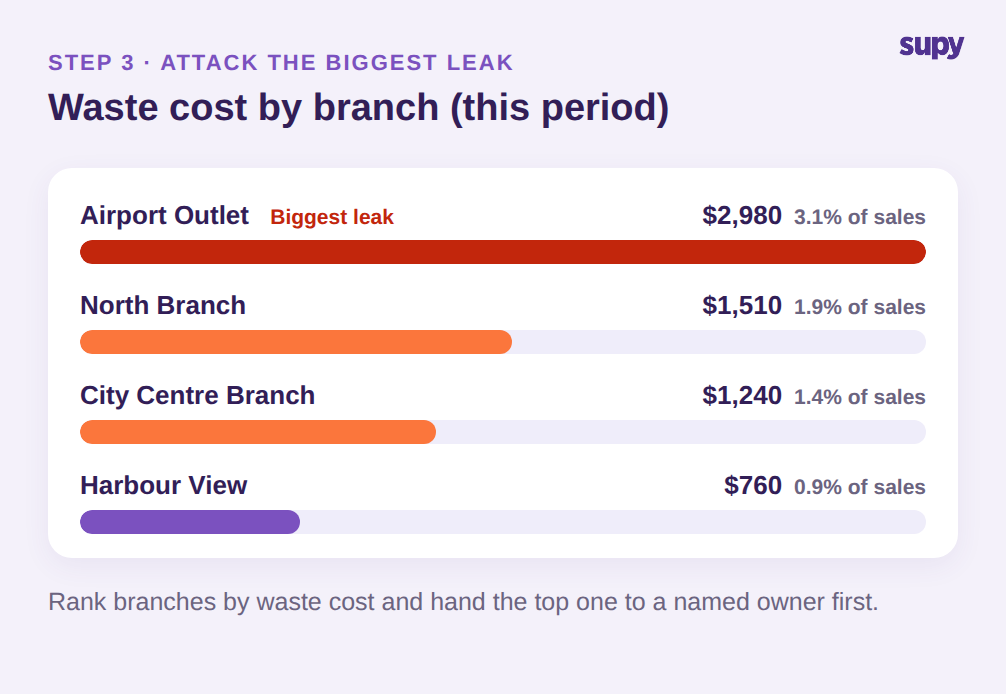
Waste is usually the largest single line you can act on quickly, but only if it is measured and attributed. "Reduce waste" is not an action. "Cut the Airport Outlet's 2,980 USD period waste, driven by fryer oil and over-production, by a third" is. Attributing waste cost by branch and category turns a vague goal into a ranked list, and the plan works the biggest leak first instead of spreading attention evenly across sites that are already fine.
Supy records wastage cost for both individual items and full recipes, giving a complete picture of what spoilage and over-production cost by branch and period. Logging it takes seconds at the point it happens - item, quantity, reason - and the cost is deducted from stock automatically, so the waste line in your action plan reflects reality rather than a guess made at the count. Industry benchmarks put an acceptable waste variance at around 6-7%, and the aim of this line of the plan is to hold each branch under that band.
The upside is real and quick: one eight-location casual-dining group reported a 28% reduction in food waste within 90 days of adopting waste logging with per-branch cost attribution. Rank your branches by waste cost, hand the top one to a named owner with a specific target, and you have the single highest-return action in the plan. Because the same reasons show up in the log - over-production on slow days, prep waste on a particular station, spoilage from over-ordering - the plan also tells the owner what to change, not just how much to save.
Assign Owners and Run a Weekly Review Cadence
A plan without an owner and a date is a wish list. The final step of the template assigns each corrective action to a named person, gives it a measurable target, and sets a review cadence. Most groups run this review weekly, with high-value items recounted more often. The template keeps four columns - action, owner, target, and review date - so nothing on it can stay abstract.
Counting discipline is what keeps the whole plan honest. One multi-location quick-service chain found that manual stock counting caused a 4-6% food cost variance every month, with managers spending hours reconciling spreadsheets and no reliable audit trail to isolate where the loss occurred. Reusable count templates in shelf order, parallel counting with attribution, and instant variance against the system - with a stated 50%-plus reduction in counting time - remove that source of error, so the numbers your action plan runs on are ones you can trust. When counts are fast and accurate, the weekly review takes minutes, and a review that takes minutes is one that actually gets done every week.
| Action | Owner | Target | Review |
|---|---|---|---|
| Re-portion signature burger to spec | Head Chef | -3 pts | Friday |
| Log fryer-oil waste daily by branch | Kitchen Lead | -$400 | Weekly |
| Renegotiate cheese supplier price | Purchasing | -2% cost | Bi-weekly |
| Recount high-value items each Monday | Branch Manager | <2% var | Monday |
Run Your First Week
You now have the full template: a target food cost percentage per recipe and location, a theoretical-vs-actual read to find the gap, waste attributed by branch, and owners with weekly review dates. To run it this week, start with one number and one rule. Set your group target - 30% is a common anchor, but hold it to your own menu - and pull your current running food cost. If the gap is more than two points, or if any single branch's waste variance sits above the 6-7% healthy band for two weeks running, that is your signal to act now rather than wait for the close.
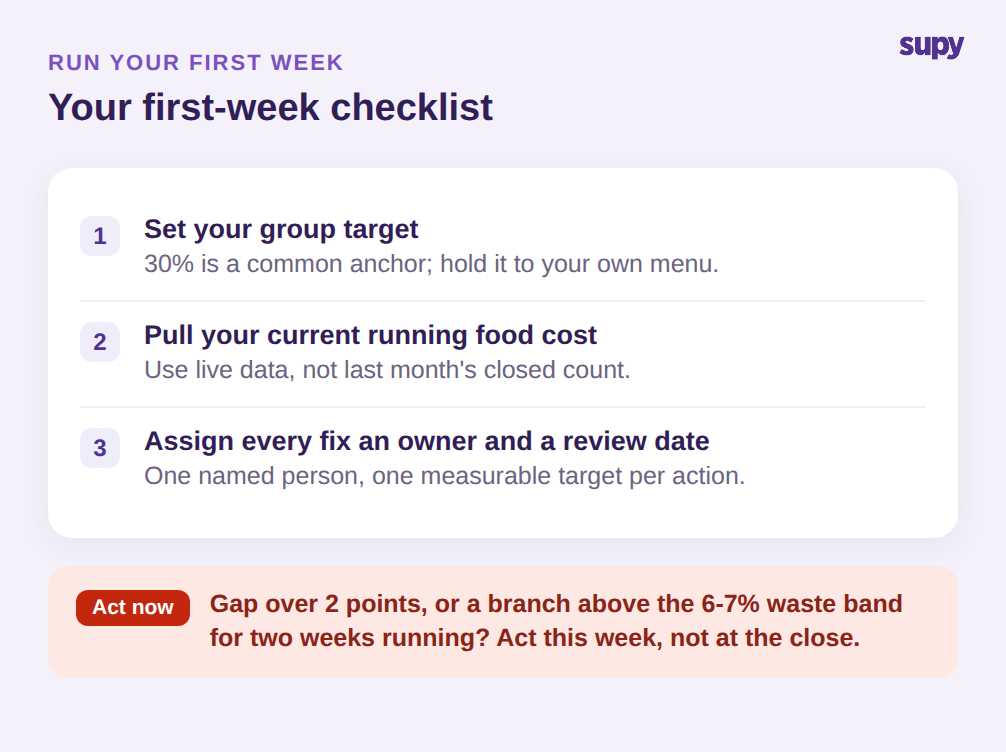
The plan only works on current data. A template filled in from a month-old count just records history; the same template fed by live recipe costs and theoretical-vs-actual variance turns food cost from a number you explain after the fact into a target you control while there is still a period left to change it.