.jpg)


Food Cost Percentage: What It Is, What It Should Be, and How to Control It
What Food Cost Percentage Measures
Food cost percentage is the ratio of what you spent on ingredients to what you earned from selling the dishes those ingredients went into.
The formula is straightforward: divide your cost of goods sold by your total revenue, then multiply by 100. If a restaurant spent $28,000 on ingredients in a week that generated $100,000 in revenue, the food cost percentage is 28%.
What the number actually captures is how efficiently the kitchen is converting purchased ingredients into sold dishes. A food cost percentage above your target does not just mean you spent too much. It may mean portioning is inconsistent, waste is not being recorded, supplier prices have increased without recipe updates, or stock is leaving the building without being sold. The percentage alone does not tell you which problem you have — that requires the comparison between what you should have spent and what you actually spent.
Food Cost Percentage Benchmarks by Segment
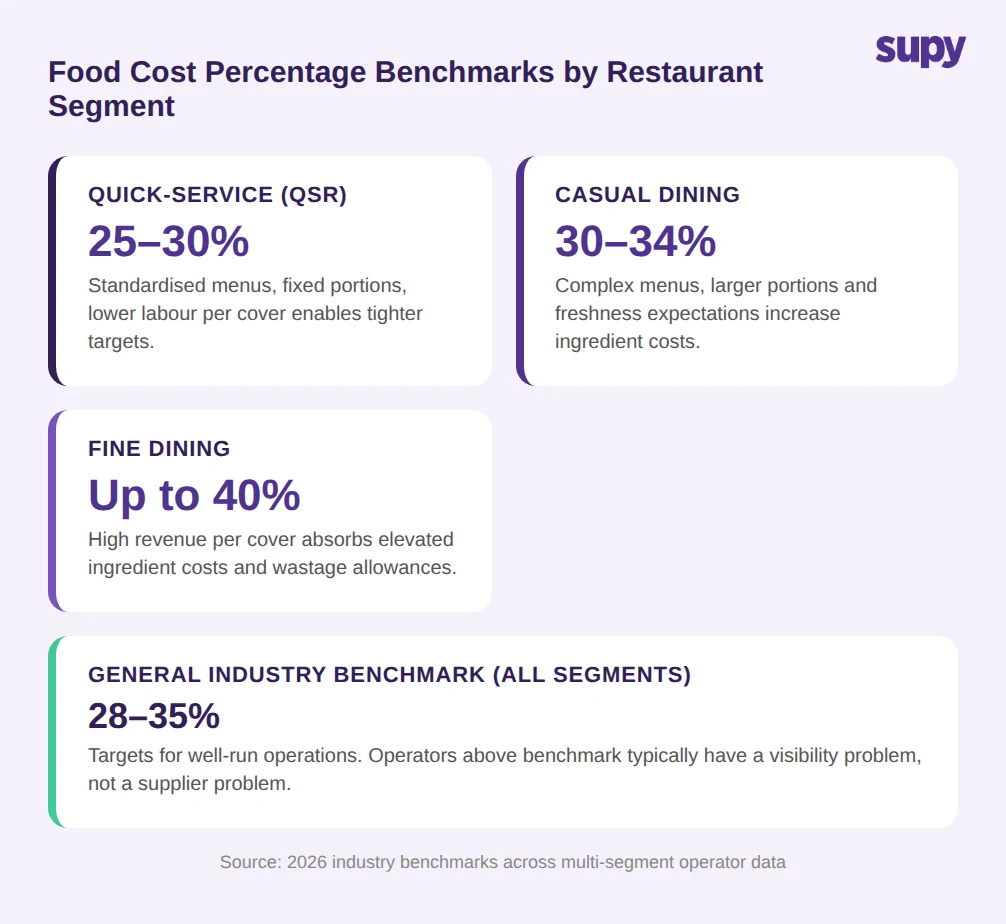
The widely-cited industry benchmark is 28–35% across all restaurant segments. The right number for any individual operation depends on segment, labour model, and revenue per cover.
Quick-service restaurants target 25–30%. Lower food cost is achievable because QSR menus are standardised, portion sizes are fixed, and labour intensity per cover is lower.
Casual dining targets 30–34%. Higher ingredient costs reflect more complex menus, larger portions, and a higher expectation of freshness.
Fine dining can run food cost up to 40% and remain viable, because revenue per cover is high enough to absorb the cost.
These are target ranges for well-run operations, not industry averages. Many operators run above their segment benchmark — not because they have a supplier problem, but because they lack the visibility to see where the gap is. A multi-unit casual dining group that targets 30% but operates at 40% has a measurement problem before it has a procurement problem.
What to ask as an operator: Is your current food cost percentage calculated from actual cost-of-goods-sold data, or is it estimated from purchasing spend alone?
Theoretical vs Actual: Where the Variance Comes From
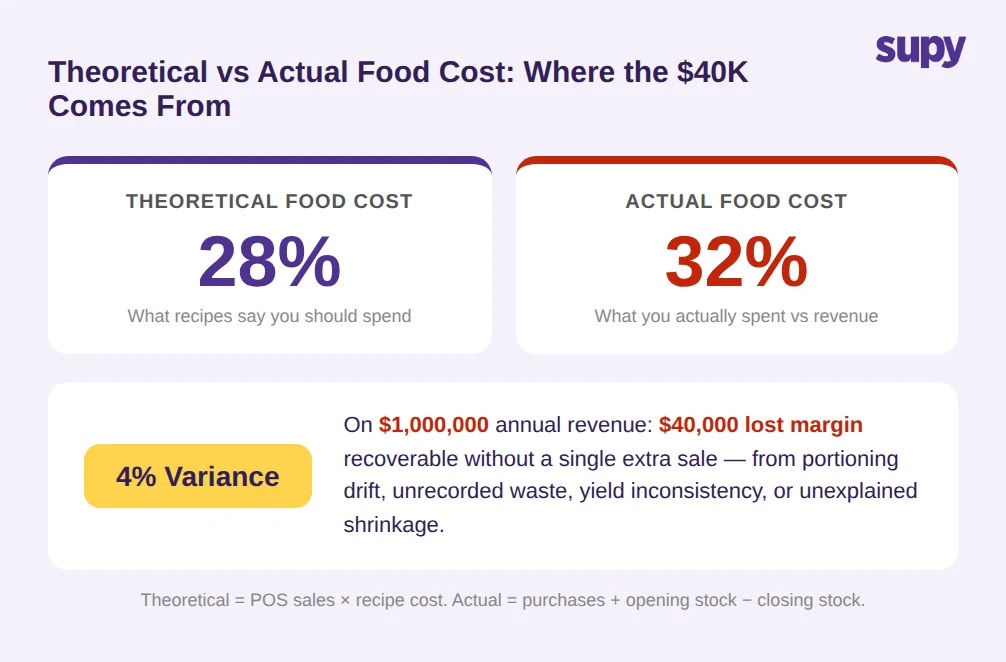
The most important distinction in food cost analysis is between theoretical food cost and actual food cost.
Theoretical food cost is what the kitchen should have spent, calculated from what the POS recorded as sold multiplied by the standard cost of each recipe. Actual food cost is what the kitchen actually spent, calculated from what was purchased plus opening stock minus closing stock.
The difference between the two is the variance. A restaurant doing $1,000,000 in annual sales with a 4% variance between theoretical and actual food cost is losing $40,000 in margin — without any reduction in revenue and without touching supplier contracts. That $40,000 is recoverable purely by closing the gap between what recipes specify and what the kitchen actually uses.
The variance can come from portioning drift (consistently plating above portion spec), unrecorded waste and spoilage that is not logged against specific ingredients, yield inconsistency where actual prep yield differs from the recipe assumption, or unexplained shrinkage after the above are accounted for.
Most operators discover their food cost percentage once a month. Operators who calculate monthly discover portioning drift from the first two weeks when the damage is already locked in. Food inventory software that tracks sales and depletion continuously makes the variance visible within days, not weeks.
How Counting Cadence Determines Variance Control
The counting cadence is the operational lever that determines how quickly food cost variance becomes visible and actionable.
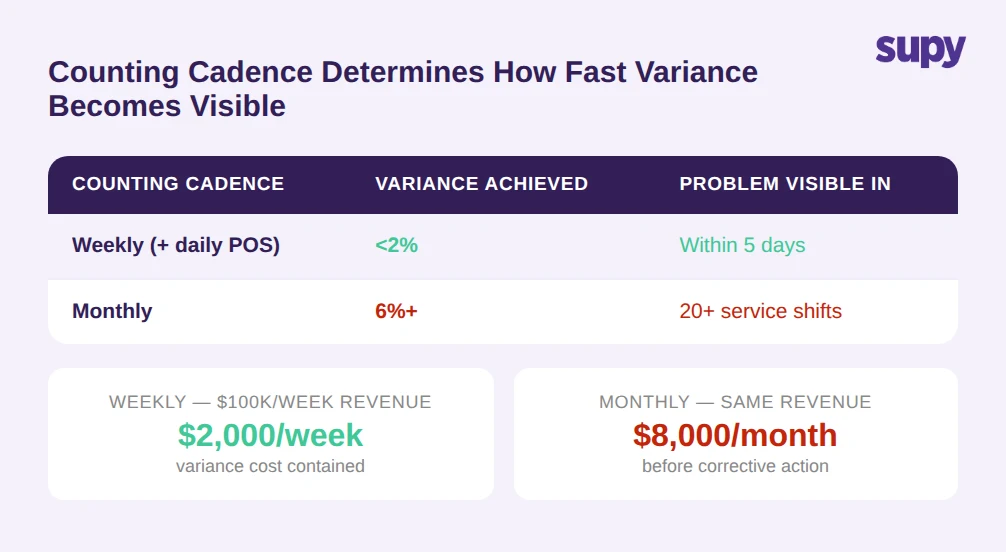
Operators who count stock weekly and reconcile against POS sales daily consistently achieve variance below 2%. Operators who count monthly discover problems a month too late. A portioning problem that starts on a Monday shows up in a weekly count by Friday. The same problem does not surface in a monthly count until 20 or more service shifts have compounded it.
The practical difference is not just timing — it is the scale of the loss. A 2% variance held at 2% through weekly counting costs a restaurant running $100,000 a week in revenue approximately $2,000 per week. The same variance unchecked for a month before it is identified costs $8,000 before any corrective action begins.
Structured restaurant inventory software that supports shelf-order counting templates, barcode scanning, and automatic discrepancy flagging makes weekly counts operationally achievable without the five-to-ten hours of manual work per location that put many operators on monthly cycles.
What to ask about your current process: If a portioning problem started today, how many days would pass before you saw it in your food cost data?
Multi-Site Operators: Per-Location Visibility vs Group-Level
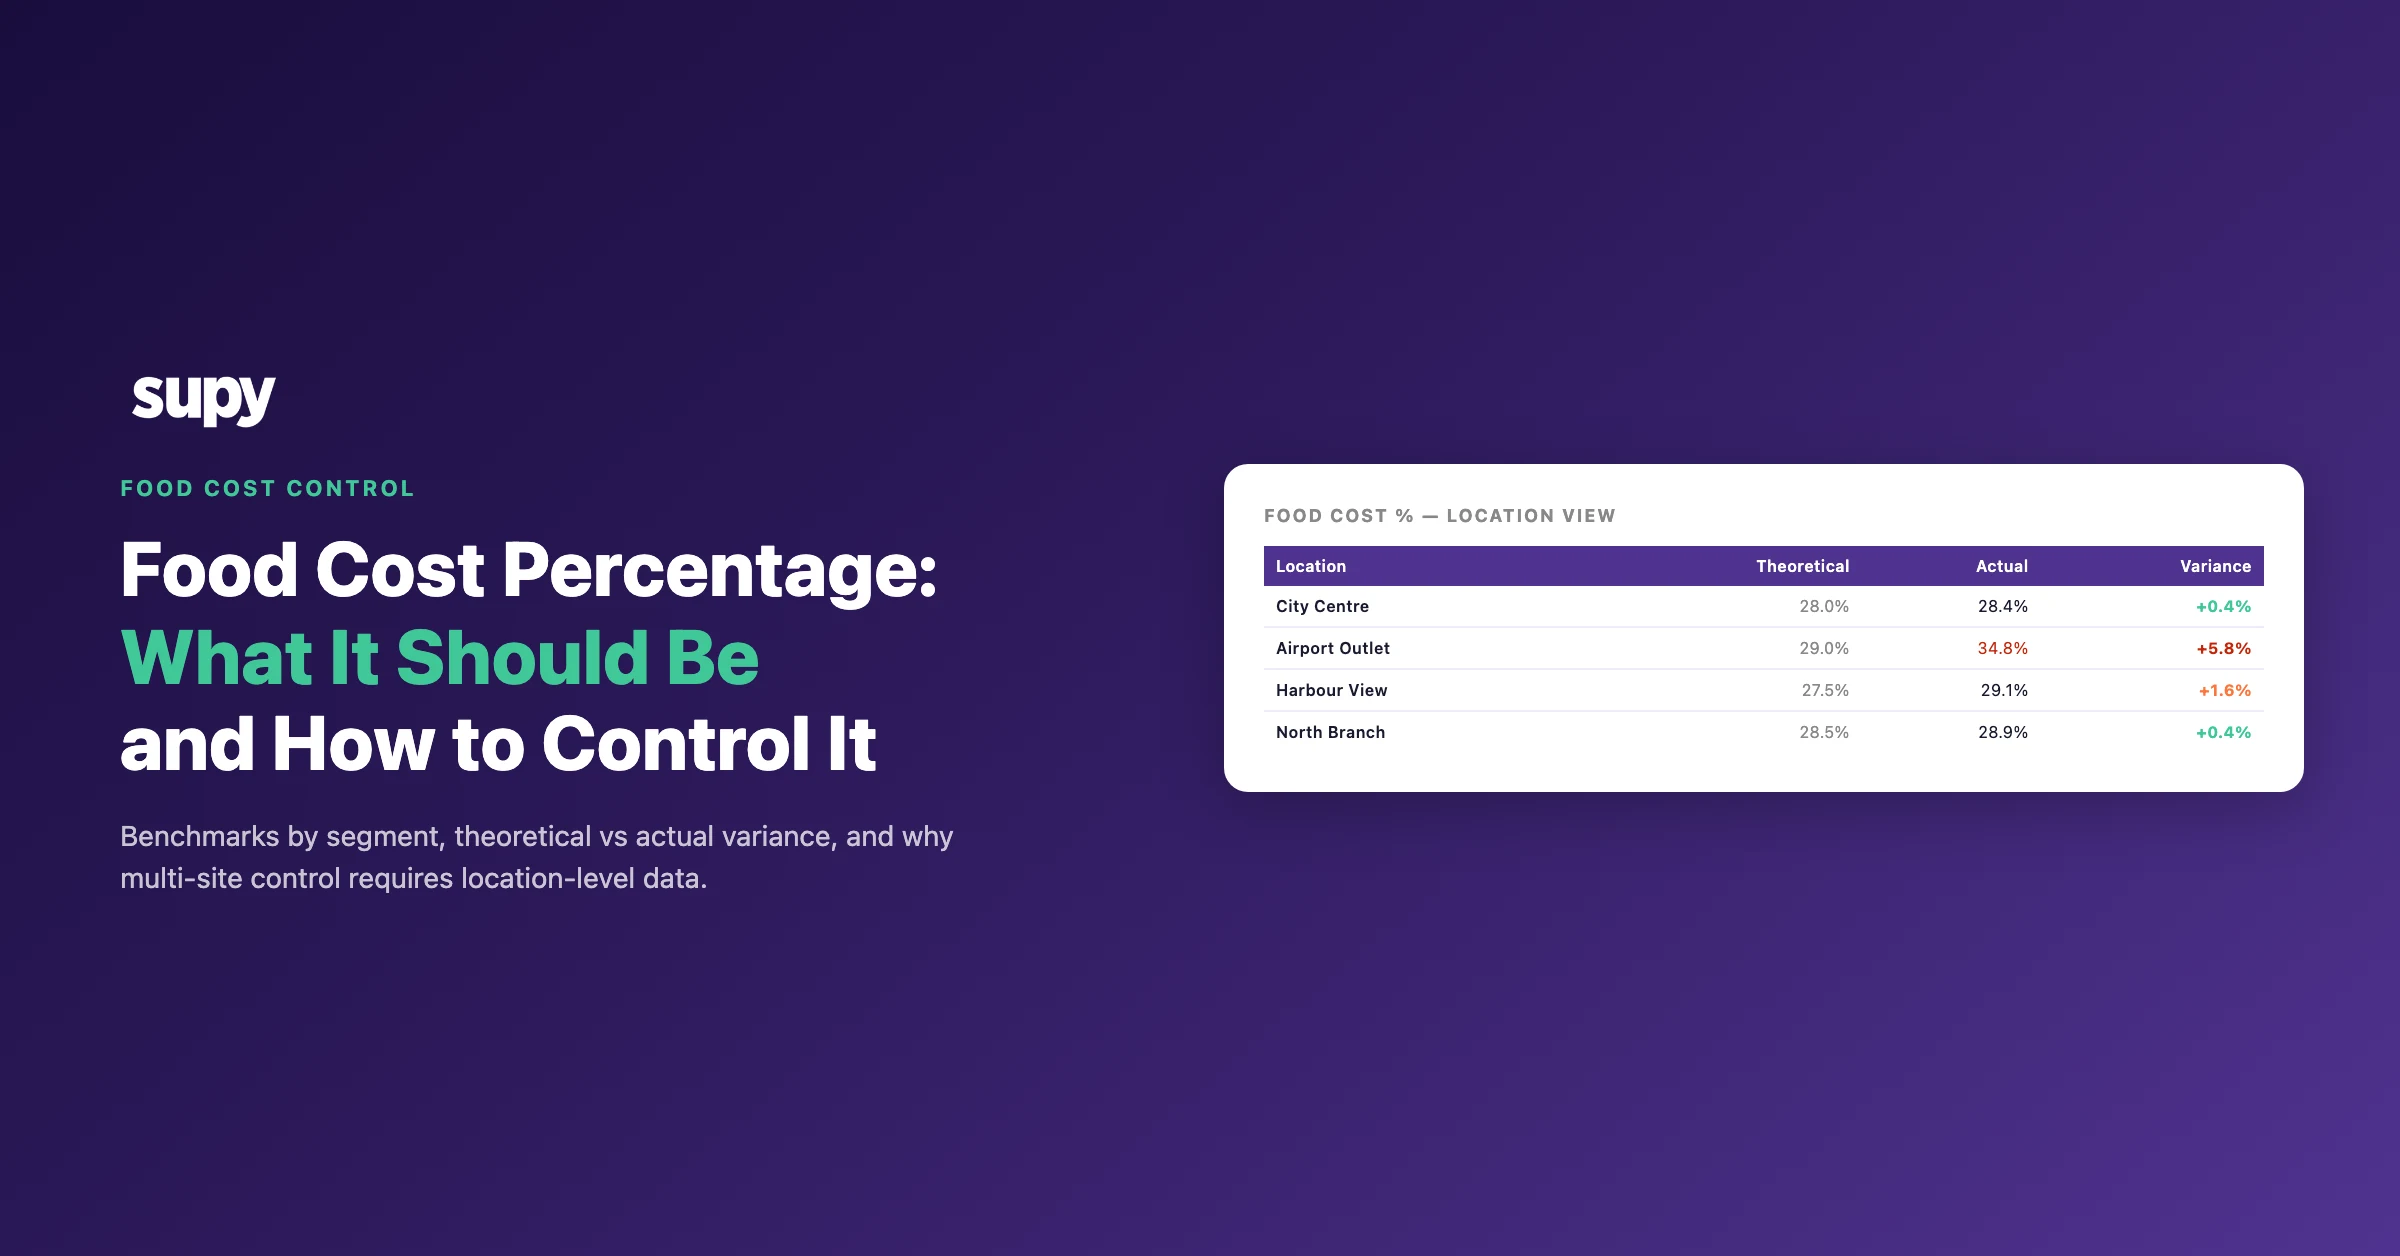
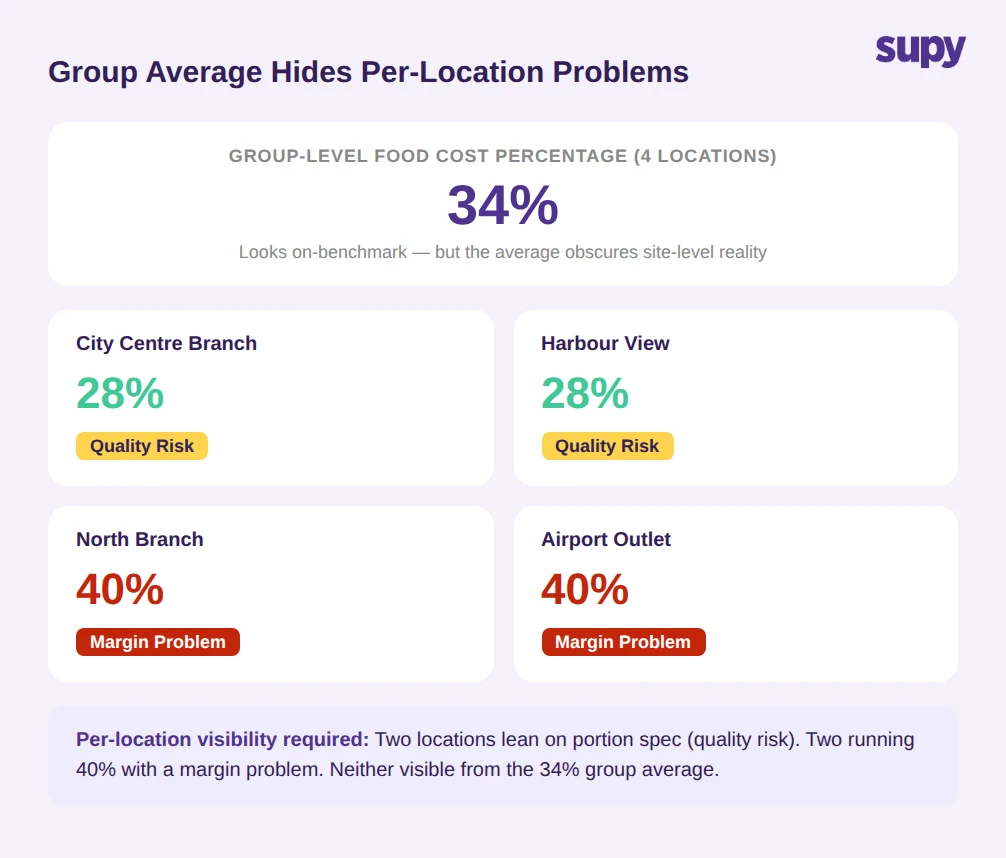
For multi-location operators, a single group-level food cost percentage is insufficient for control. It is a lagging indicator of the average, not a signal for where to act.
A group of four locations with a group food cost of 34% may be running two locations at 28% and two at 40%. The group average obscures the problem locations entirely. The 28% locations may be running lean on portion spec, which is a quality risk. The 40% locations have a margin problem. Neither is visible from the aggregate.
The operational requirement for food cost management software in multi-site operations is per-location food cost percentage, calculated from each location’s own sales and stock data, with the ability to drill into ingredient-level variance per site. A central kitchen operation adds another layer: stock movement between the central facility and outlet kitchens must be tracked as inter-location transfers, or the theoretical-vs-actual comparison at each site becomes meaningless.
Multi-site operators reviewing food and beverage inventory software consistently identify per-location cost visibility as the capability that differentiates purpose-built platforms from general accounting tools.
Food Costs 35% Above Pre-Pandemic Levels: Why Benchmarks Matter More Now
Average food costs in 2026 remain more than 35% above pre-pandemic levels. For operators who accepted a food cost percentage that was marginally above benchmark in 2019, the same operational patterns now produce materially higher absolute losses per cover.
A restaurant that ran a 36% food cost percentage in 2019 absorbed the excess differently than the same kitchen running 36% today with ingredient costs that are 35% higher in absolute terms. Revenue has not scaled to match input cost inflation in most casual dining segments. The margin for waste, portioning drift, and unrecorded shrinkage that existed before the pandemic has compressed.
This is the context that makes food cost percentage a more consequential number in 2026. An operator who hits the 28–35% benchmark through recipe-linked tracking and weekly variance review is doing it with a system that makes the data available in time to act on it — not a month later when the damage is done. Explore how Supy approaches food cost control for multi-site operators.