.jpg)


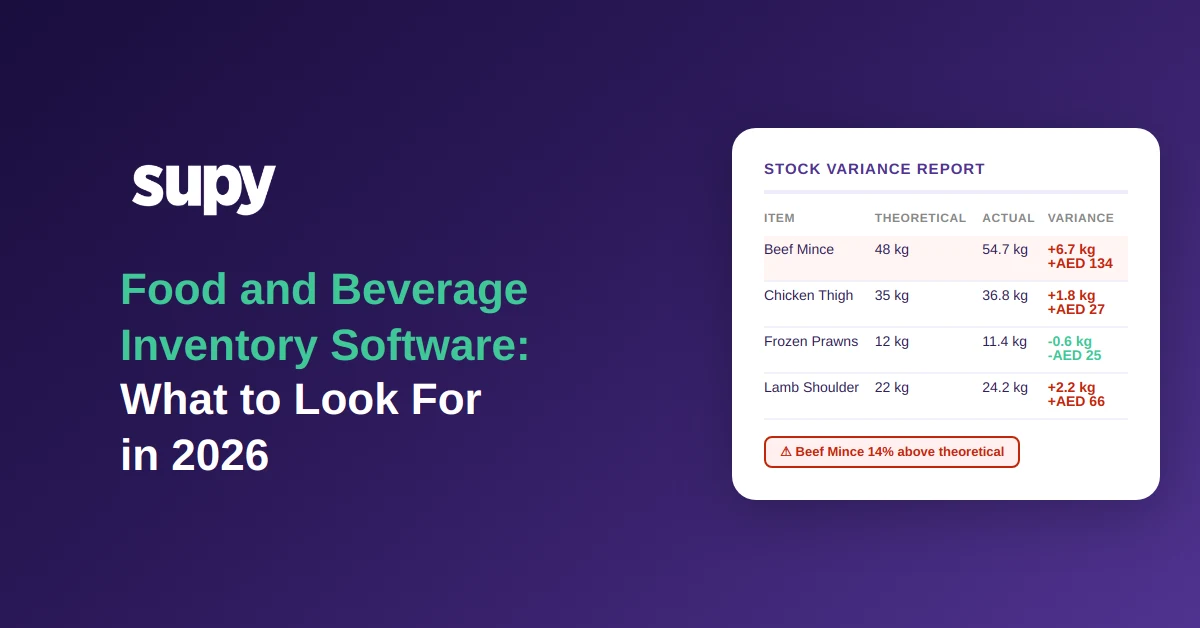
Food and Beverage Inventory Software: What to Look For in 2026
What Food and Beverage Inventory Software Actually Tracks
The phrase “inventory software” covers a wide range of tools. In the food and beverage context, a purpose-built platform does several things that generic stock management or ERP systems do not.
At its core, food inventory software tracks what you have, what you are using, and what you should have used based on what you sold. That last part — the link between sales and theoretical consumption — is where most generic tools fall short. A spreadsheet or basic POS add-on can count stock. It cannot tell you that your grill station is running 3% above theoretical beef consumption across five locations, which means either portioning is inconsistent, waste is unrecorded, or stock is walking out the door.
Purpose-built food and beverage inventory software connects the stock count to the recipe, the recipe to the POS sale, and the POS sale to the purchase order. That chain is what makes the food cost percentage a real-time number rather than a month-end estimate.
For multi-site and multi-concept operations, the additional requirement is centralisation: one platform giving a finance manager or ops director visibility across all sites simultaneously, without having to consolidate exports from each location’s system.
The Real-Time Visibility Problem in Multi-Site Operations
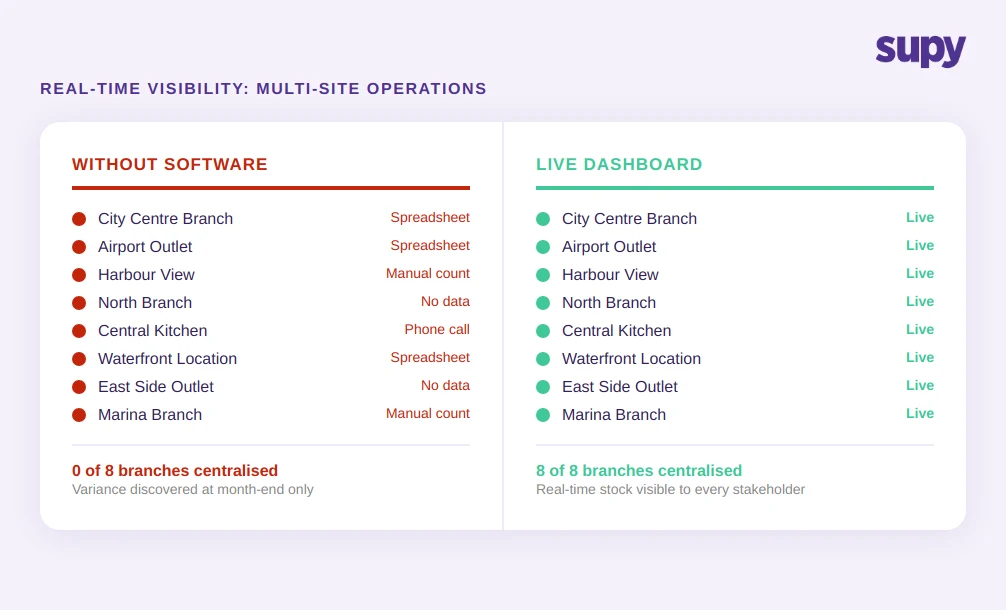
A mid-sized restaurant group operating 8 locations had no centralised stock visibility. Branch managers made ordering decisions based on experience and memory rather than live data. The result was predictable: regular over-purchasing of perishables, undetected discrepancies when stock moved between branches, and food cost variance that only surfaced at month-end when reconciliation could no longer be avoided.
This pattern is common, and it compounds quickly. With 8 locations and no restaurant inventory software connecting them, even small per-location inefficiencies produce significant group-level losses. A 2% over-purchasing error per location, multiplied by 8 sites across 52 weeks, is not a rounding problem.
The fundamental issue is information lag. Without live visibility, branch managers operate on assumptions. Purchasing decisions are not grounded in current stock levels. Inter-branch transfers do not surface automatically. And because no one is reconciling stock across the group in real time, problems accumulate invisibly until the accounting team runs the numbers.
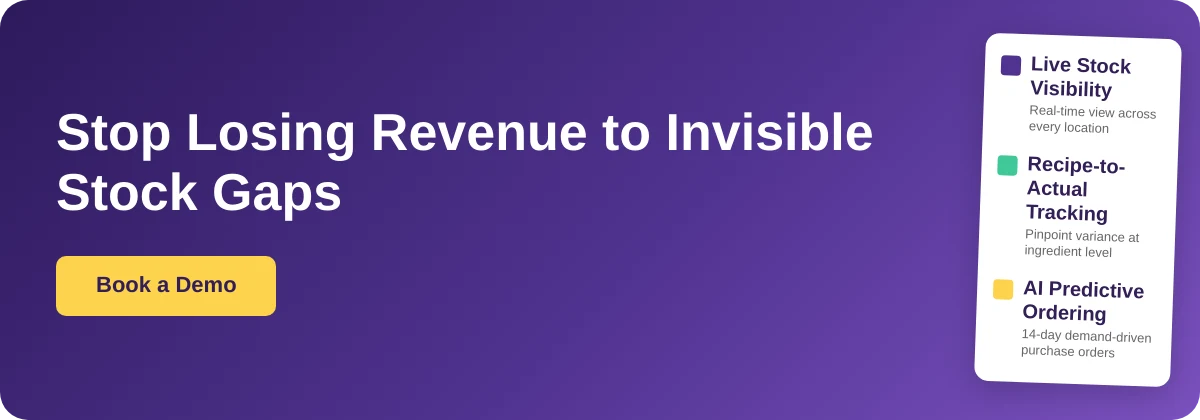
Food and beverage inventory software solves this by making the stock position visible to every stakeholder — branch manager, ops director, and finance team — from a single dashboard, updated continuously as sales deplete stock and deliveries replenish it.
What to ask when evaluating platforms: Does the software show stock position per location and at the group level simultaneously, or does cross-site visibility require a manual export and consolidation step?
Recipe-to-Actual Depletion: Closing the Food Cost Blindspot
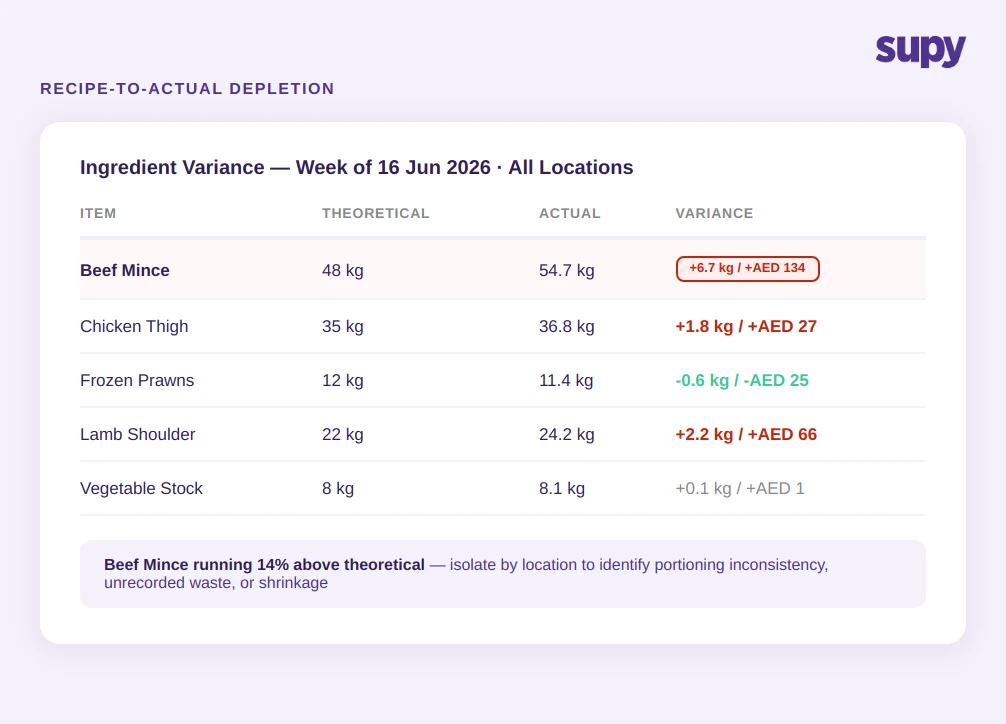
The most valuable capability in food cost management software is not the stock count. It is the comparison between what the kitchen should have consumed — based on what the POS sold — and what it actually consumed based on the stock count.
This is recipe-to-actual depletion, and it is the mechanism that converts a stock number into an actionable cost insight.
Without it, a food cost percentage of 38% tells you there is a problem. With recipe-to-actual depletion, you can see that the problem is concentrated in two ingredients across three locations, that it started in a specific week, and that it correlates with a change in prep staff. The number becomes a diagnostic tool rather than a lagging indicator.
Multi-site operators evaluating inventory management software for restaurants consistently identify this capability as the deciding factor. When food cost variance is invisible — when you cannot distinguish between portioning errors, unrecorded waste, and shrinkage — you cannot fix it. Recipe-linked inventory makes the source of variance visible for the first time.
What to ask when evaluating platforms: Can the platform show theoretical versus actual consumption at the ingredient level, per location, across a date range?
Automated Invoice Matching and Supplier Price Drift
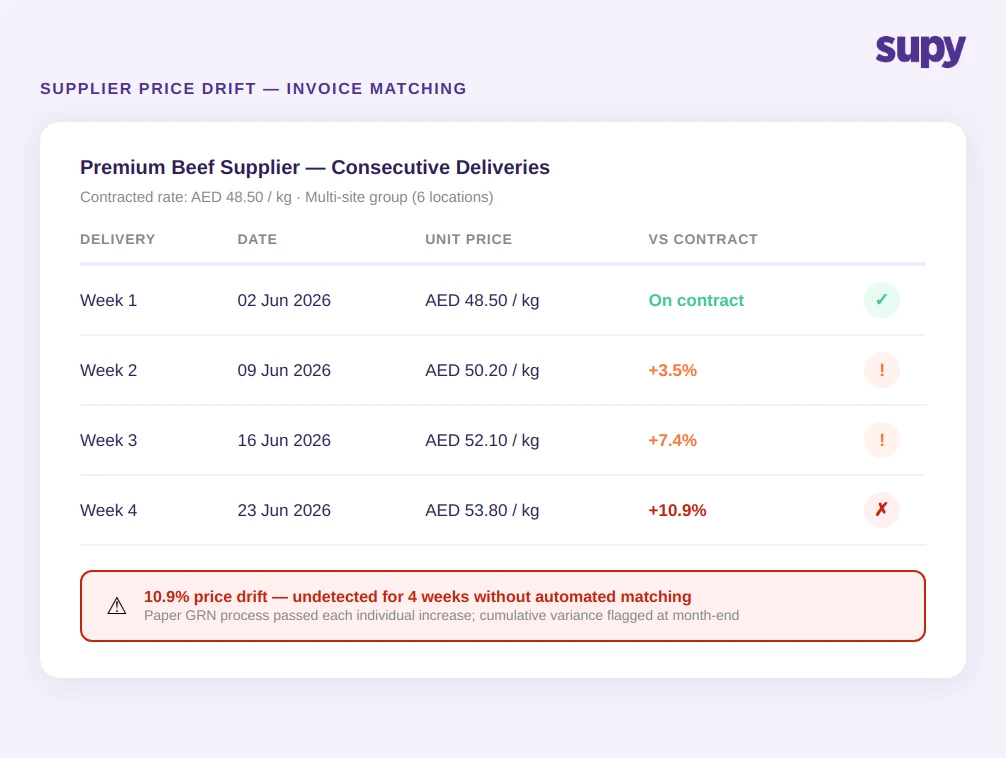
A multi-site F&B group described a pattern that is not unusual: supplier prices increasing incrementally across multiple deliveries, with each individual increase small enough to pass through a paper GRN process without triggering a review. By the time finance ran the month-end food cost analysis, actual spend was 8–12% above budget.
Manual invoice processing cannot reliably catch incremental price drift at volume. In a group receiving 40 to 60 deliveries per week across multiple sites, the cognitive load of checking every line item against contracted prices is not realistic.
Supplier management software with automated PO-to-invoice matching removes this dependency on manual checks. Each incoming invoice is compared against the contracted price in the system. Variances above a threshold are flagged automatically. Receiving managers approve matched invoices; only exceptions require review.
The outcome is not just cost control. It is audit trail completeness. When every purchase order, goods receipt note, and invoice is logged and matched in the system, the data exists to investigate any cost anomaly — which supplier, which product, which location, which week.
What to ask when evaluating platforms: Does the system perform automated PO-to-invoice price matching? At what variance threshold does it flag for human review?
Stock Counting That Does Not Eat 10 Hours Per Week
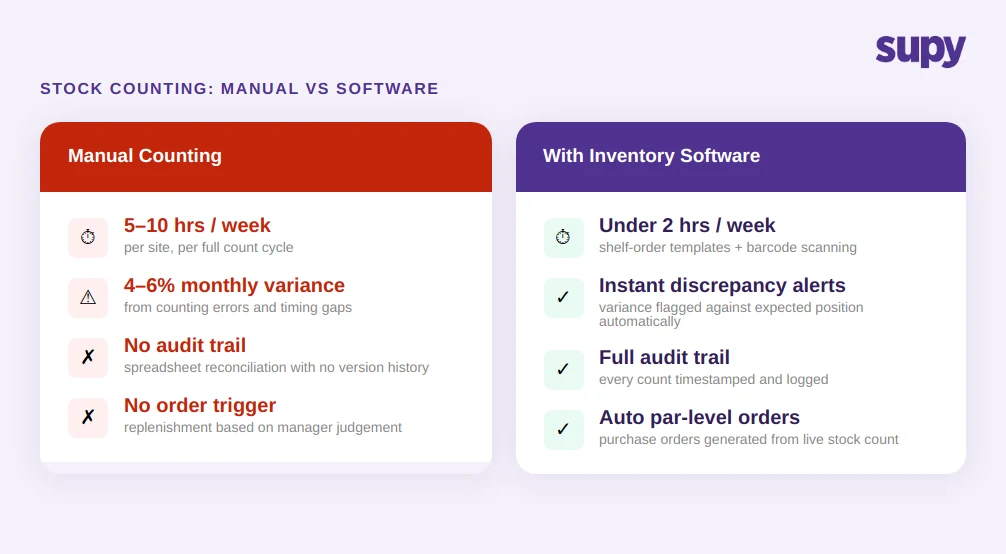
Manual stock counting across a multi-site operation is one of the highest-friction regular tasks in F&B operations management. A manager conducting a full count across a large kitchen typically spends 5–10 hours per week on the process — and the output is still vulnerable to human error, counting sequence problems, and timing gaps.
A multi-location QSR chain found that manual counting across branches was producing 4–6% monthly food cost variance. Managers were spending hours reconciling spreadsheets with no reliable audit trail. The root problem was not lack of effort. It was that the manual process had no way to catch its own errors.
Restaurant food waste tracking software that includes structured counting tools — shelf-order templates, barcode scanning, count-by-weight functionality — reduces both the time and the error rate. Counts follow a consistent sequence. Discrepancies from the previous count are flagged immediately.
For operations with par level inventory management in place, automated counting also enables par-based replenishment: when a stock count brings the system up to date, it can automatically generate purchase orders to bring items back to their par levels.
What to ask when evaluating platforms: Does the counting tool support shelf-order templates and barcode scanning? Does it flag count discrepancies against the expected position automatically?
What to Look For When Evaluating F&B Inventory Platforms
The category of food and beverage inventory software ranges from basic stock tracking add-ons to purpose-built multi-site platforms with AI-driven procurement. For groups operating five or more locations, the relevant capability threshold is higher than most entry-level tools reach.
Live stock visibility across all sites: The platform should show current stock position per location and at the group level, updating in real time as sales are recorded and deliveries are received. Visibility that requires a manual export or a 24-hour sync is not live visibility.
Recipe-linked depletion: Every item sold through the POS should automatically deplete the ingredients specified in the recipe. This is the foundation of real-time food cost percentage calculation.
Automated invoice receiving: The platform should match incoming invoices against purchase orders and flag price discrepancies without requiring manual line-item review. AI invoice scanning that processes supplier documents automatically — including credit notes — reduces receiving time and closes the supplier price drift gap.
Predictive ordering: AI-driven ordering that analyses sales patterns and par levels to generate purchase recommendations removes reliance on manager judgment. With a 14-day forecast horizon, procurement decisions are based on projected demand rather than current stock levels alone. Explore how AI predictive ordering works in practice.
Integrations: A platform that does not connect to your POS, accounting system, and supplier catalogues creates reconciliation work rather than eliminating it. Platforms with 75+ native integrations cover the vast majority of POS and accounting tools in use across GCC and MENA markets.
Multi-site transfer tracking: Stock movements between locations should be logged and matched automatically. Untracked inter-branch transfers are a primary source of phantom inventory variance in multi-site operations.