.jpg)


Restaurant Food Waste Tracking Software: A Practical Guide
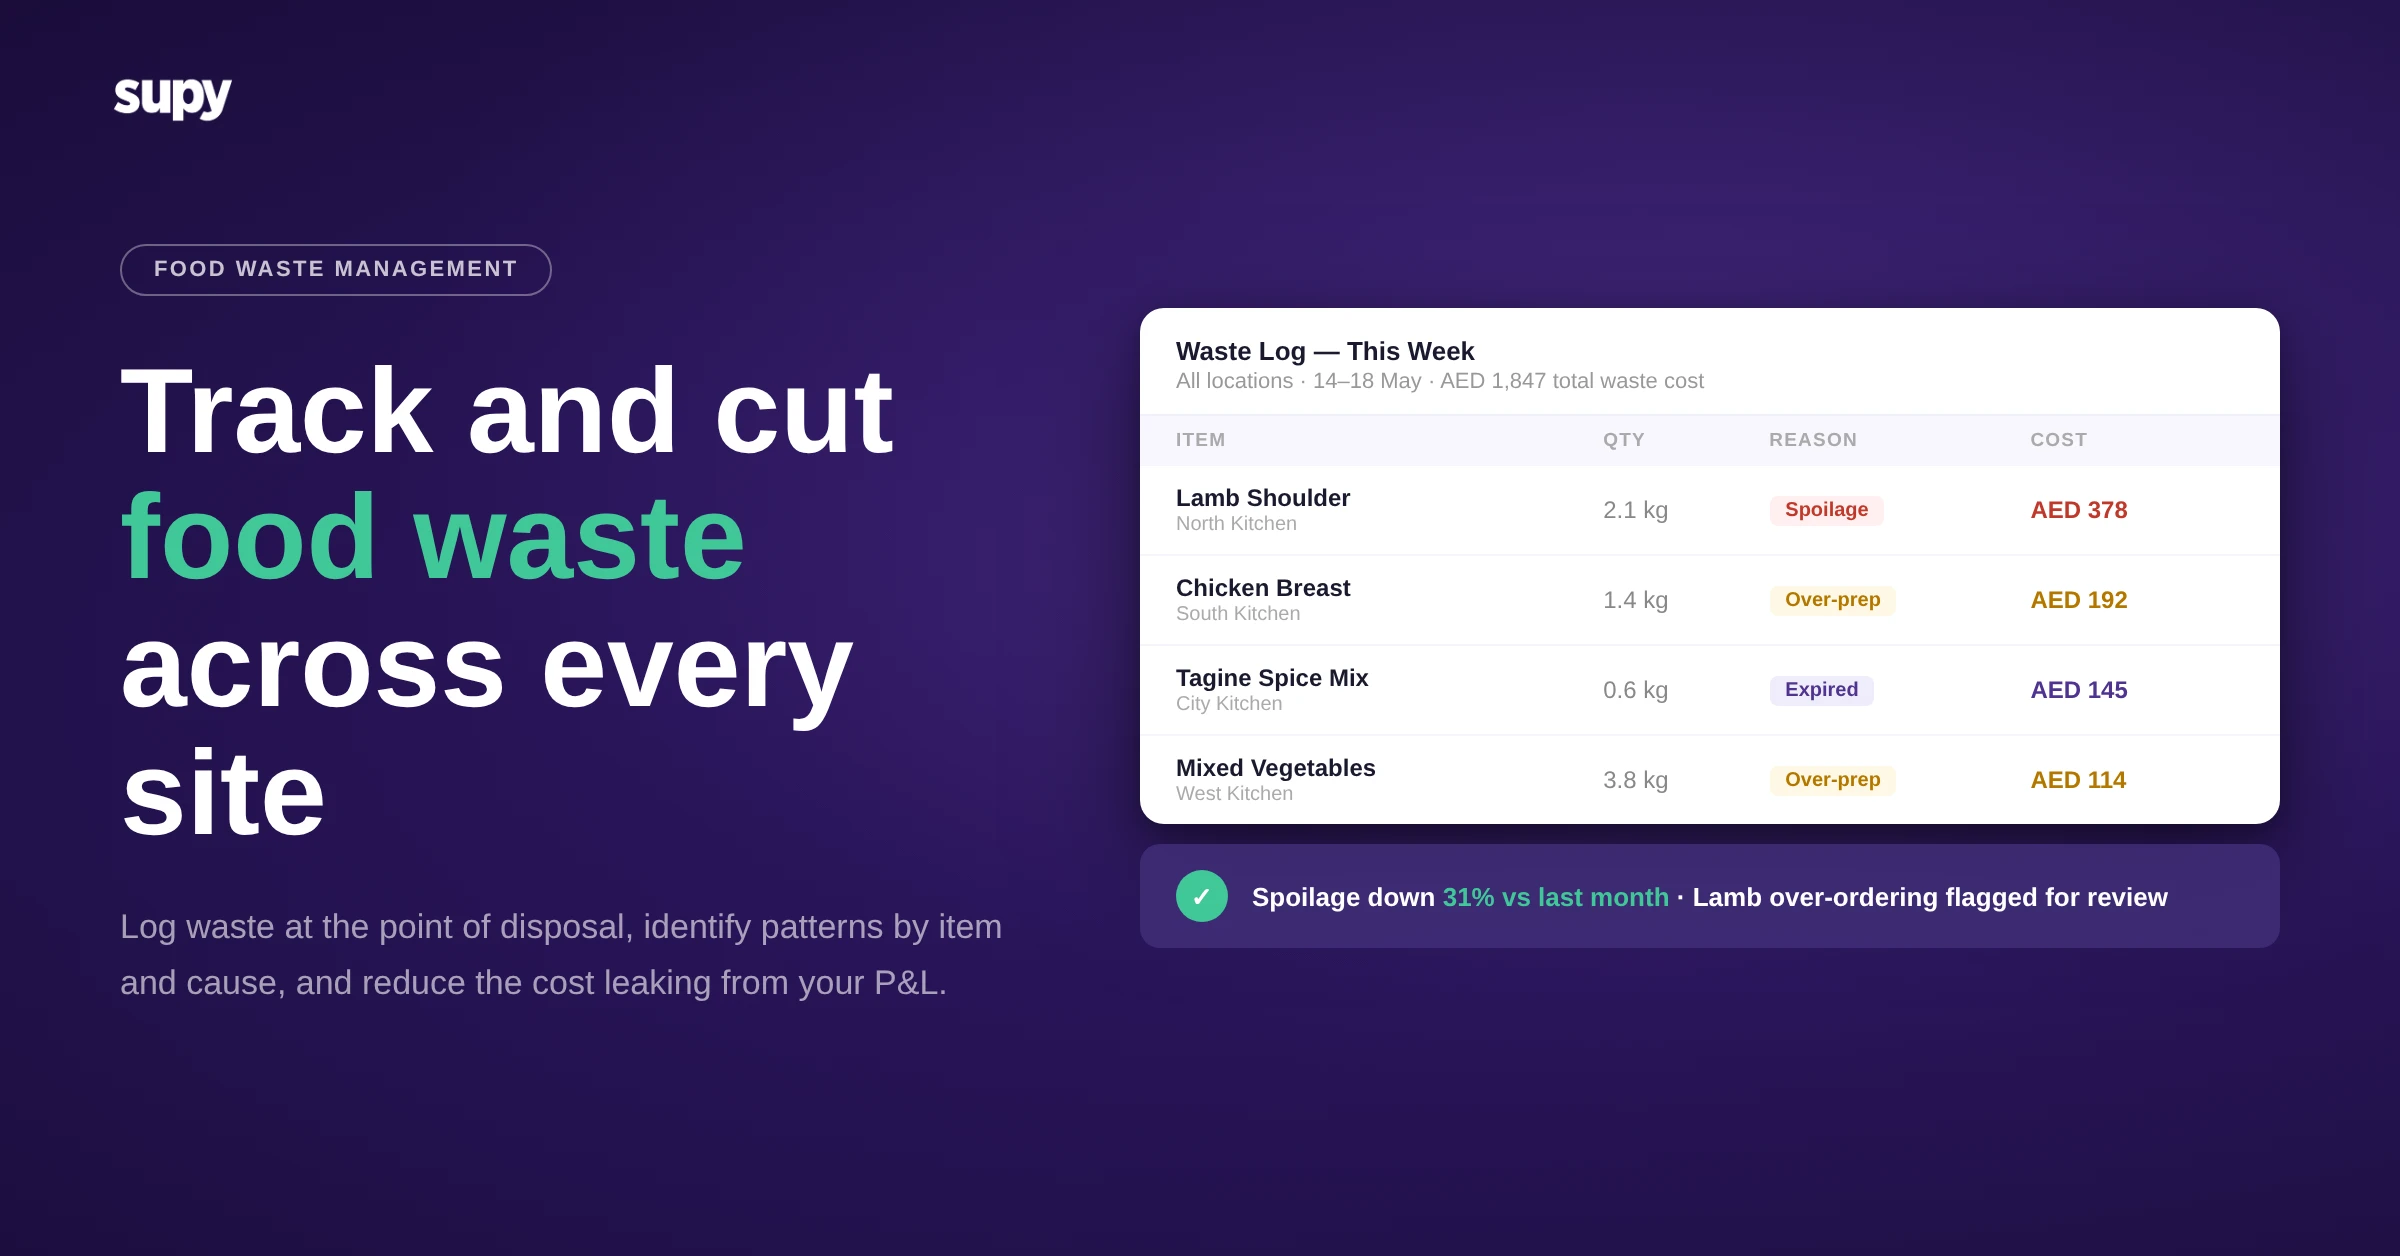
Why Paper Waste Logs Stop Working Past Three Sites
A single-site operator can run a paper waste log with reasonable discipline. A head chef reviews it daily, adjusts prep quantities, and the signal reaches the right person quickly. Once a group grows beyond three or four sites, that model breaks.
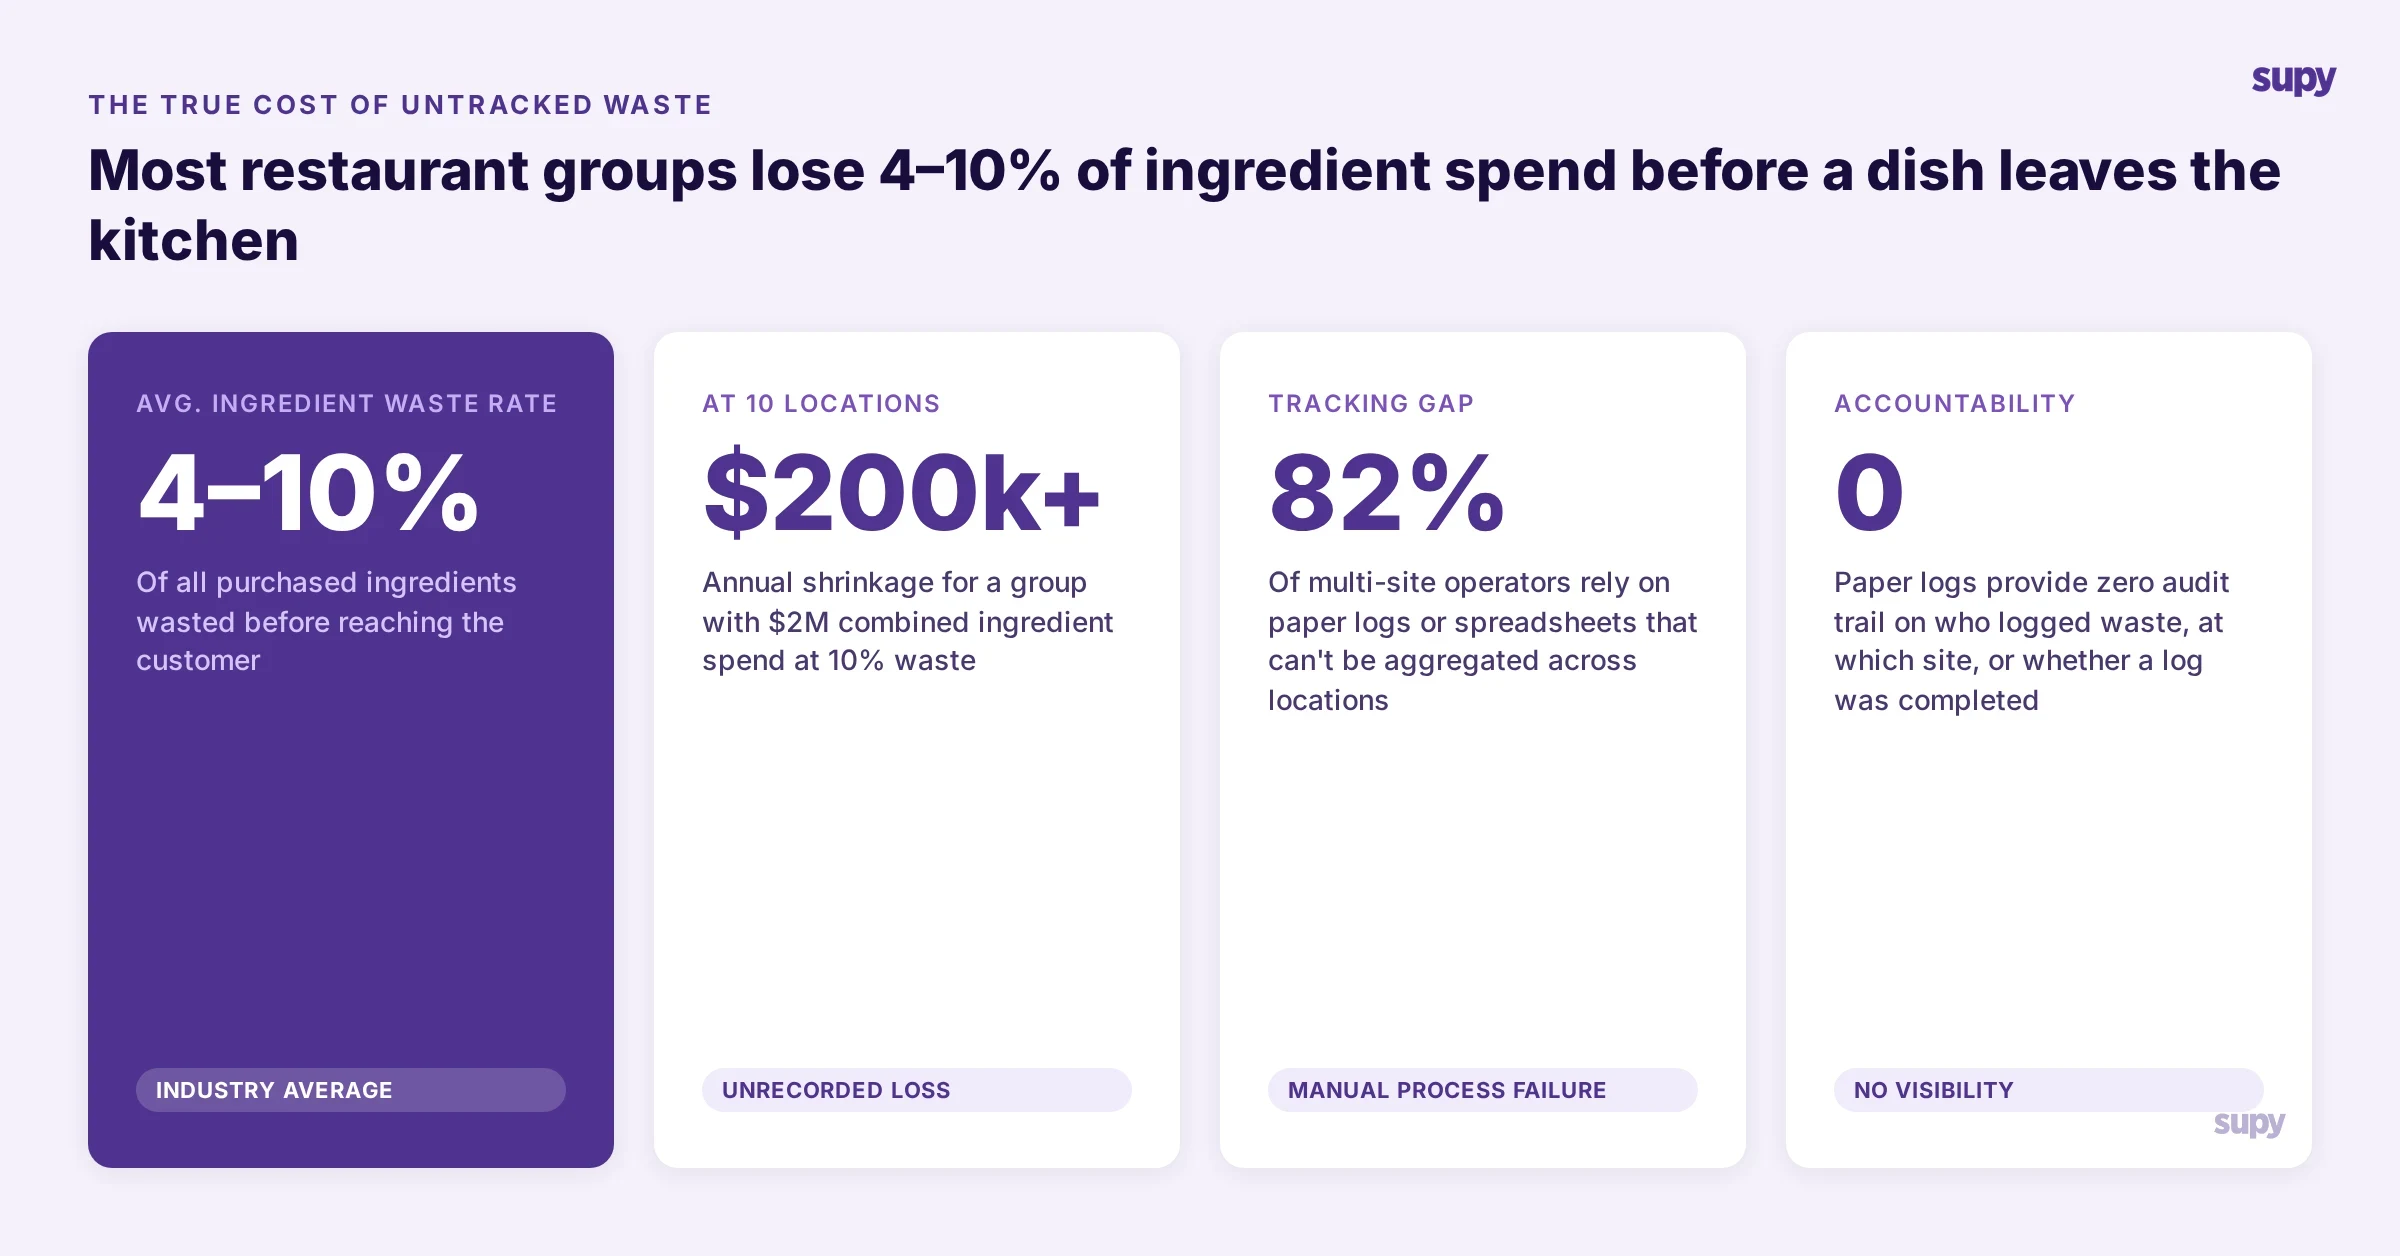
A 20-plus-site UK coffee and hospitality group evaluating Supy described the problem precisely: multiple distinct waste lists per site, ten or more team members per site each with different roles, and a hard requirement to manage and update those lists centrally across all locations. In practice, this meant dozens of paper formats, no consistent categorisation, and no way to compare waste events across locations. Draft templates were raised as a short-term workaround, but the operator rejected them: "it likely won't scale at site level."
The failure modes are predictable. When waste lists are managed per site, naming conventions drift. One location logs "trim waste" and another logs "prep offcuts" for the same activity. Cross-location aggregation becomes impossible. Accountability gaps appear: there is no record of who logged a waste event, at which location, or whether a log was completed at all that shift. A separate client flagged exactly this issue - they had no visibility on which team member created a wastage event via the mobile app, making it impossible to identify which site or team was logging waste and hold the right person responsible.
Software-based waste tracking solves the centralisation problem: one item master, one categorisation structure, one reporting layer - applied consistently across every site.
The Four Waste Categories That Drive Food Cost
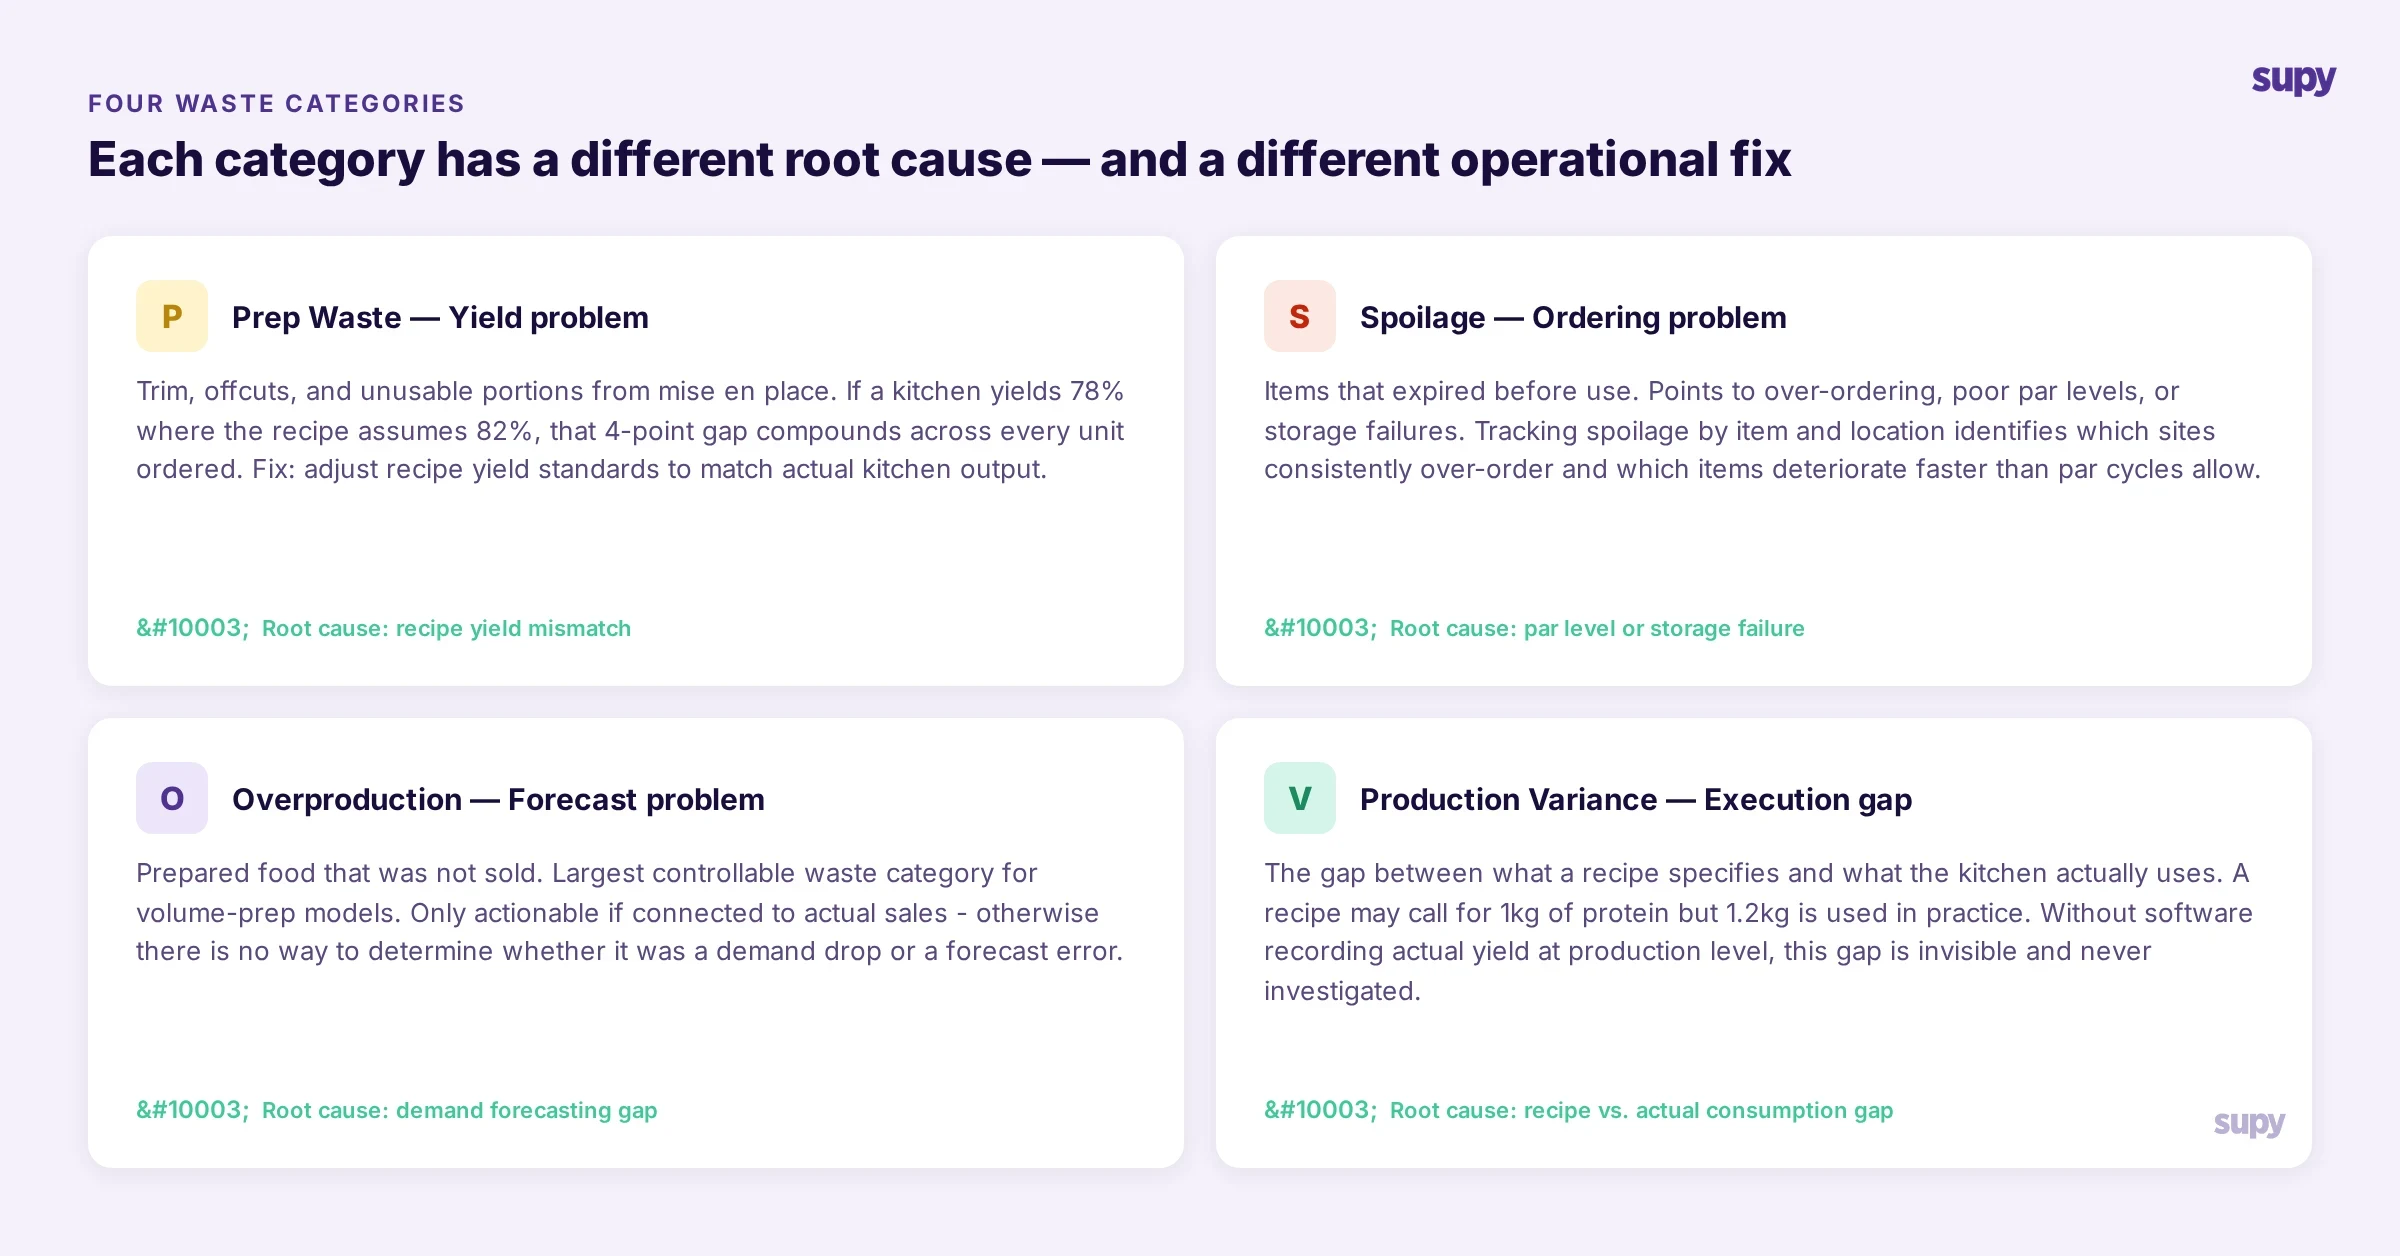
Not all food waste works the same way operationally. A practical waste tracking system needs to handle at least four distinct categories, because each has a different root cause and a different operational fix.
Prep waste is the trim, offcuts, and unusable portions generated during mise en place. It is predictable and, to a degree, acceptable. What matters is whether it stays within the expected yield range for a given item. If a kitchen consistently yields 78% from a product where the recipe assumes 82%, that 4-point gap compounds across every unit ordered.
Spoilage is waste from items that expired before use. This is an ordering and storage problem. Tracking spoilage by item and location identifies which sites are over-ordering, which items have consistently short shelf lives relative to par levels, and where storage conditions are causing early deterioration.
Overproduction is prepared food that was not sold. For operators running set-menu or volume-prep models, this is the largest controllable waste category. The data is only useful if it connects to actual sales figures - otherwise there is no way to determine whether overproduction was a forecasting failure or an unexpected demand drop.
Production variance is the gap between what a recipe specifies and what the kitchen actually uses. A food production operator working with Supy described the issue directly: a recipe specifies 1 kg of meat yields 10 pieces, but in practice 1.2 kg is used to produce the same quantity. Without software recording actual yield at the production event level, the recipe standard becomes fictional. The cost database shows theoretical consumption; the actual inventory depletion shows something different. That gap never gets investigated because it is never visible.
Connecting Waste Tracking to Actual vs Theoretical Food Cost
Standalone waste logs miss the most important use of waste data: connecting it to food cost variance.
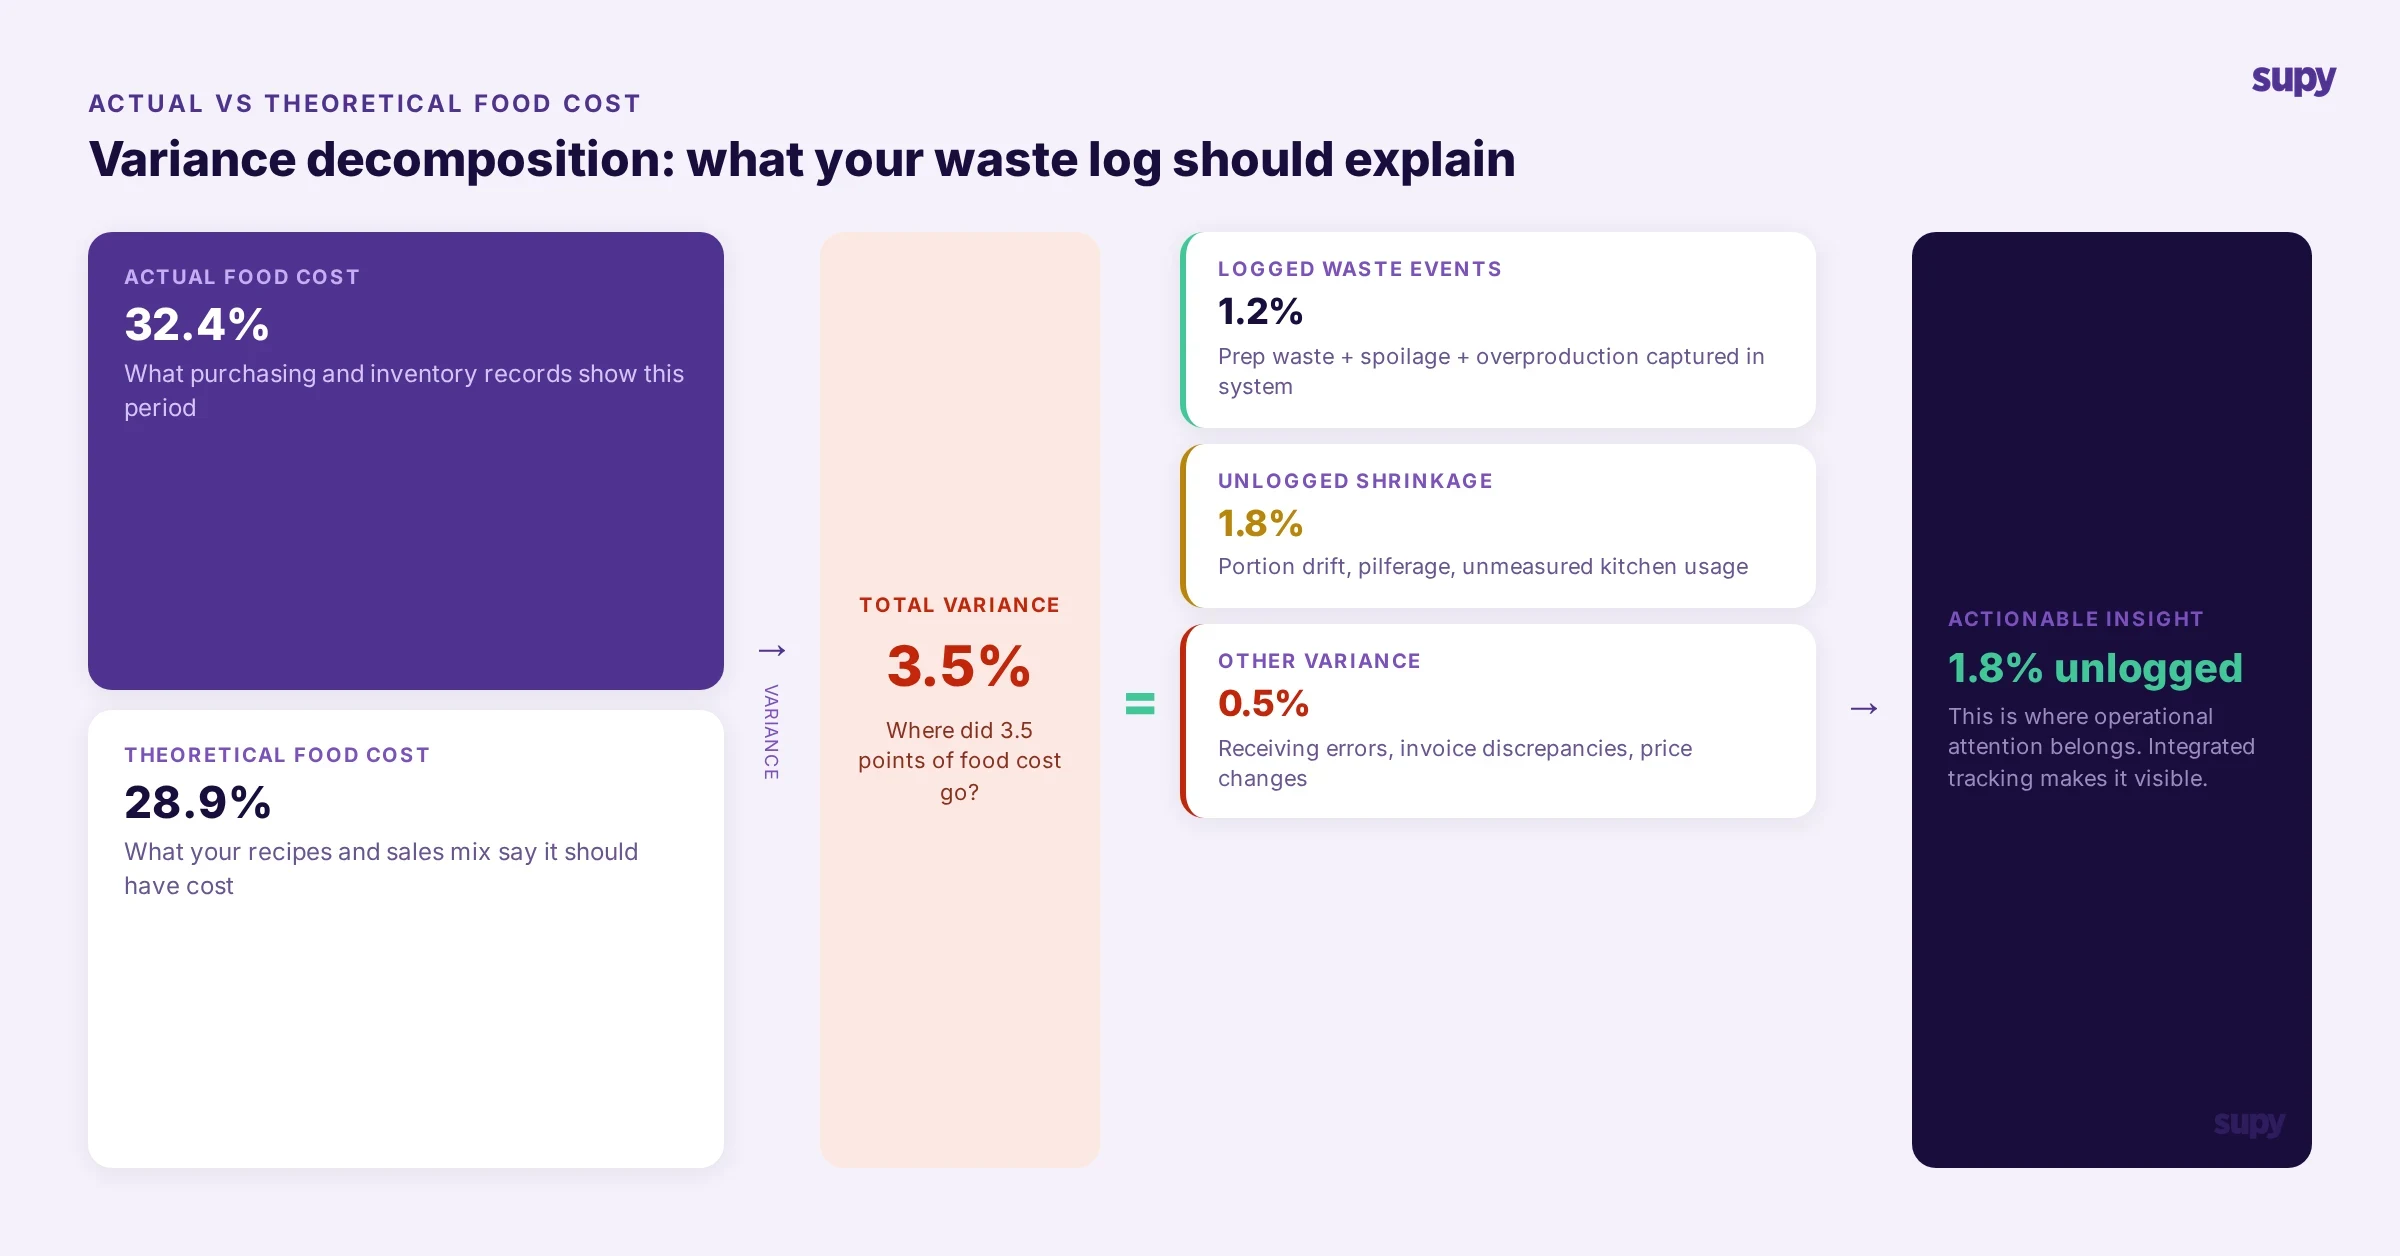
Theoretical food cost is what your menu should cost to produce, calculated from recipe standards and actual sales. Actual food cost is what your purchasing and inventory records show. The difference between the two is where waste lives. But variance is not only waste. It is also theft, portion drift, recipe non-compliance, receiving errors, and supplier price changes. A waste log that sits outside your inventory and recipe costing system cannot help you decompose the variance. It records that waste happened. It cannot tell you whether this week's 3-point overspend was logged prep waste, unlogged kitchen shrinkage, or a supplier invoice discrepancy.
Integrated waste tracking closes that loop. When a wastage event is logged in the same system that holds your recipe database and your inventory counts, the system can show you how much of this period's variance was logged waste, how much was unlogged shrinkage, and which locations are consistently running above theoretical cost with no corresponding waste entries. The unlogged gap is where operational attention belongs.
A Melbourne-based multi-venue hospitality group with 20 sites made this requirement explicit: automated weekly reports per location and consolidated, including variance reports showing ideal versus actual costs and waste, supplier purchase reports, and opening and closing stock figures - generated automatically each Tuesday, covering all 20 sites individually and one consolidated company-level summary. At 20 sites, manual reporting aggregation has already broken down. The requirement is automated, location-level intelligence delivered on a fixed schedule.
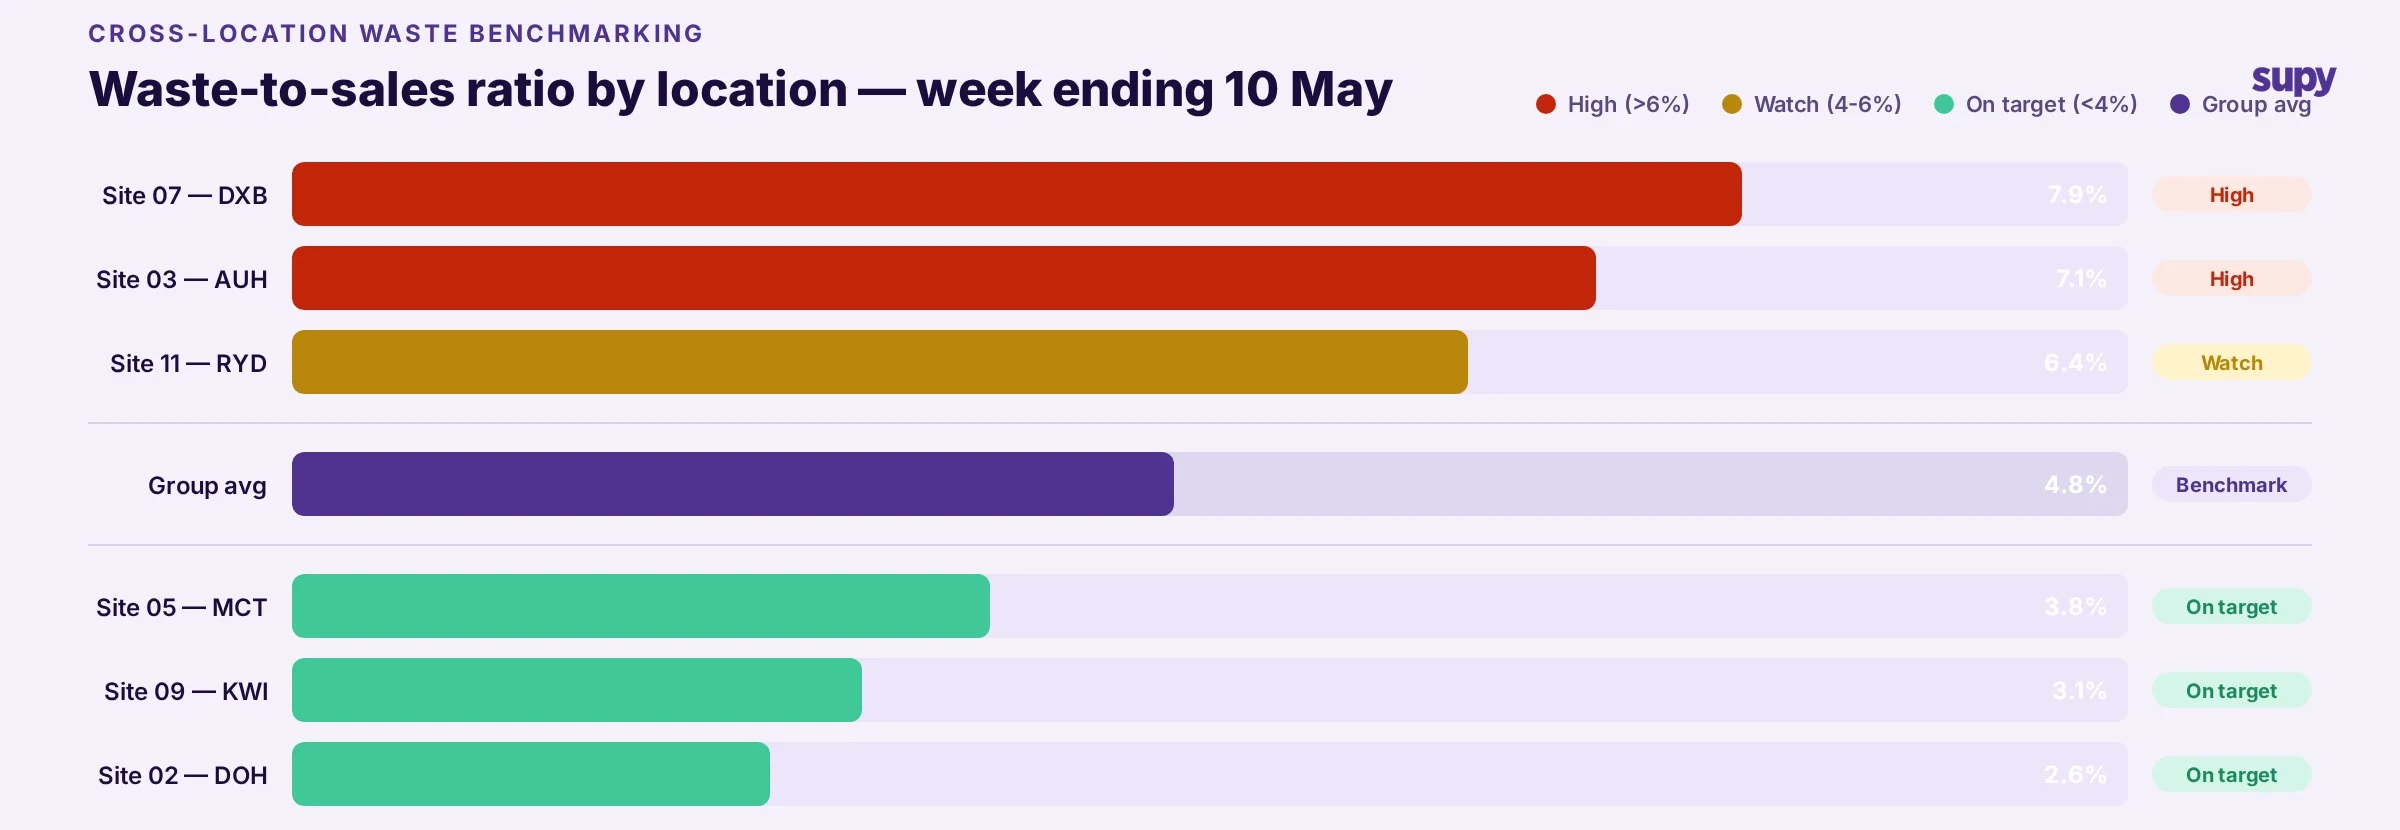
Cross-Location Waste Benchmarking
Single-site waste data tells you whether this week is better or worse than last week. Cross-location data tells you whether your worst-performing site has a training problem, a staffing problem, a storage problem, or a menu problem.
A group running ten or more locations needs to rank sites by waste-to-sales ratio, by category, and by trend. If sites 3, 7, and 11 are consistently running spoilage rates twice the group average, there is an operational pattern to investigate. If every site spikes on prep waste on Tuesdays, something in the prep schedule is misaligned with Tuesday demand.
Benchmarking requires consistency: the same waste categories, logged the same way, at every location. A bakery and central kitchen group operating across multiple markets raised a related problem - they had accumulated many wastage categories and needed to display only the relevant waste types per context, because all wastage types were visible regardless of location or team. This created noise when logging at scale. The fix is centralised waste list management with location-level or role-level filtering, so each team sees only the categories relevant to their station - a configuration capability that single-site tools do not offer.
The same group also flagged the need for item codes to be visible when creating wastage events on mobile, alongside production and transfer events. Production teams working across hundreds of SKUs navigate the item master by code rather than name. Logging waste accurately at scale requires the same operational precision as receiving and production - not a simplified interface designed for single-outlet use.
Waste Tracking for Non-Standard Service Models
The most common restaurant food waste tracking use case is logging items thrown away at the end of service. Some service models require waste tracking to serve a completely different function.
A 21-store conveyor belt sushi group in Australia operates on a model where individual dishes are not ordered a la carte. Plates move on a belt throughout service and checkout records only the plate colour - a price tier, not a specific SKU. POS-based ingredient depletion is impossible: the system has no record of which dishes were consumed during service.
The operational fix: at the end of each service period, the team creates a wastage event and enters all ingredients consumed during that session. The wastage event functions not as a record of discarded food but as the primary production consumption record for the entire service. It is the only mechanism that reconciles ingredient usage against inventory.
No standalone waste tracking tool is built for this. It requires a system where wastage events are first-class operational records connected to the item master, inventory counts, and recipe costing - not a parallel log running outside the back-of-house stack.
What to Look for in Restaurant Food Waste Tracking Software
For a multi-site restaurant group evaluating waste tracking software, the key criteria are:
Central waste list management with location-level or role-based filtering. Teams working across hundreds of SKUs - particularly in central kitchen or production environments - need to see the items relevant to their station. Item codes alongside item names during mobile waste logging are a practical requirement for production teams, not a nice-to-have.
Wastage events that connect to inventory and recipe costing. A waste entry that adjusts inventory in real time and feeds into actual-versus-theoretical variance reporting is fundamentally more useful than a log that sits outside the system. This connection is what makes waste data actionable rather than historical.
Audit trails with individual accountability. Who logged the waste event, at which location, at what time. For a group running compliance and performance reporting across multiple sites, this is not optional.
Automated multi-location reporting. Waste data that requires manual aggregation across sites will not be used consistently. Scheduled reports per location and at group level, covering variance, waste by category, and stock movement, are the baseline requirement at 10-plus sites.
Supy's wastage tracking module covers all of these requirements. Wastage events connect directly to inventory depletion and actual food cost reporting. Categories are managed centrally and filtered by location or team. Audit trails record the individual who logged each event. Cross-location reporting is built into the platform - not a manual export process. If your group is evaluating restaurant inventory software as part of a broader back-of-house review, book a demo to see how the wastage module connects to recipe costing, procurement, and multi-location reporting.

