.jpg)


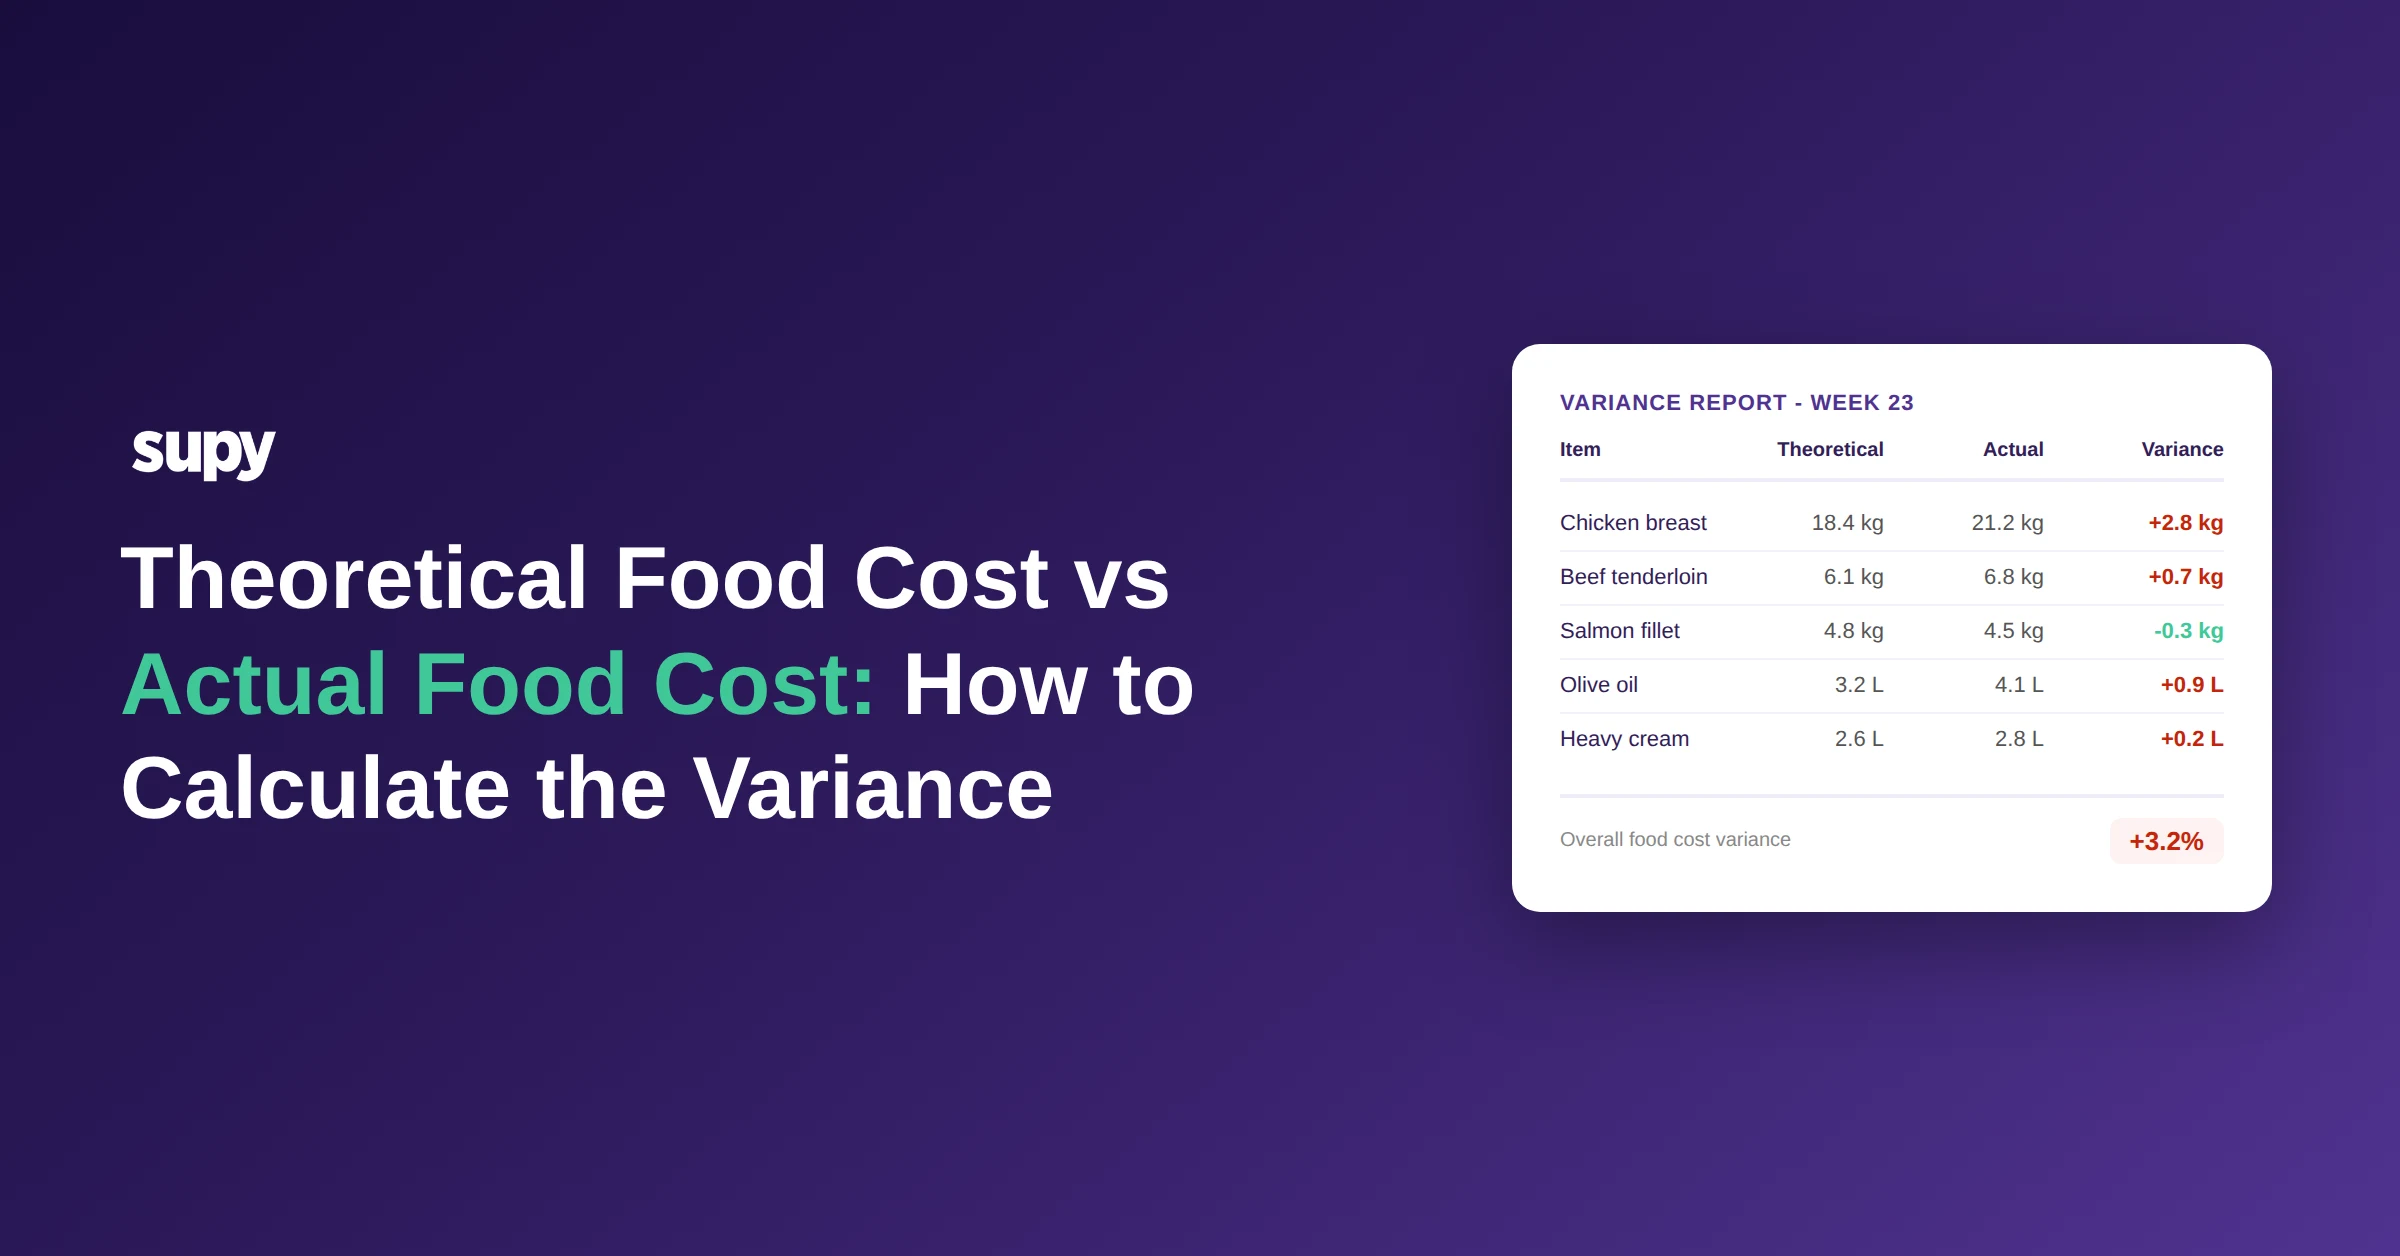
Theoretical Food Cost vs Actual Food Cost: How to Calculate the Variance and Close the Gap
Most restaurant operators can tell you their actual food cost percentage. Very few can tell you what it should have been. That gap - between what the kitchen actually spent and what the recipes say it should have spent - is where margin leaks hide. Operators who close that gap consistently do not rely on end-of-month reports; they maintain a live theoretical baseline and investigate every variance above 2%. This guide builds the theoretical food cost framework from scratch, walks through the variance calculation with real numbers, and covers the five causes to investigate when the gap widens.
Theoretical food cost is the cost your kitchen should incur based on what was sold and what each recipe costs to produce. It is calculated by multiplying the recipe cost per portion by the number of portions sold for every menu item, then dividing by total revenue. Actual food cost, by contrast, measures what the kitchen actually consumed based on stock movements: opening inventory plus purchases minus closing inventory, divided by revenue. The difference between the two is the variance - and it is the single most useful diagnostic number in back-of-house operations.
What Is Theoretical Food Cost?
Theoretical food cost represents a perfect-world scenario. If every dish were portioned exactly to spec, no ingredients were wasted, no stock went missing, and every recipe card reflected current supplier prices, your theoretical and actual food cost would match precisely.
The calculation is straightforward:
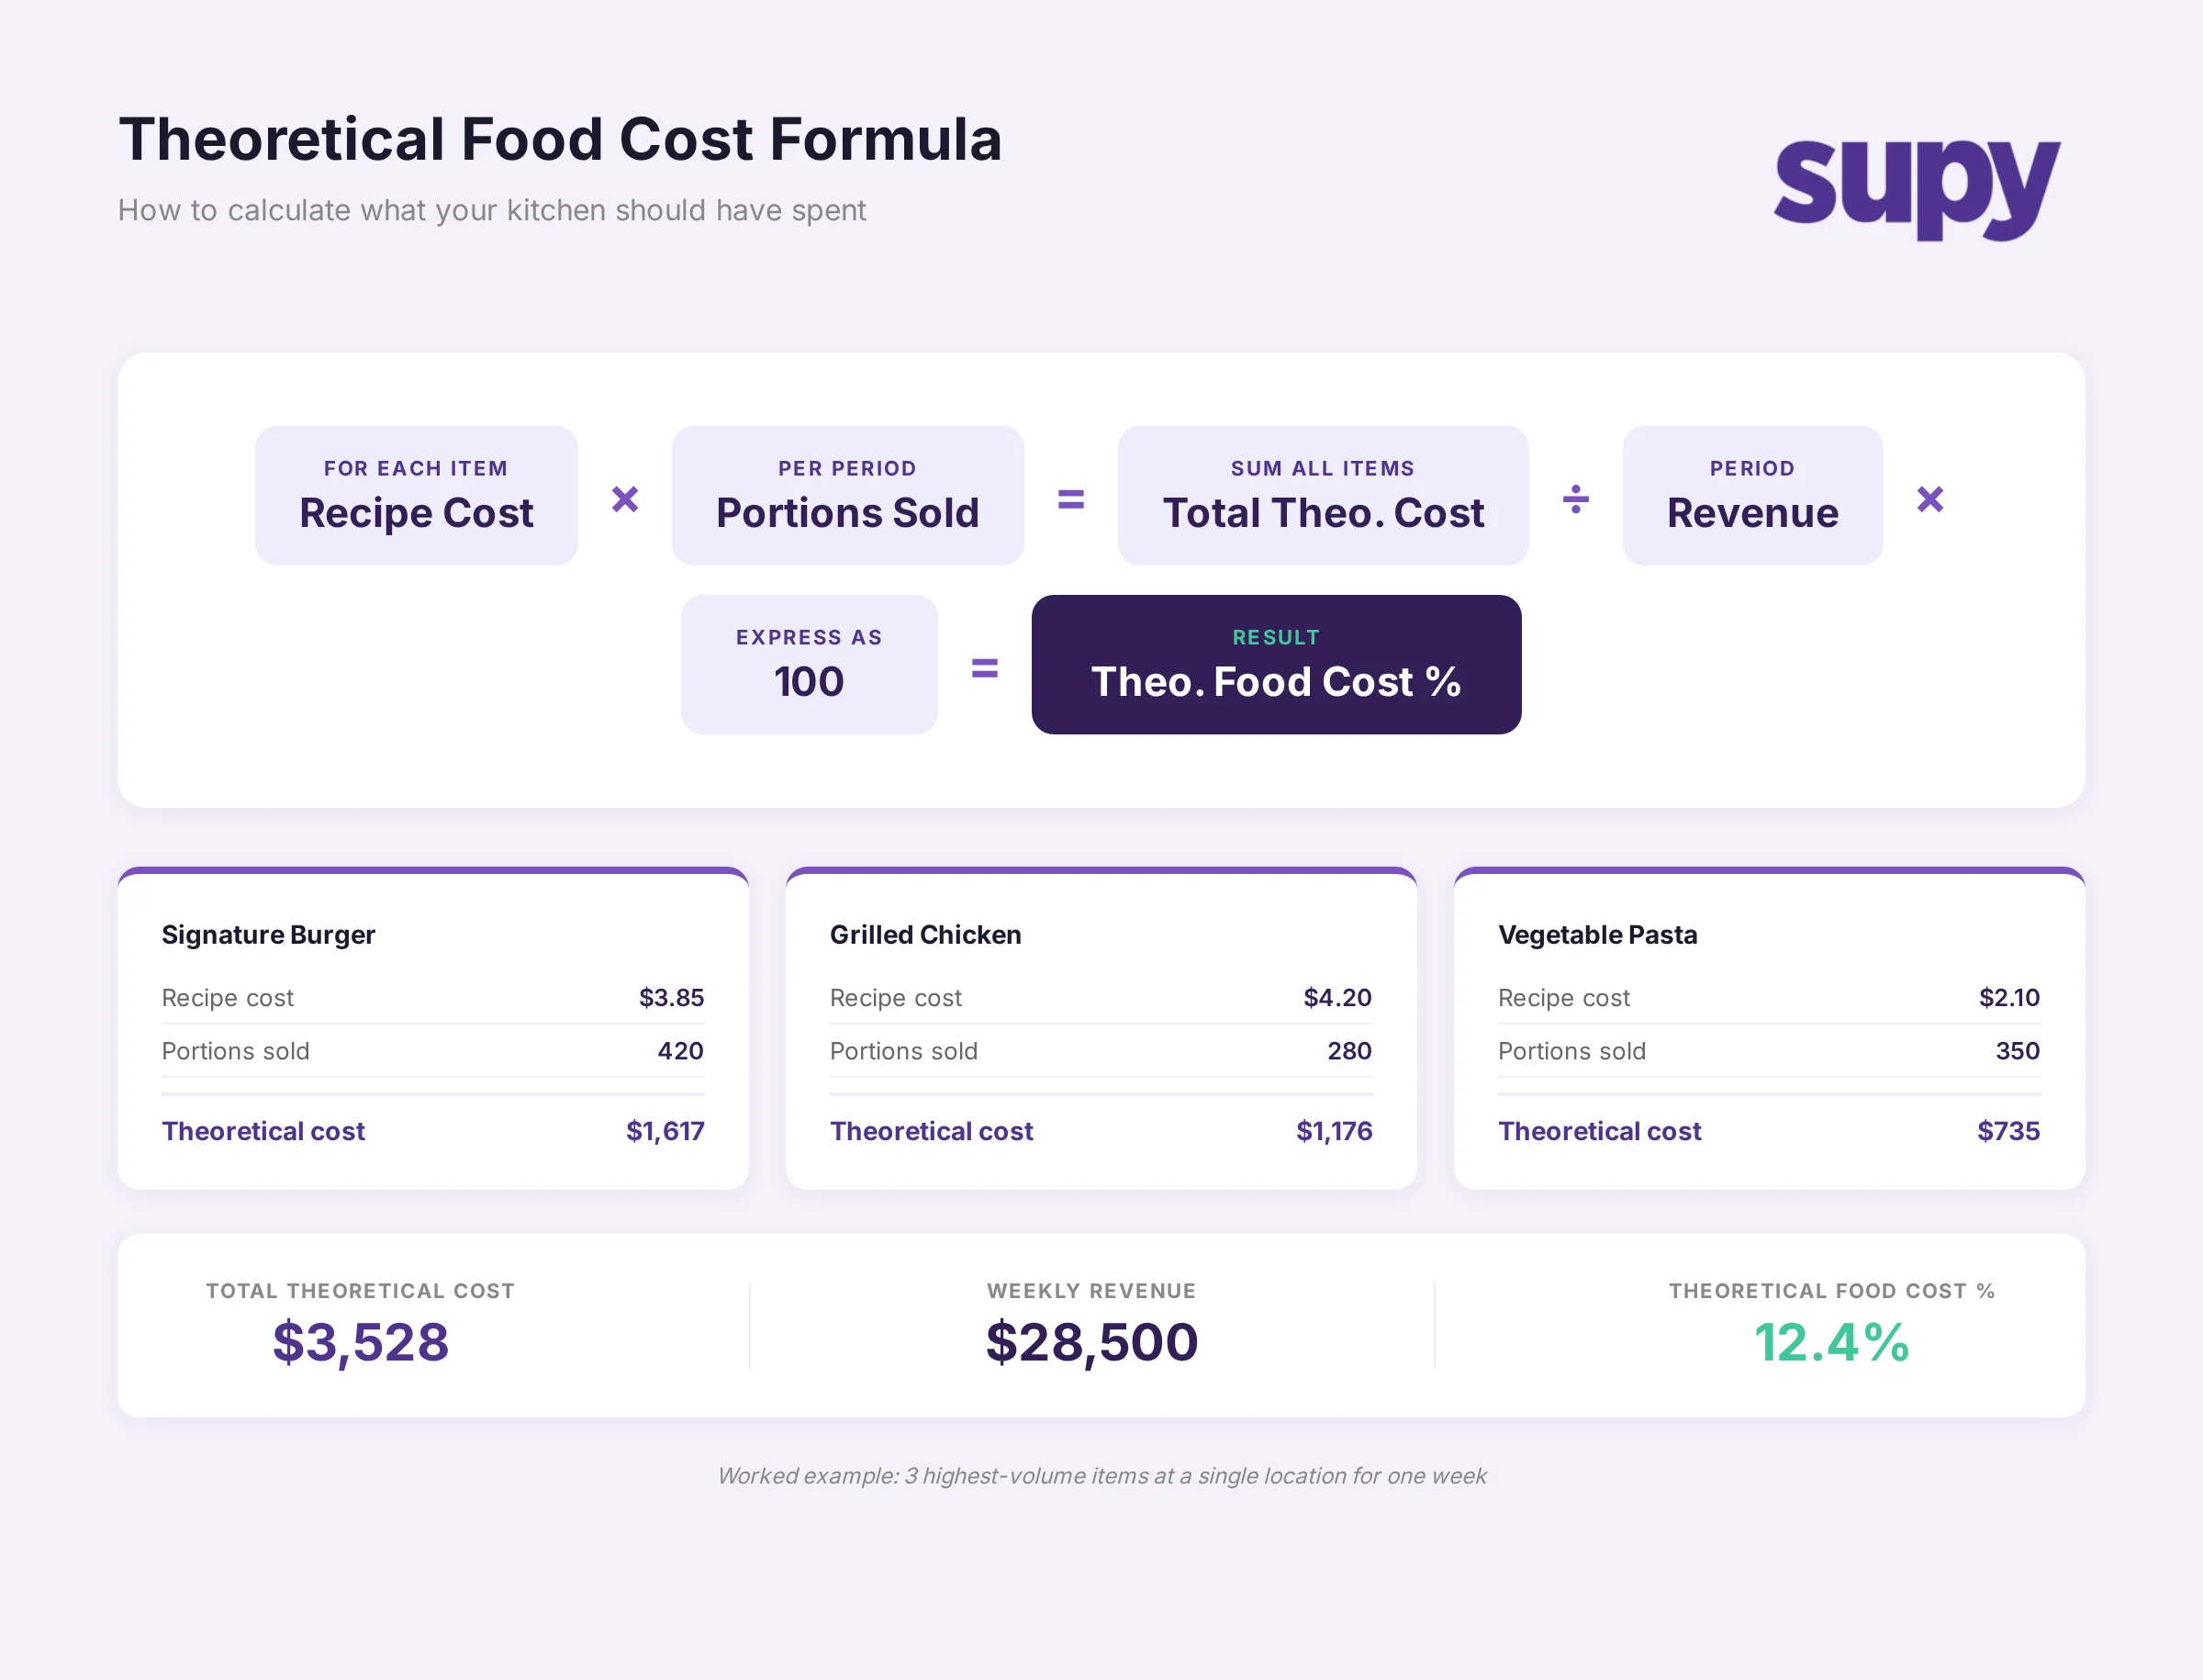
Theoretical Food Cost = Sum of (Recipe Cost per Portion x Portions Sold) / Total Revenue x 100
For each menu item, you multiply the recipe cost by the number of covers sold during the period. Sum those figures across the entire menu, divide by total revenue, and express it as a percentage.
The challenge is not the maths. It is maintaining an accurate recipe cost. If your chicken supplier increased prices three weeks ago and your recipe cards still reflect the old price, your theoretical baseline is already wrong. Across operators on the platform, a common pattern is that theoretical cost drifts silently for weeks before anyone notices - because the recipes are not connected to live purchase data.
A head of operations at a multi-site hospitality group put it directly: "The biggest thing that we need to work on is always making sure our theoretical margin is right, because that's something I find we struggle with." That struggle is nearly universal among growing restaurant groups.
How to Calculate Theoretical Food Cost: A Worked Example
Consider a casual dining operator running three locations under a single brand - call them Northside Trading Co. During a typical week, one location sells 420 covers of their signature burger (recipe cost $3.85 per portion), 280 covers of grilled chicken (recipe cost $4.20), and 350 covers of a vegetable pasta (recipe cost $2.10). Total revenue for the week is $28,500.
Step 1 - Calculate theoretical cost per item:
- Burger: 420 x $3.85 = $1,617
- Grilled chicken: 280 x $4.20 = $1,176
- Vegetable pasta: 350 x $2.10 = $735
Step 2 - Sum all items:
Total theoretical cost = $1,617 + $1,176 + $735 = $3,528
(In practice, you would include every menu item. This simplified example covers the three highest-volume dishes.)
Step 3 - Express as a percentage of revenue:
Theoretical food cost % = $3,528 / $28,500 x 100 = 12.4%
This tells the operator that, in a perfect world, food cost for those three items should be 12.4% of revenue. When the full menu is included, the figure typically lands between 25% and 35% depending on the concept.
In Supy, recipe cards store the cost per portion and update automatically when supplier prices change. The platform multiplies recipe cost by POS sales data to generate the theoretical food cost figure without manual calculation - so the baseline stays current even when ingredient prices move weekly.
What Is Actual Food Cost and How to Calculate It
Actual food cost percentage measures what the kitchen genuinely consumed during a period, regardless of what should have been consumed. The standard formula is:
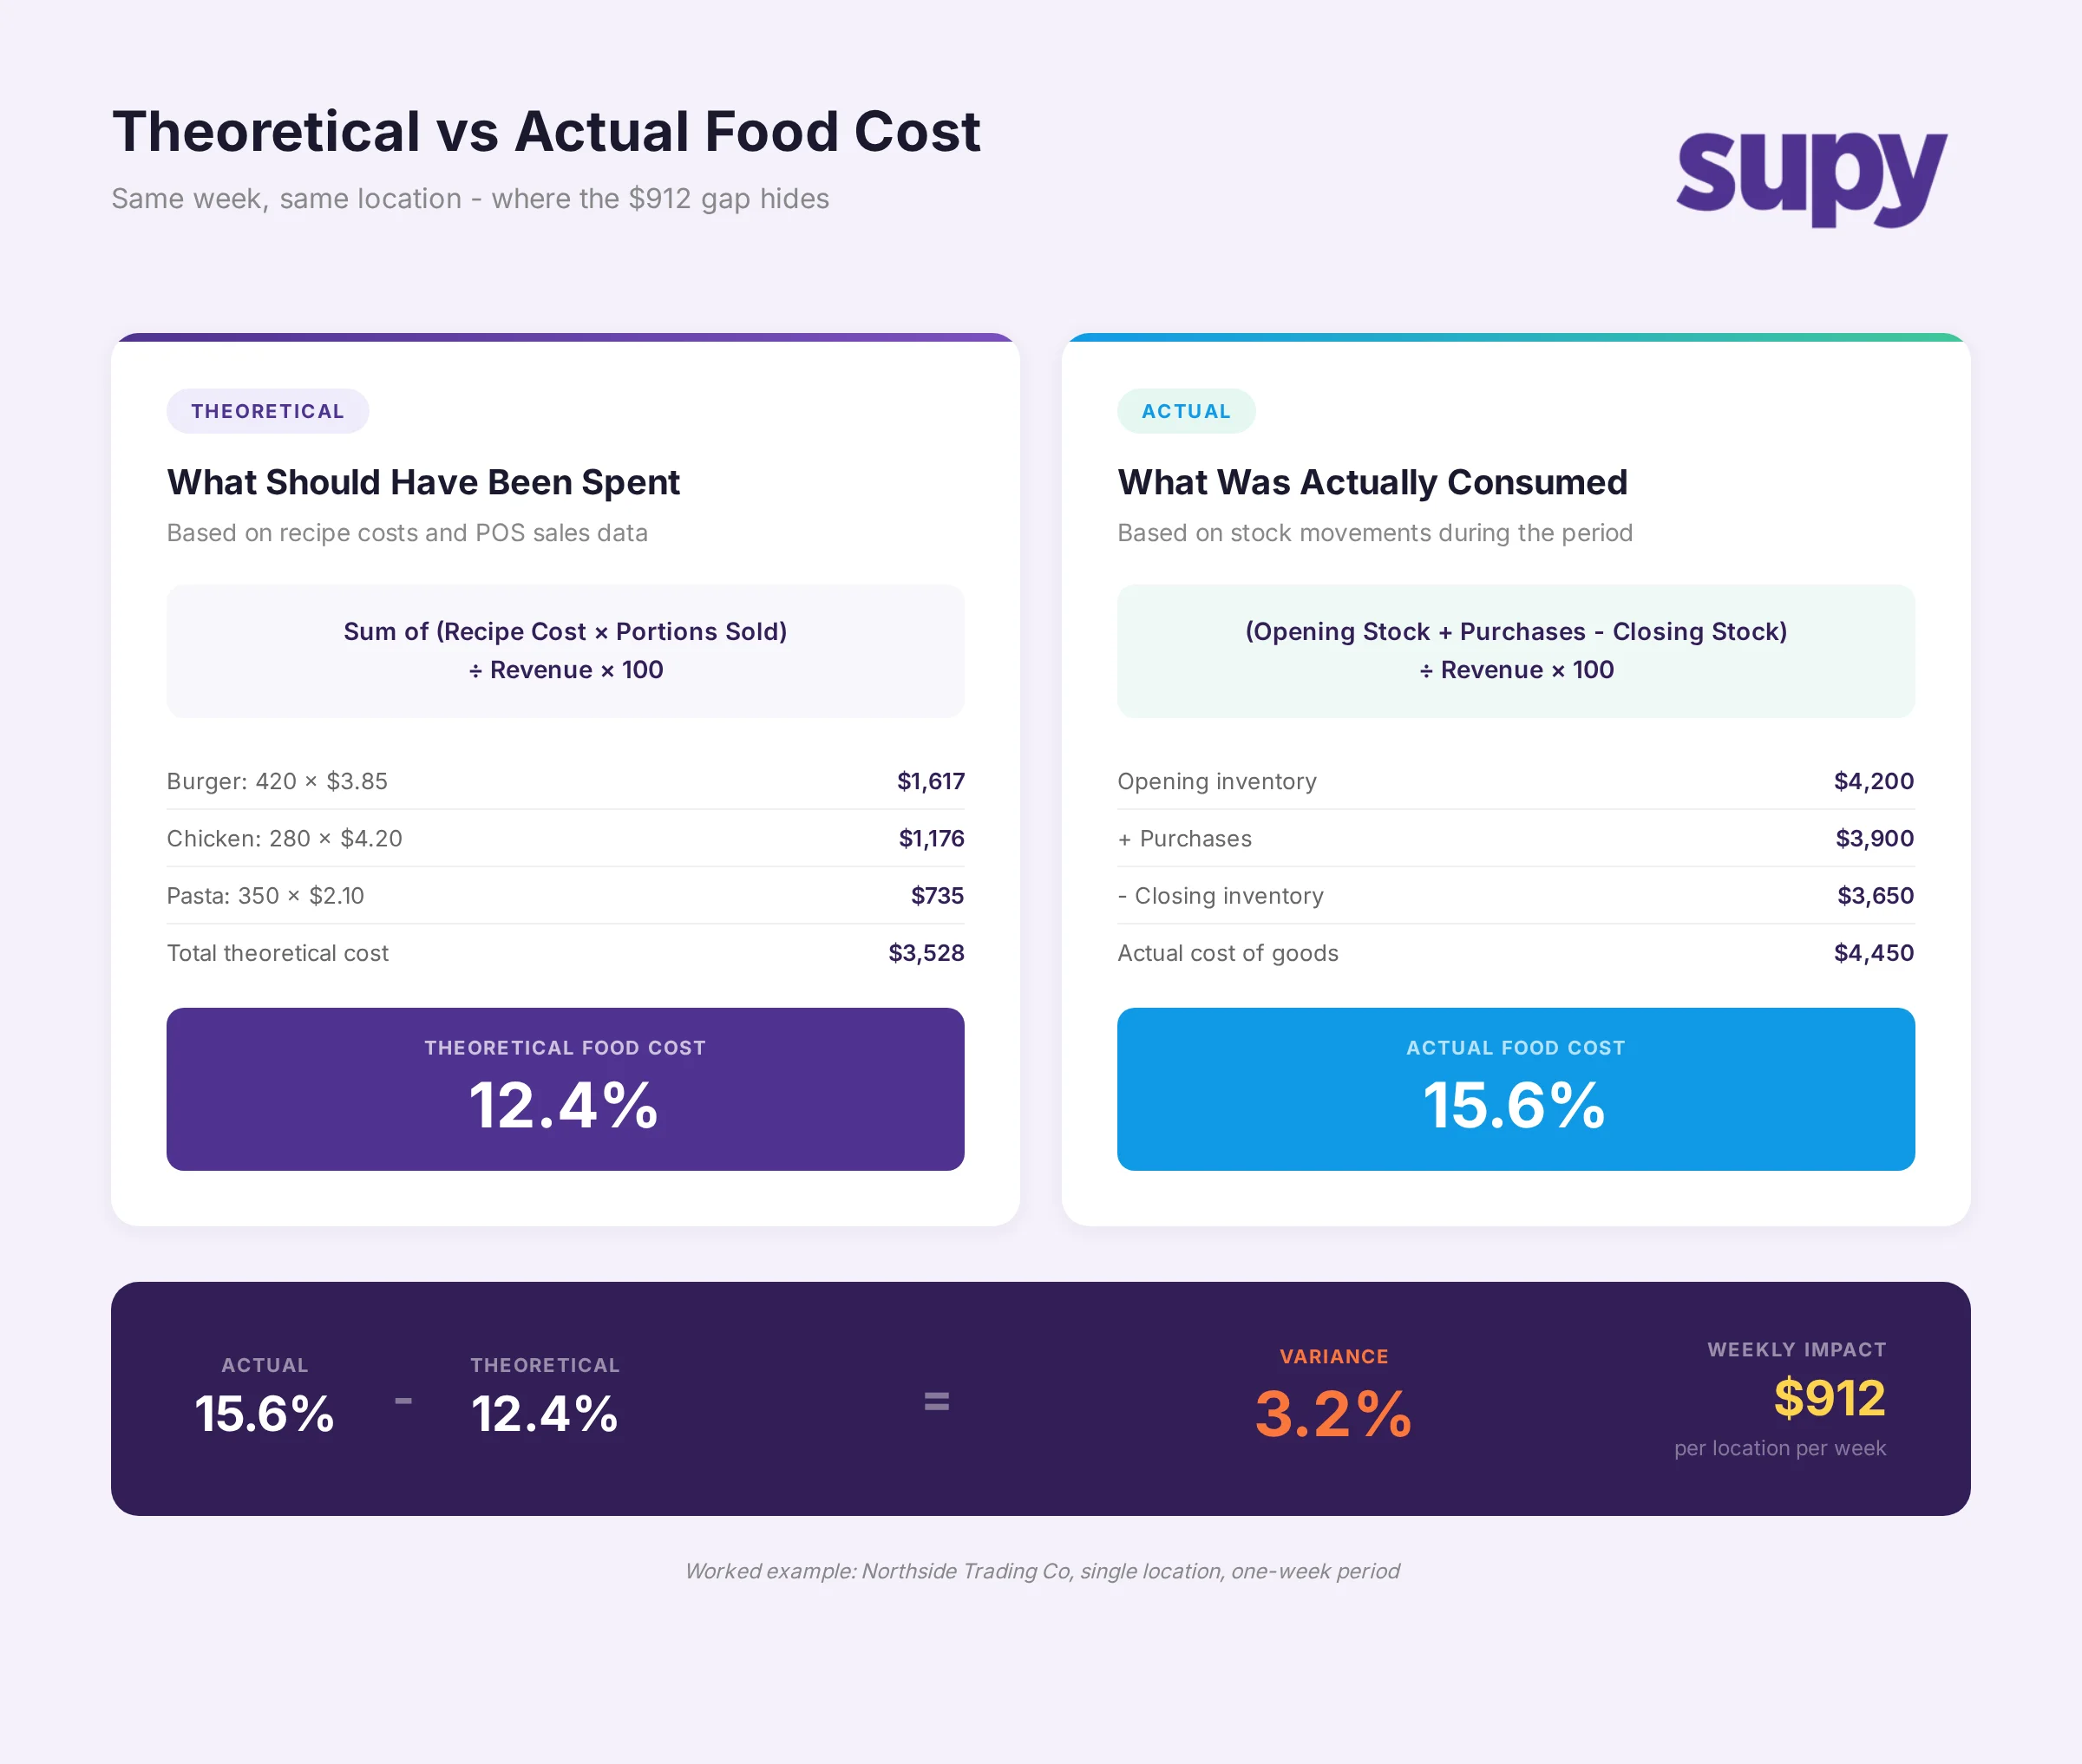
Actual Food Cost = (Opening Inventory + Purchases - Closing Inventory) / Revenue x 100
Using the same Northside Trading Co example: if that location started the week with $4,200 in stock, purchased $3,900 in ingredients, and ended the week with $3,650 in stock, the actual food cost is:
($4,200 + $3,900 - $3,650) / $28,500 x 100 = 15.6%
The difference between 12.4% theoretical and 15.6% actual is a 3.2 percentage point variance - representing $912 in unexplained food cost for a single location in a single week. Across three locations over a month, that gap could exceed $10,000.
This is the number that separates operators who manage food cost from operators who merely report it.
How to Calculate the Variance
The food cost variance formula is:
Variance = Actual Food Cost % - Theoretical Food Cost %
In the Northside Trading Co example: 15.6% - 12.4% = 3.2 percentage points.
Some operators express variance as a proportion of theoretical cost: (15.6 - 12.4) / 12.4 x 100 = 25.8%. This tells you the kitchen spent 25.8% more than the recipes predicted - a sharper framing when presenting the number to ownership.
The important thing is consistency. Pick one method, apply it across all locations, and track it weekly. Monthly variance reviews miss too much. By the time you discover a 4% gap at month-end, four weeks of margin have already leaked.
Supy calculates variance automatically by comparing POS-driven theoretical cost against actual stock movements, location by location. The variance report surfaces the gap daily rather than monthly, so operations teams can investigate while the trail is still fresh.
What Does a Healthy Variance Look Like?
Not all variance is avoidable. Small amounts of waste, minor portioning inconsistencies, and natural yield variation mean that a zero variance is unrealistic in a live kitchen environment. The question is where to draw the investigation threshold.
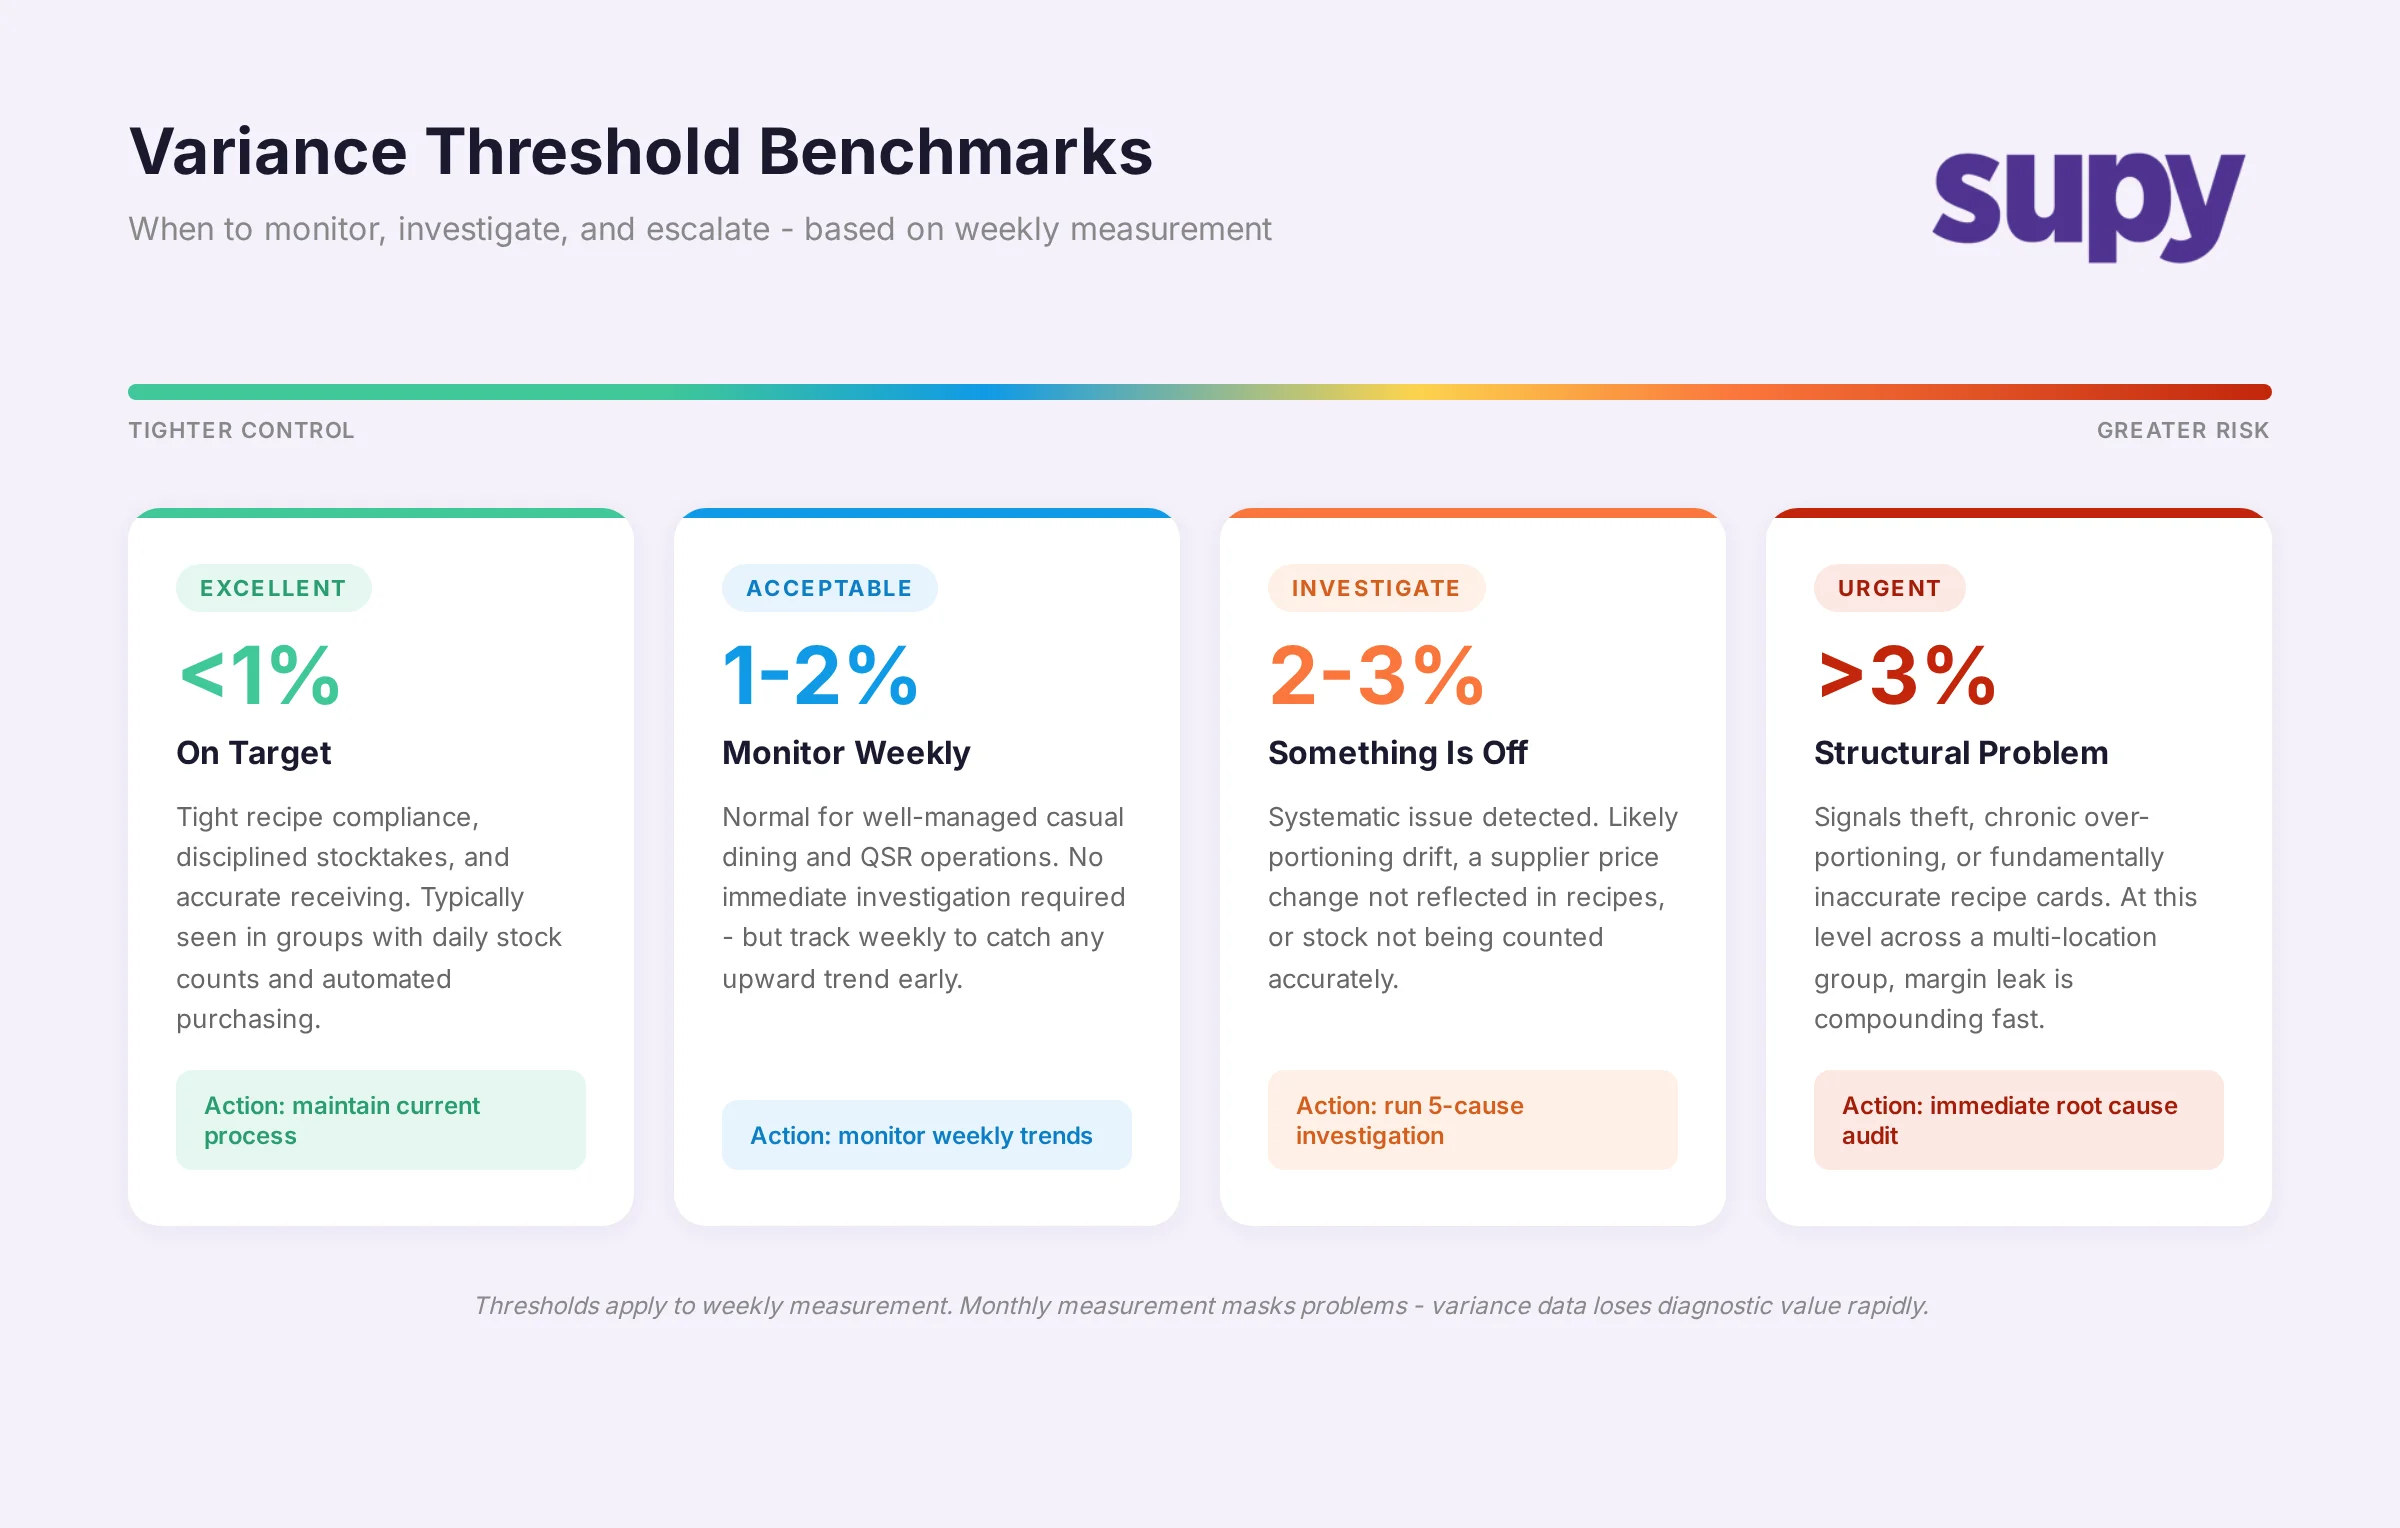
Based on patterns across multi-site operators on the platform, these thresholds hold consistently:
- Under 1% - Excellent. Tight recipe compliance, disciplined stocktakes, and accurate receiving. Typically seen in groups with daily stock counts and automated purchasing.
- 1-2% - Acceptable. Monitor weekly but no immediate investigation required. Normal for well-managed casual dining and QSR operations.
- 2-3% - Investigate. Something is systematically off. Could be portioning drift, a supplier pricing change that was not reflected in recipes, or stock not being counted accurately.
- Over 3% - Urgent. This level of variance across a multi-location group signals a structural problem - theft, chronic over-portioning, or fundamentally inaccurate recipe cards.
One operator we spoke with was targeting 30% COGS but sitting at 40%. The root cause was not a single dramatic failure - it was a 3-4% variance compounding across locations week after week, driven largely by portioning inconsistencies that nobody was measuring against a theoretical baseline.
That is the critical point. Without a reliable theoretical number, the variance is meaningless. You cannot investigate a gap you have not measured.
The Five Causes of Variance
When the gap between theoretical and actual food cost exceeds your threshold, the cause falls into one of five categories. Each has a distinct detection method and operational response.
1. Waste and spoilage
Ingredients that expire, spoil, or are discarded during prep. The cost is real but does not show up in POS sales data - so theoretical cost does not account for it. Detection: compare waste log entries against the variance for specific ingredient categories. If your protein variance is high and waste logs show regular disposal of chicken past its use-by date, the cause is clear.
2. Theft
The most uncomfortable cause to investigate, but a common one. Unexplained stock disappearances between counts, particularly for high-value items like spirits, premium proteins, and packaged goods. Detection: run item-level variance reports and look for products where variance consistently exceeds waste and portioning explanations.
3. Portioning errors
Portions served larger than the recipe specifies. Even a 10g over-portion on a protein multiplied by 200 covers per day adds up quickly. Detection: spot-check portion weights against recipe cards during service. Compare theoretical cost for individual high-cost dishes against actual consumption of the primary ingredient.
4. Recipe non-compliance
Kitchen staff substituting ingredients, skipping components, or using different quantities than the recipe card specifies. This distorts both the customer experience and the theoretical baseline. Detection: periodic recipe audits where a manager observes prep against the recipe card and logs deviations.
5. Ingredient price drift
Your recipe card says chicken costs $4.80 per kg, but your latest invoice shows $5.20. If the recipe is not updated, your theoretical cost is understated and the variance appears artificially high. This is the most common and most preventable cause - yet many operators still update recipe costs manually on a quarterly basis.
In Supy, purchase prices flow directly into recipe costs. When a supplier invoice is processed and the price per unit changes, every recipe using that ingredient updates automatically. This eliminates ingredient price drift as a variance cause entirely.
How to Close the Gap Systematically
Identifying the variance is the diagnostic step. Closing it requires a repeatable weekly process.
Week 1 - Establish the baseline. Run a full stocktake across all locations. Calculate theoretical food cost from POS sales data and current recipe costs. Calculate actual food cost from stock movements. Record the variance by location.
Week 2 onwards - Weekly variance review. Every Monday, each location manager reviews the previous week's variance. If the figure exceeds 2%, they investigate using the five-cause framework above. The investigation should produce a specific root cause and an action - not a general observation.
Attribution matters. When a 3% variance is reported, the response should not be "food cost is high." It should be "2.1% of the variance is attributable to portioning errors on three high-volume dishes, and 0.9% is from a chicken price increase not yet reflected in recipes." Attribution turns a number into an action.
Frequency is non-negotiable. Operators who count stock weekly and review variance weekly catch problems within days. Operators who count monthly discover problems a month too late. Across operators on the platform, the groups with sub-2% variance almost universally run weekly stocktakes with daily POS reconciliation.
Supy's variance reports break down the gap by location, by ingredient category, and by time period. The platform flags when any location's variance exceeds the configured threshold, so operations directors do not need to manually check every site.
About Supy
Supy is a back-of-house operations platform built for multi-location restaurant groups. The platform connects recipe costing, inventory management, procurement, and business intelligence in a single system - so theoretical food cost stays accurate in real time, variance surfaces automatically, and operations teams can investigate the gap before it compounds. To see how Supy keeps your theoretical food cost baseline current as ingredient prices change, visit the recipe costing page or book a demo.