.jpeg)

Marge bénéficiaire moyenne des restaurants : les benchmarks par segment et pourquoi votre chiffre diffère
Marge bénéficiaire moyenne des restaurants, par segment
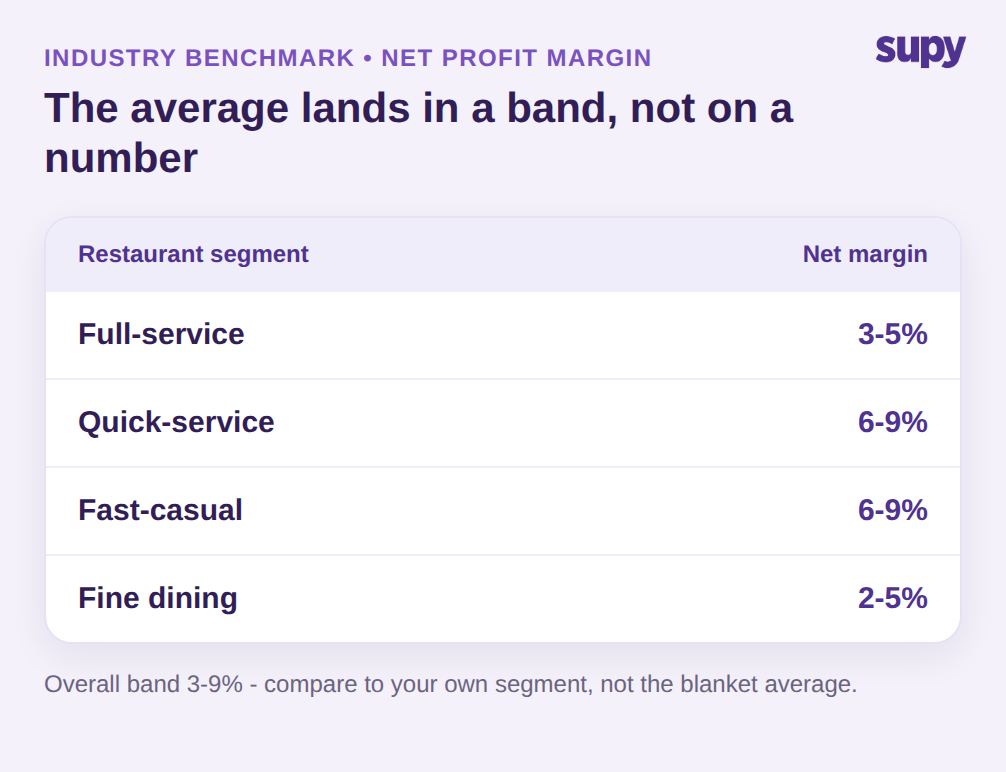
Selon les benchmarks sectoriels publiés, la marge bénéficiaire moyenne des restaurants se situe dans une fourchette de 3 à 9 % du chiffre d'affaires. Cette plage de référence est réelle, mais elle dissimule plus qu'elle ne révèle, car la marge nette varie fortement selon le format d'exploitation. Les restaurants à service complet affichent généralement 3 à 5 %. Les concepts de restauration rapide et fast casual se situent habituellement entre 6 et 9 %, grâce à une intensité de main-d'œuvre réduite, des menus plus simples et un taux de rotation plus rapide. La restauration gastronomique se situe souvent en bas de la fourchette, autour de 2 à 5 %, car les prix élevés de la carte sont compensés par le coût des Ingrédients et la charge salariale.
La première chose utile à faire avec tout chiffre de marge bénéficiaire moyenne d'un restaurant est de cesser de le traiter comme un objectif pour en faire un point de référence propre à votre segment. Une marge nette de 5 % est banale pour un établissement gastronomique et un signal d'alarme pour une enseigne de restauration rapide. Le benchmark vous indique dans quelle discussion vous devriez vous situer ; il ne vous dit pas si votre propre chiffre est satisfaisant. Pour le déterminer, vous devez savoir précisément quelle marge vous mesurez et ce qui la pèse.
Il est également utile de rappeler ce qu'est réellement une marge nette avant de la comparer à celle d'autres établissements. La marge nette est le bénéfice après toutes les charges, exprimé en proportion du chiffre d'affaires : c'est le chiffre le plus étroit et le plus fragile du compte de résultat. Avec une marge nette de 5 %, cinq centimes de chaque euro survivent ; un glissement de deux points du Coût matière peut la diviser par deux. C'est précisément cette fragilité qui fait d'un benchmark global unique un outil peu fiable, et c'est pourquoi ce guide se concentre sur l'endroit où votre propre chiffre se construit et où il fuit.
Marge brute vs marge nette : quel chiffre comparez-vous ?
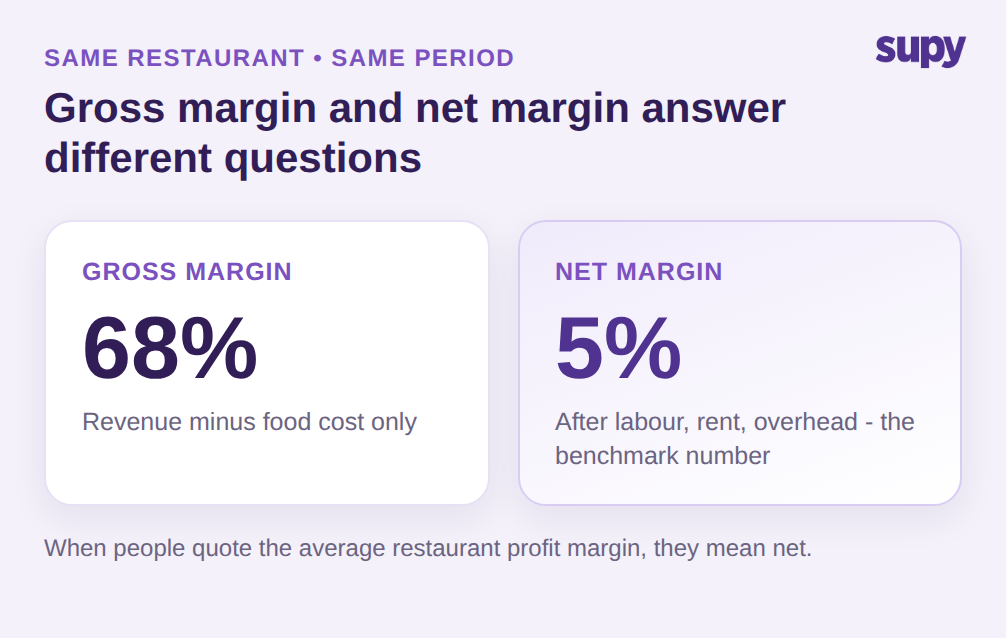
La plupart des confusions autour des benchmarks commencent ici. La Marge brute correspond au chiffre d'affaires diminué du Coût matière, et elle semble généralement satisfaisante, souvent autour des deux tiers des ventes. La marge nette est ce qui reste après tout le reste : personnel, loyer, charges, marketing et frais généraux. Un même restaurant peut afficher une Marge brute de 68 % et une marge nette de 5 %, et les deux sont justes, car ils répondent à des questions différentes. Lorsque les professionnels citent la marge bénéficiaire moyenne des restaurants, ils entendent presque toujours la marge nette. Pour le détail de la partie brute, consultez notre guide sur la marge brute des restaurants.
Il existe un second piège de définition que les exploitants multicanaux rencontrent constamment : ce qui est considéré comme chiffre d'affaires. Un groupe exploitant la vente en salle et la livraison a constaté que son équipe financière et son équipe opérationnelle déclaraient des marges différentes pour la même activité, car la finance utilisait le chiffre d'affaires brut incluant les commissions des plateformes de livraison, tandis que les opérations déduisaient la commission. Aucune des deux n'avait tort, mais elles n'étaient pas comparables, et aucune ne correspondait proprement au benchmark. Avant de comparer votre chiffre à une moyenne, clarifiez le dénominateur : la livraison est-elle comptabilisée au montant brut de la commande ou net de commission ? Une erreur ici vous fera courir après un Écart qui n'est en réalité qu'une différence de définition.
La distinction est plus importante qu'il n'y paraît, car la livraison a discrètement reconfiguré l'équation de marge pour de nombreux exploitants. Une commande de livraison peut porter le même Coût matière qu'un couvert en salle, mais arriver avec un cinquième ou plus de sa valeur prélevé en commission de plateforme avant d'apparaître dans le compte de résultat. Une enseigne ayant développé sa part de livraison sans reconsidérer sa définition de marge peut sembler rater le benchmark, alors que la vraie raison tient au mix de canaux, non à une faiblesse opérationnelle. La solution n'est pas d'abandonner la livraison, mais de mesurer séparément la vraie marge sur coûts variables de chaque canal, de sorte que le chiffre net mixte soit compris plutôt que condamné. Ce n'est qu'une fois que la Marge brute et la marge nette, et la salle et la livraison, sont clairement séparées que la comparaison avec la marge bénéficiaire moyenne des restaurants apporte un quelconque enseignement.
Pourquoi votre marge réelle est inférieure au benchmark
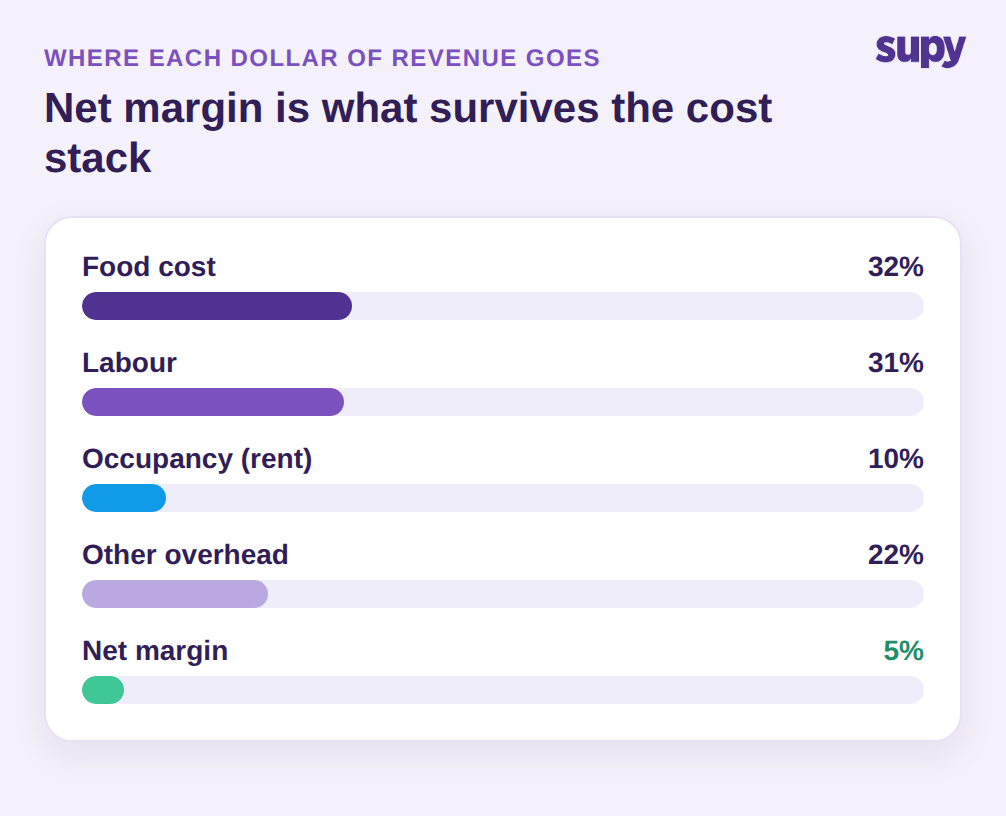
Une fois les définitions clarifiées, la structure des coûts d'un restaurant explique l'essentiel de l'écart entre le benchmark et le solde bancaire. Le Coût matière représente généralement 28 à 35 % du chiffre d'affaires, et la masse salariale 28 à 35 % supplémentaires, ce qui explique pourquoi les exploitants suivent le coût primaire (Coût matière plus personnel) et cherchent à le maintenir en dessous de 60 % du chiffre d'affaires. La marge nette est simplement ce qui reste après le coût primaire, le loyer et les frais généraux : quelques points d'Écart sur le Coût matière ou le personnel font la différence entre un chiffre satisfaisant et un chiffre fragile.
Le problème est que la marge que la plupart des exploitants croient réaliser est théorique, non réelle. La marge théorique est construite à partir des Coûts théoriques des Recettes et des prix de la carte ; la marge réelle est ce que le compte de résultat affiche en fin de période. Un directeur des opérations d'une chaîne fast casual multi-sites a constaté que les deux divergeaient de façon constante de 4 à 5 points, en raison de coûts de Recette ne reflétant plus les prix d'achat réels. Chaque fois qu'un prix Fournisseur augmente et que les coûts de Recette ne sont pas mis à jour, la marge théorique dérive au-dessus de la réalité, et l'exploitant ne découvre le chiffre réel qu'en fin de mois, trop tard pour agir sur cette période. C'est pourquoi comparer une marge théorique obsolète à un benchmark est trompeur dans les deux sens. Notre guide sur l'Écart entre Coût théorique et Coût réel du Coût matière détaille comment isoler l'origine de cet Écart.
Le Coût matière est généralement le plus volatile des deux postes du coût primaire, ce qui justifie une surveillance accrue. Les prix de la carte ne sont révisés que quelques fois par an ; les prix des Ingrédients évoluent chaque semaine. Un restaurant qui maintient ses prix de carte constants malgré des hausses de prix Fournisseur verra son Ratio coût matière grimper et sa marge diminuer, même si rien dans la carte ou dans l'exploitation ne semble avoir changé. Suivre le Ratio coût matière par Recette et par site par rapport à un objectif est ce qui permet de détecter cette dérive dès la deuxième semaine plutôt que de la découvrir dans les chiffres trimestriels. La marge nette que vous visez dépend de cette seule discipline plus que de toute autre.
Le piège multi-sites : comment une moyenne mixte masque vos sites les moins performants
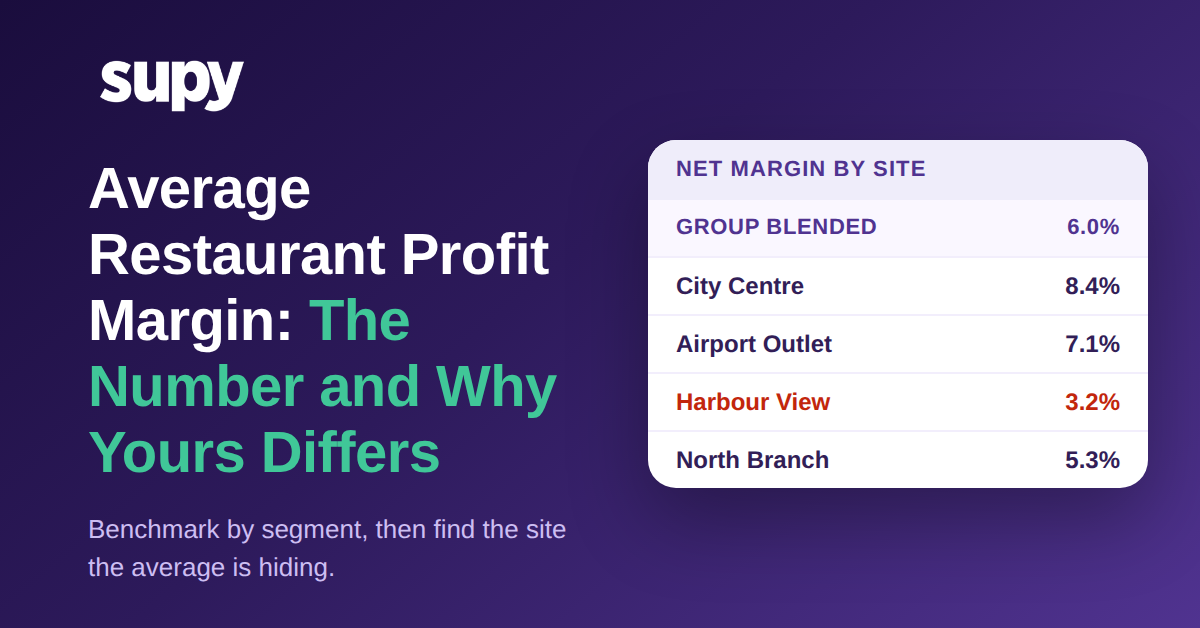
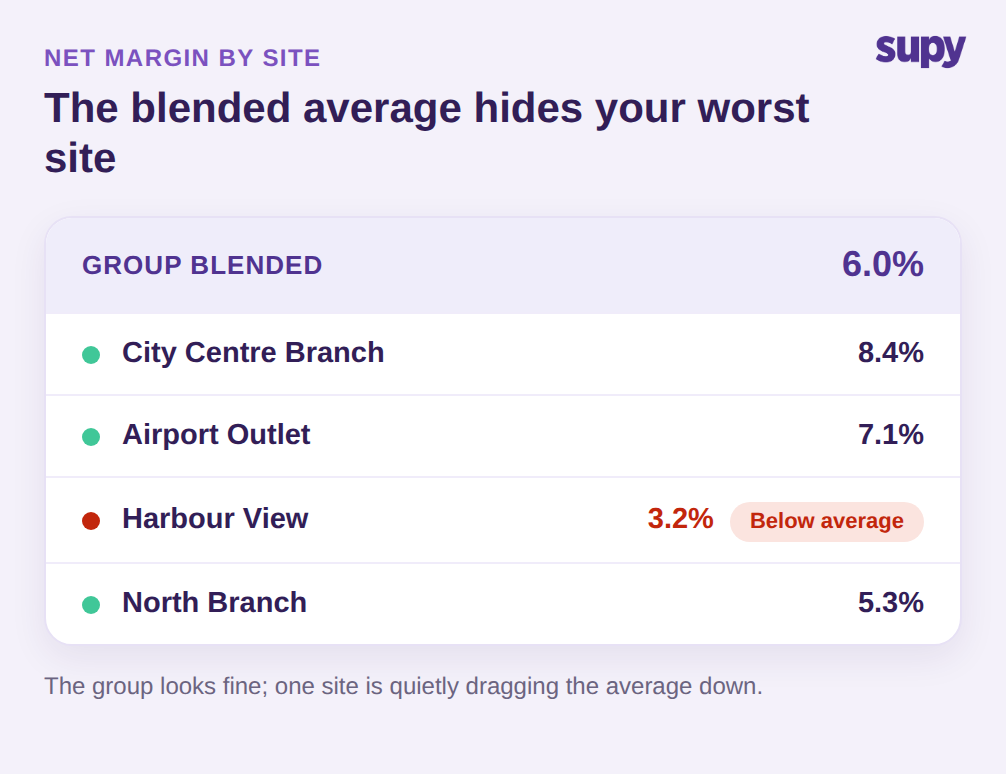
Pour un groupe, le chiffre le plus dangereux est sa propre moyenne mixte, car elle se comporte exactement comme le benchmark sectoriel : elle lisse les sites qui nécessitent une attention particulière. L'équipe financière d'un exploitant de restauration casual multi-sites rapportait une marge mixte stable sur l'ensemble du groupe et la traitait comme une preuve de stabilité. Un bilan trimestriel approfondi a révélé que deux sites étaient plusieurs points en dessous des autres ; les sites performants les soutenaient, et le chiffre mixte avait retardé la correction d'un trimestre entier.
C'est la raison fondamentale pour laquelle une marge bénéficiaire moyenne à l'échelle de l'entreprise est quasi inutile pour un exploitant multi-sites. Un groupe confortablement positionné sur sa marge mixte peut aisément inclure un site plusieurs points en dessous et un autre plusieurs points au-dessus, et seule la vue par site indique où intervenir. La question de benchmark pour un groupe n'est jamais simplement : « Sommes-nous au-dessus de la moyenne ? » C'est : « Quels sites sont en dessous de notre propre moyenne, et de combien ? » Les moyennes, qu'elles soient sectorielles ou internes, sont l'endroit où la sous-performance se cache.
Cette trappe est si répandue parce que la plupart des reportings agrègent avant de détailler. Un dossier de compte de résultat mensuel arrive en total groupe, la marge mixte semble suffisamment proche du benchmark, et personne ne pose la question par site jusqu'à ce qu'un établissement rencontre de vraies difficultés. D'ici là, le groupe a soutenu le site faible pendant des mois, et la reprise est bien plus difficile qu'une légère correction au premier signe d'Écart ne l'aurait été. Voir la marge par site à chaque période est ce qui transforme le benchmark d'un simple chiffre de comparaison en système d'alerte précoce.
Les leviers qui font réellement bouger la marge nette
Augmenter les prix et réduire les portions : voilà le conseil que l'on trouve partout, et les deux dégradent l'expérience client avant de faire bouger la marge de façon significative. Les leviers qui font réellement bouger la marge nette sans toucher à la carte sont opérationnels, et tous dépendent de la visibilité sur les chiffres réels par site. C'est là qu'intervient Supy, grâce à une Gestion des stocks qui transforme l'Écart entre théorie et réalité en quelque chose d'actionnable en cours de période, et non après.
Les Tableaux de bord Supy calculent le Coût matière théorique à partir des quantités vendues par Recette et des Coûts réels des Ingrédients, puis le comparent à la consommation réelle — ainsi, l'Écart qui vous coûte discrètement des points de marge est visible en temps réel et non en fin de mois. Le coût des Pertes est suivi pour les articles individuels comme pour les Recettes complètes, et indique le coût des Pertes et de la surproduction par site et par période — un levier direct sur la marge nette que la plupart des groupes ne peuvent même pas mesurer. Chaque chiffre étant disponible par site, la moyenne mixte cesse de masquer les sous-performants : vous voyez quel site présente un Écart de Coût matière plus important ou des Pertes plus élevées, et corrigez celui-là plutôt que d'ajuster les prix sur l'ensemble du groupe. Chacune de ces fonctionnalités est une capacité en temps réel, et ensemble elles transforment « notre marge est en dessous du benchmark » en une liste d'actions concrètes, site par site.
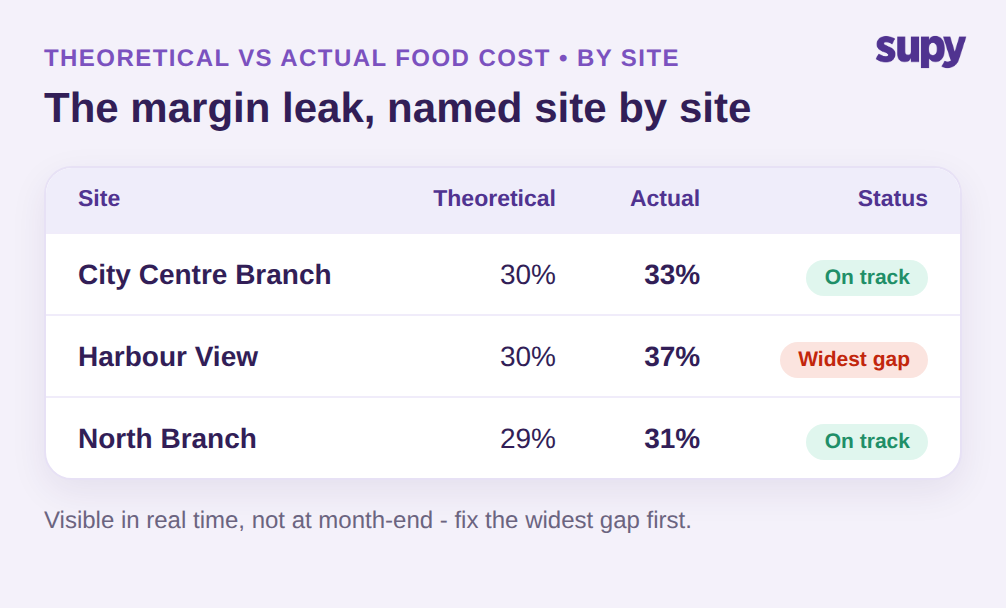
Utilisez le benchmark comme point de départ, non comme point d'arrivée. Premièrement : positionnez-vous — comparez votre marge nette à la fourchette de votre propre segment (3 à 5 % service complet, 6 à 9 % restauration rapide et fast casual, 2 à 5 % restauration gastronomique), non aux 3 à 9 % globaux. Deuxièmement : cessez de regarder le chiffre mixte et classez vos sites par marge nette, afin de nommer ceux qui sont en dessous de votre propre moyenne. Troisièmement : pour chaque site faible, mesurez l'Écart entre Coût théorique et Coût réel du Coût matière ; un Écart de 4 à 5 points représente une période entière de marge engloutie dans des coûts de Recette obsolètes et des Pertes non enregistrées. Comblez l'Écart le plus important en premier. La marge bénéficiaire moyenne des restaurants ne devient utile qu'au moment où vous cessez de vous comparer au secteur pour commencer à comparer vos sites entre eux.