.jpg)


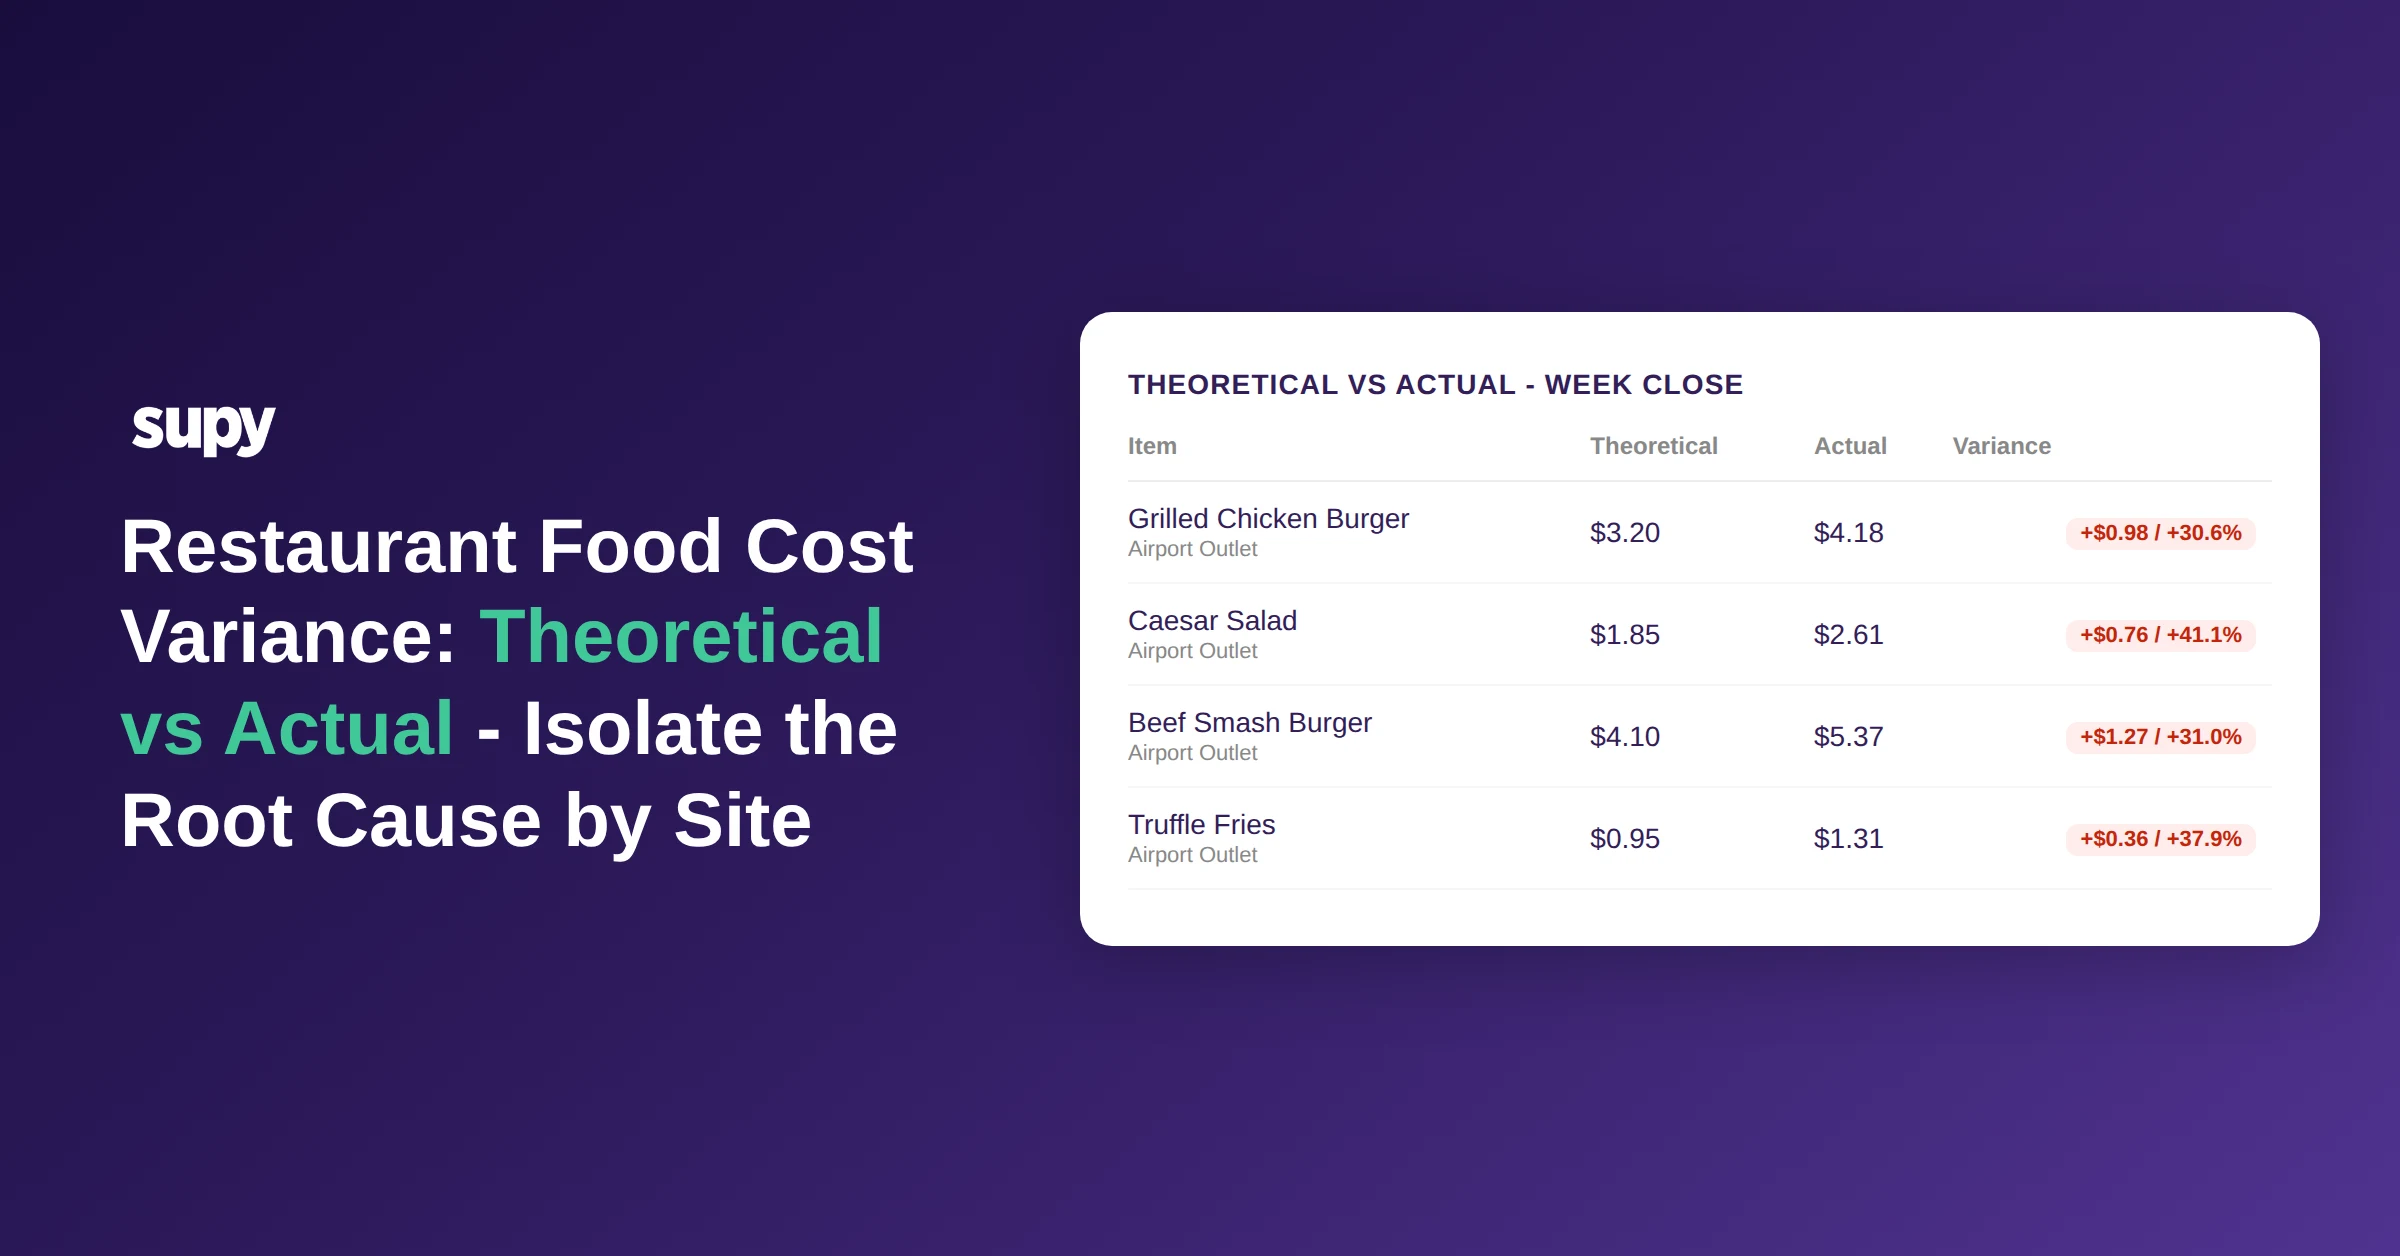
Restaurant Food Cost Variance - Theoretical vs Actual: How to Isolate the Root Cause by Site
What Theoretical vs Actual Food Cost Variance Measures (and Why the Total Obscures the Real Problem)
Theoretical food cost is what your food cost should be if every portion were made exactly to recipe, with no unrecorded spoilage, no waste beyond your yield allowances, and no pricing errors. It is calculated by multiplying the recipe cost of each sold menu item by the number of units sold, then dividing by total revenue. Actual food cost is what you spent on food in a given period after deliveries and stock movements.
The gap between the two - your theoretical-vs-actual variance - tells you how much food cost you cannot account for through planned yield, batch shrinkage, or recipe construction. A tight gap (under 2 percentage points) signals good control. A persistent gap of 4-5 percentage points or more, sustained over weeks, almost always traces to one or more identifiable root causes: stale recipe costs, unrecorded spoilage, or portion inconsistency.
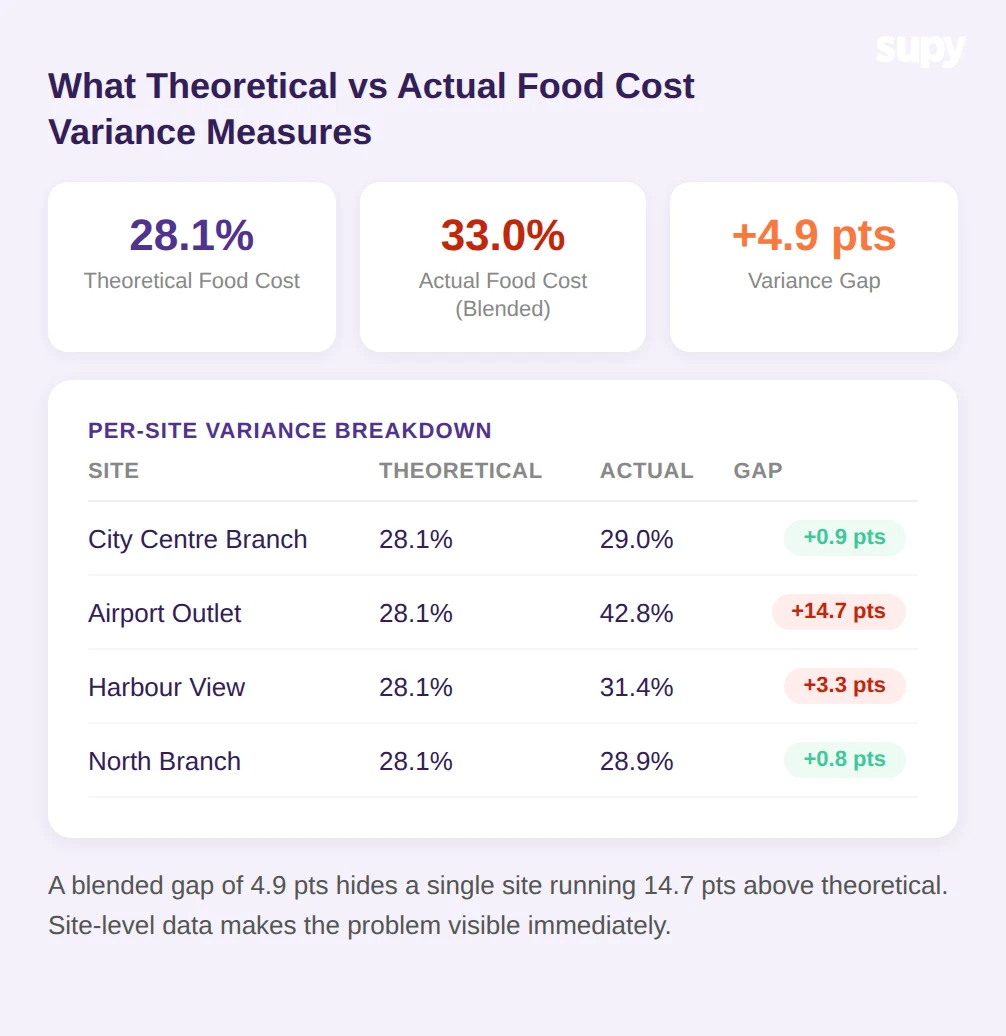
The problem is not the variance figure itself. The problem is that most multi-site groups read this figure at the group level. When you blend four sites into one number, a severe variance at one site is averaged down by tighter performance at the others. The blended figure looks acceptable. Nothing gets fixed. The leak continues.
Supy's theoretical-vs-actual variance dashboard shows variance broken out by site, by menu category, and by individual item, so operators can see immediately whether a group-level gap is spread across all locations or concentrated in one.
What should you be asking right now? If your group food cost variance is above 3 percentage points, can you say with certainty which site is driving it?
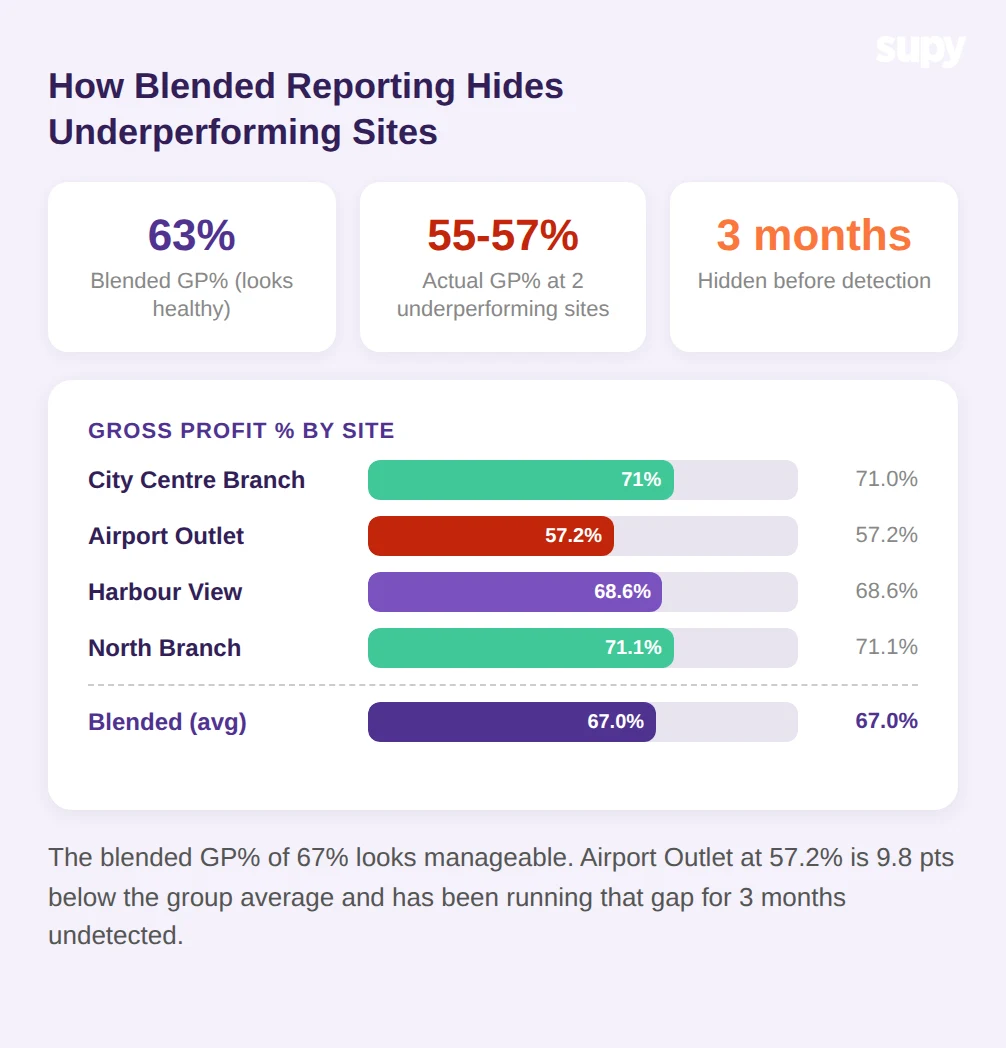
How Blended Reporting Hides Underperforming Sites for Months
A real pattern observed across multi-site casual dining operations: a group reports a consistent 63% blended gross profit percentage across all sites. Quarter-end deep-dives reveal two sites running at 55-57% gross profit. The blended figure had masked that underperformance for three full months.
This is not a data quality failure. It is a structural problem with how the report is built. When a higher-volume, higher-margin site is included in the same aggregate as a smaller underperforming one, the larger site's numbers carry more weight. The group average stays green. The underperforming site never triggers a flag.
The same dynamic appears in how finance and operations teams calculate revenue for delivery-heavy concepts. One operator found that finance used gross revenue including platform fees, while operations excluded commission. The result was two gross profit figures for the same brand, 11 percentage points apart. Neither team was wrong about their numbers. They were reading different inputs and calling it the same metric.
Weekly per-site reporting breaks this pattern. A 12-outlet casual dining group specifically requested per-outlet reporting that shows consumption versus theoretical usage versus ordering volume by site. That combination - what was sold (driving theoretical), what was used (driving actual), and what was ordered (driving purchases) - gives a complete picture of where the variance originates.
Supy's interactive dashboards include food cost percentage at group, site, and menu-category level with drill-down filters, so a head of operations can move from the group number to the site number to the item level in the same view without exporting to a spreadsheet.
What to ask: does your current reporting show you variance by site on a weekly basis, or only at period close?
The Three Root Causes Behind a Persistent Variance Gap
When a theoretical-vs-actual variance gap persists above 4-5 percentage points over multiple weeks, there are three root causes that account for the vast majority of cases.
Recipe costs not updated for market prices. If your recipe cost was set six months ago and key ingredient prices have moved since then, your theoretical cost is understated. Your actual cost reflects current prices. The gap you are seeing is partly just the difference between an old price list and today's invoices. One operator found this was the primary driver after recipe costs had not been refreshed for six months. Supy's recipe engine supports target cost thresholds with alerts when actual ingredient costs push a dish above its cost target, so stale recipe pricing does not silently distort the variance calculation.
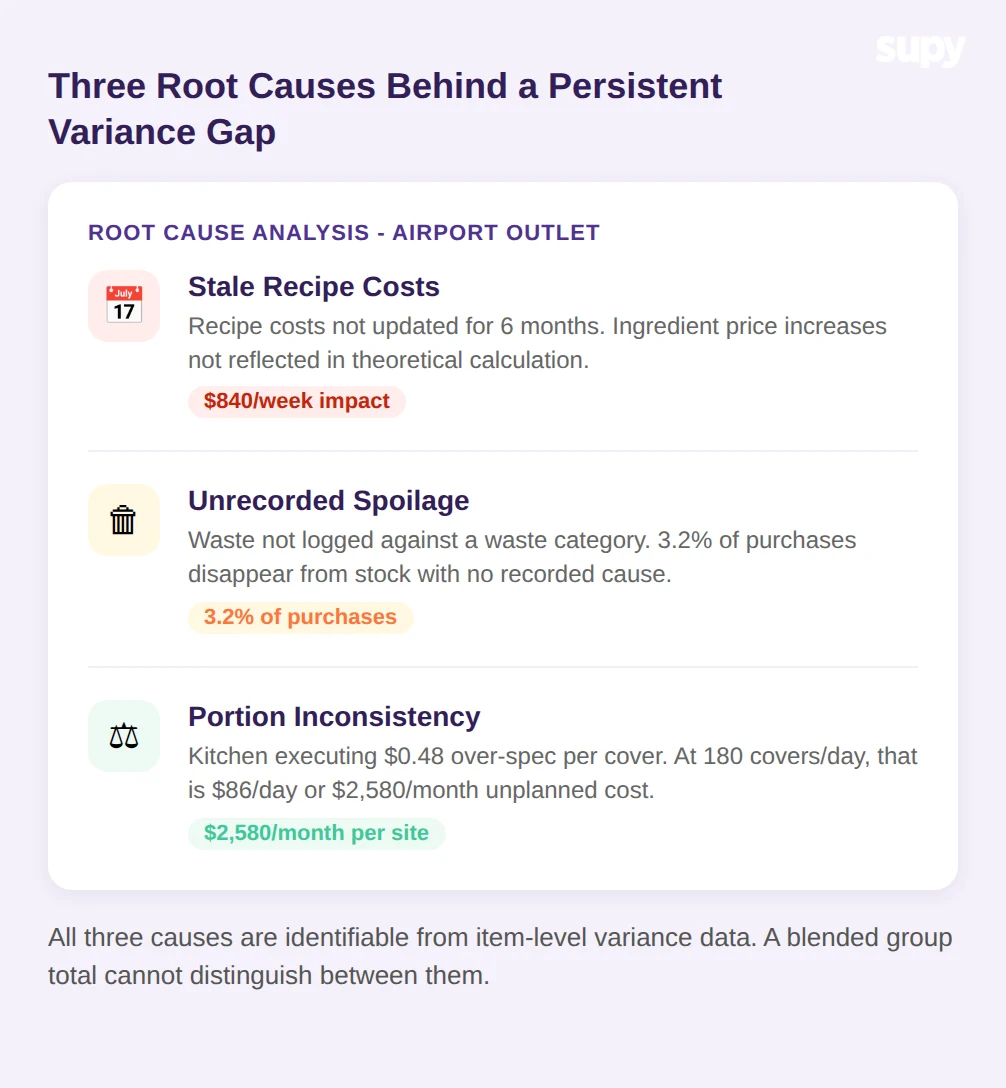
Unrecorded spoilage and wastage. Spoilage that is not logged against a waste category goes unaccounted for. From the system's perspective, the ingredient was received, never sold, and is not in stock. It creates a black hole in the usage calculation. Supy's live stock module tracks theoretical versus actual usage by item, auto-updated from goods-received notes and recipe consumption from sales. When an item's actual usage is consistently higher than theoretical, unrecorded spoilage or spillage is a probable cause.
Portion inconsistency. Even with accurate recipe costs and logged waste, inconsistent portioning creates a real gap between what should have been used and what was. A kitchen serving 180 covers per day at $0.48 over-portion per cover generates $86 in daily unplanned food cost - roughly $2,580 per month at that one site. Supy's recipe module stores yield percentages, portion weights, and prep wastage allowances, and supports printable and digital recipe cards to help kitchen teams execute to spec.
What to ask: of these three causes, which one have you actually measured at your highest-variance site?
The Supy Approach: Connecting Recipe Costs, Live Stock, and Variance Dashboards
The reason restaurant food cost variance is hard to diagnose in many operations is not that the data does not exist. It is that the data sits in separate places: recipe costs in one spreadsheet, stock counts in another, sales in the POS, and purchases in the ERP. Building a variance figure requires manually joining these sources, which takes time and introduces its own errors.
Supy connects these data sources into a single workflow. Recipes are built in the system with ingredient yields, prep wastage, and batch production steps. Each recipe is linked to the corresponding POS menu item including modifiers, so every sale automatically depletes the correct ingredients at the correct yield-adjusted quantity. There is no manual sync step.
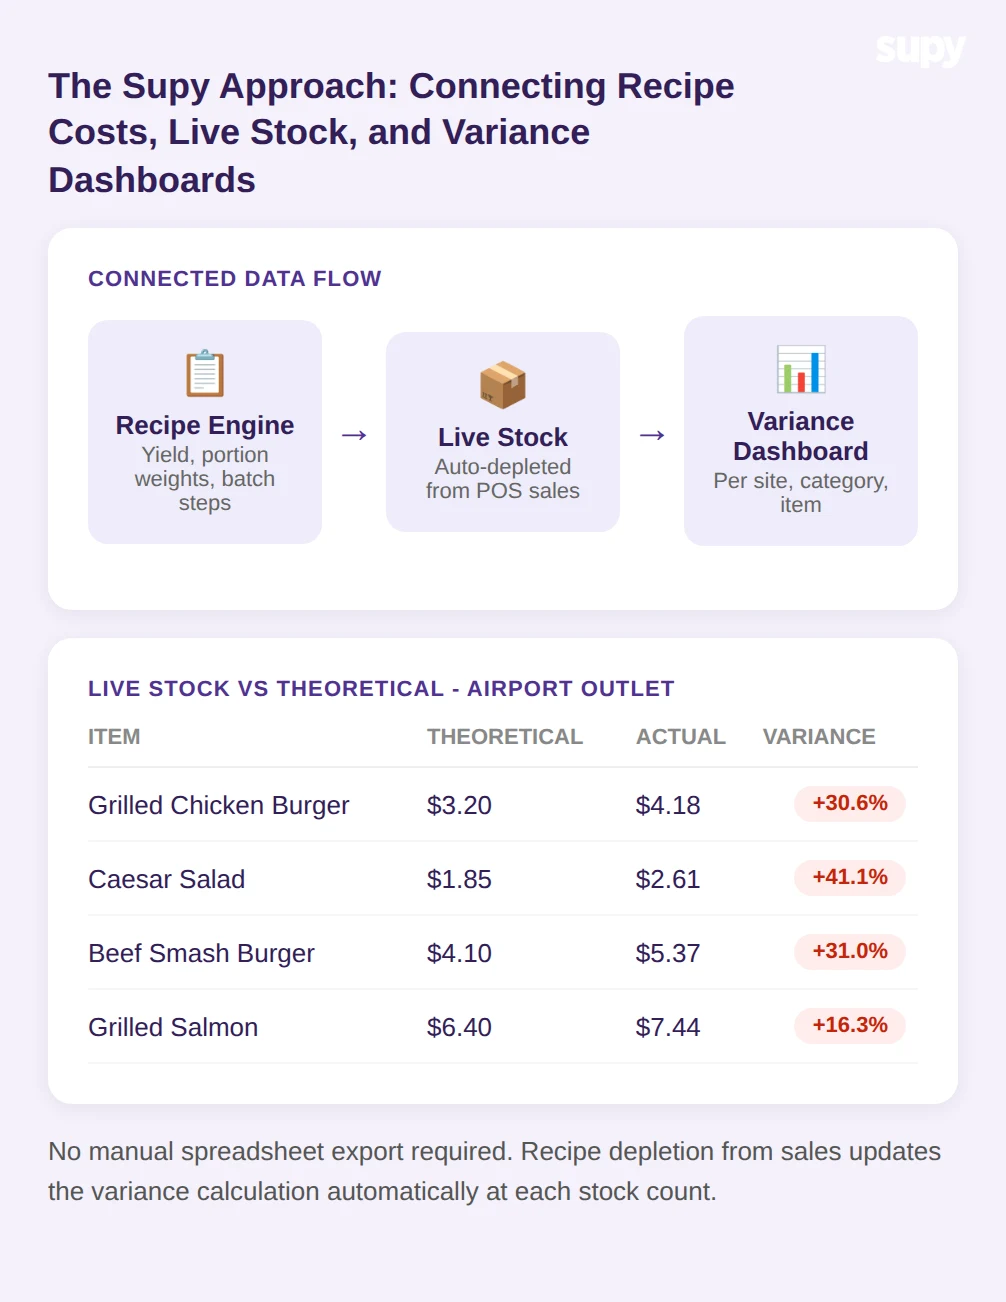
Stock counts are taken directly in the platform on mobile or tablet. Multiple staff can count the same location in parallel, with the system auto-merging tallies and attributing each entry to the individual counter. As soon as a count is closed, the system calculates variance against theoretical stock on hand at item level. Goods-received notes update on-hand quantities automatically as deliveries are recorded.
The output feeds into the variance dashboard, which shows theoretical-vs-actual usage variance by type - spoilage, over-portioning, theft - by site and by item. A head of operations can see in a single view which site is out of range, which items are driving it, and whether the variance pattern is consistent (suggesting a systemic issue like stale recipes) or intermittent (suggesting a specific waste or portioning event).
Some groups also configure automated weekly reports that include COGS percentage, sales actuals, and theoretical-vs-actual variances per venue, so the data reaches operations leads without requiring them to log in and pull it manually.
You can see how the recipe, stock, and variance tools connect at supy.io/platform.
What to ask: if you ran a variance report by item for your worst-performing site right now, could you get that data without a manual spreadsheet export?
Running the Variance Diagnosis Across Sites
Diagnosing theoretical-vs-actual food cost variance across multiple sites follows a consistent pattern once you have per-site data available.
Start with the site-level variance table. Sort by variance gap, highest to lowest. Any site running more than 3 percentage points above theoretical is the primary target. In a four-site group with blended food cost running 4.9 points above theoretical, it is common to find one site contributing the majority of that gap while the others are within 1-2 points of theoretical.
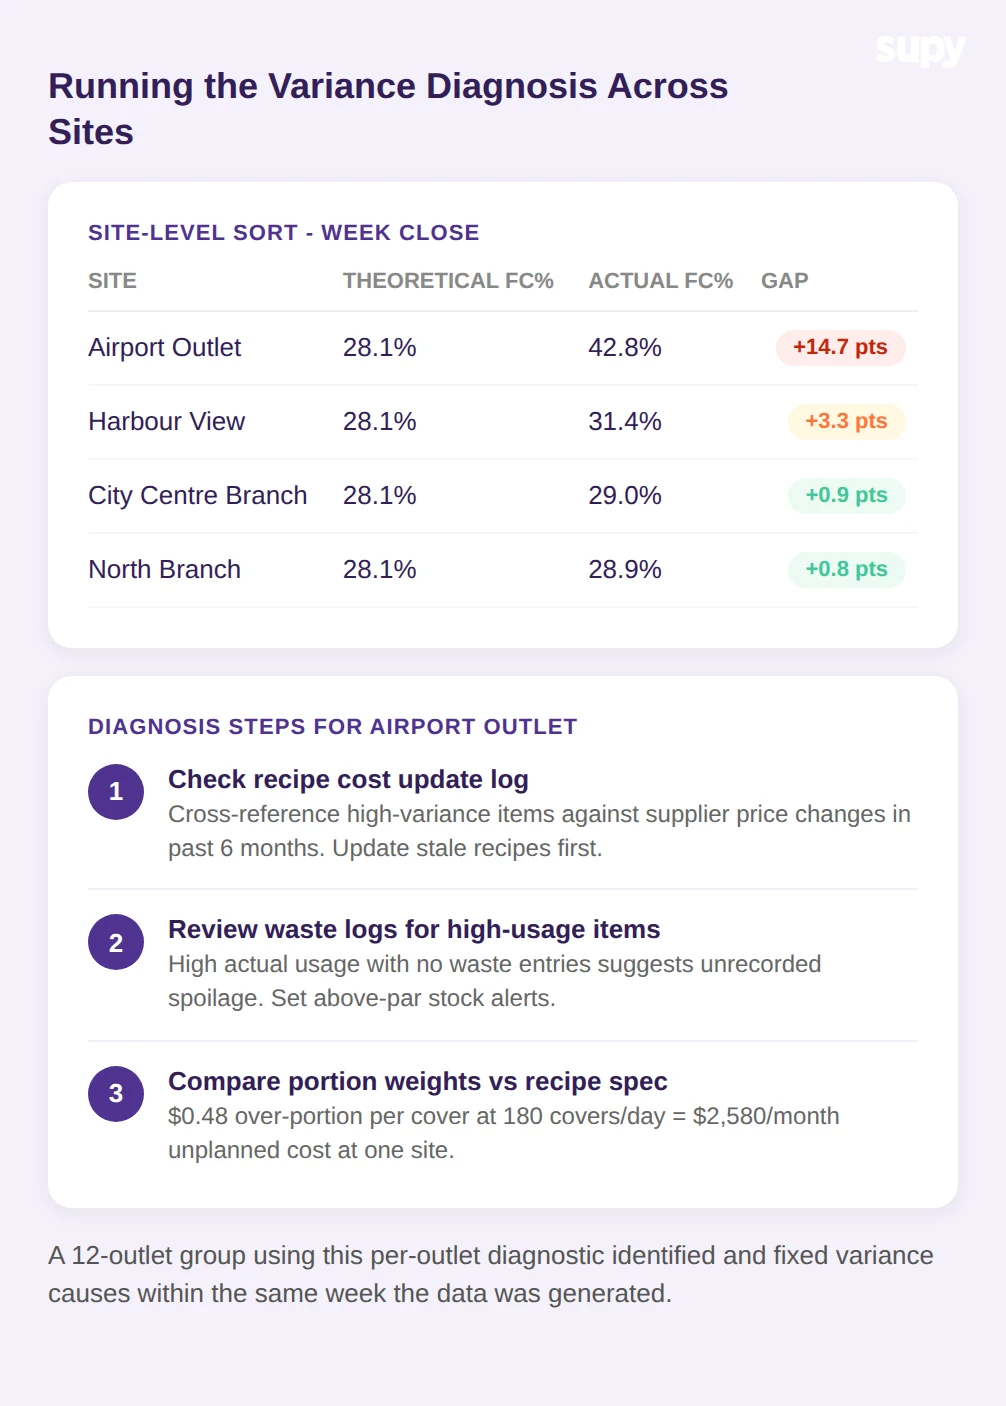
For the high-variance site, move to the item-level breakdown. Look at items where actual usage is more than 10% above theoretical. Cross-reference with the recipe cost update log - if any of those items have had a supplier price increase in the last six months that was not applied to the recipe, that is your first fix. Update the recipe costs, re-run the theoretical, and see how much of the gap closes.
Next, look at waste logs for the same site. If there are high-usage items with no corresponding waste entries, spoilage is likely going unrecorded. Set minimum thresholds and above-par alerts in Supy's stock module for those items so that unusually high stock consumption triggers a flag before the next count.
Finally, compare portion weights at the site against the recipe spec. Supy stores the target yield and portion weight per recipe, and kitchen teams can access digital recipe cards during service. A site where portioning is accurate will show actual usage tracking closely to theoretical sold quantities item by item.
A 12-outlet casual dining group that moved to this per-outlet, per-item diagnostic approach found it could identify and address variance causes within the same week the data was generated, rather than waiting for a monthly period-end review.
At that cadence, a 4-5 percentage point variance gap is not a chronic condition. It is a weekly finding with a weekly fix.
What to ask: does your current variance workflow run at week-close or only at period-close, and who owns the action when a site is out of range?