.jpeg)


Durchschnittliche Restaurantmarge: Branchenwerte nach Segment und warum Ihre Zahl abweicht
Durchschnittliche Restaurantmarge nach Segment
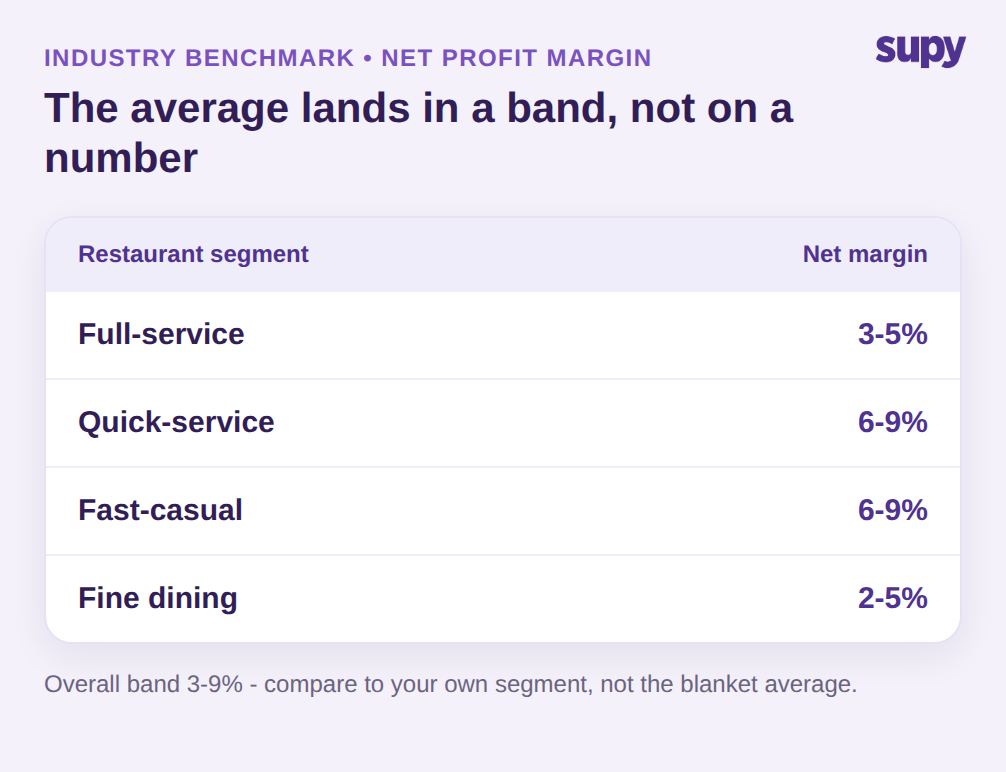
Laut veröffentlichten Branchenbenchmarks liegt die durchschnittliche Restaurantmarge bei 3–9 % des Umsatzes. Diese Spanne ist real, verbirgt jedoch mehr als sie offenbart: Die Nettomarge variiert je nach Betriebsmodell erheblich. Vollservicerestaurants erzielen typischerweise 3–5 %. Schnellservice- und Fast-Casual-Konzepte liegen in der Regel bei 6–9 %, begünstigt durch geringere Personalintensität, einfachere Speisekarten und schnellere Tischumläufe. Fine Dining liegt häufig am unteren Ende, bei 2–5 %, da hohe Menüpreise durch teure Zutaten und hohen Personalaufwand aufgewogen werden.
Der erste sinnvolle Schritt bei jedem Durchschnittswert für die Restaurantmarge ist daher, ihn nicht als Zielwert, sondern als Referenzpunkt für das eigene Segment zu betrachten. Eine Nettomarge von 5 % ist für ein Fine-Dining-Restaurant unauffällig und für eine Schnellservicemarke ein Warnsignal. Der Benchmark zeigt, in welcher Diskussion Sie stehen sollten — nicht, ob Ihre eigene Zahl gesund ist. Um das zu beurteilen, müssen Sie genau wissen, welche Marge Sie messen und was sie belastet.
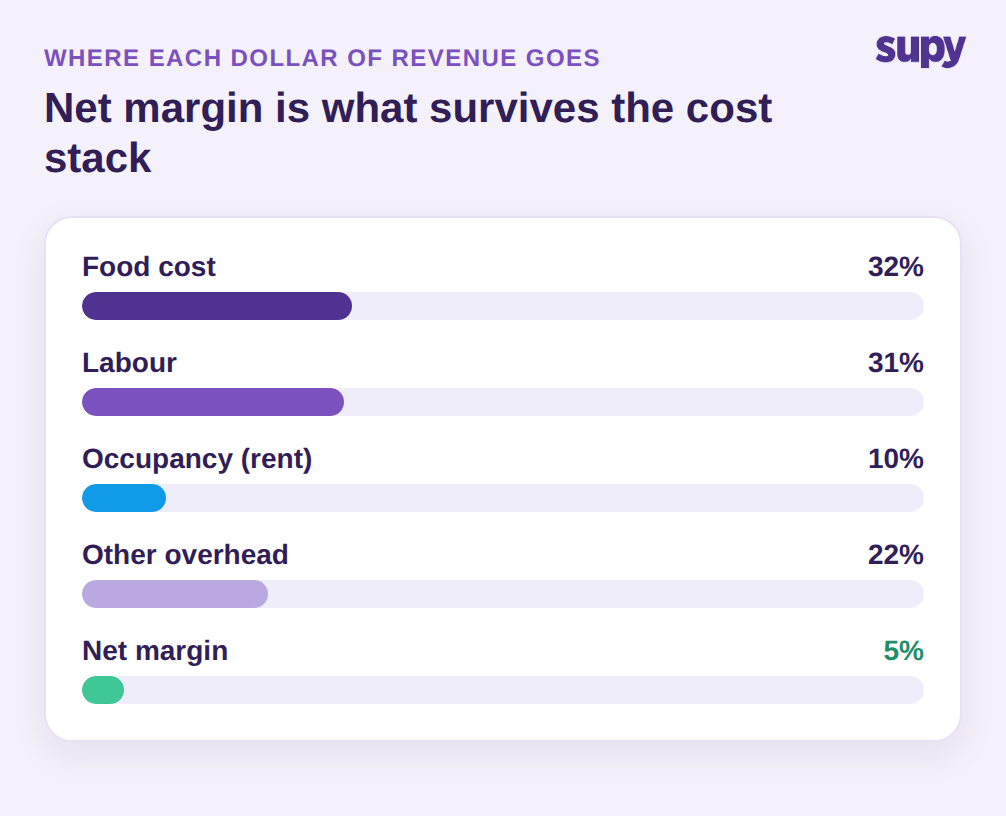
Es hilft auch, sich in Erinnerung zu rufen, was eine Nettomarge tatsächlich ist, bevor man sie mit anderen vergleicht. Die Nettomarge ist der Gewinn nach allen Kosten, ausgedrückt als Anteil am Umsatz — damit ist sie die dünnste und anfälligste Zahl in der GuV. Bei einer Nettomarge von 5 % überleben fünf Cent von jedem Euro; ein Rückgang des Wareneinsatzes um zwei Prozentpunkte kann sie halbieren. Genau diese Fragilität macht einen einzigen Gesamtbenchmark zum schwachen Instrument und ist der Grund, warum sich dieser Leitfaden darauf konzentriert, wo Ihre eigene Zahl entsteht und wo sie versickert.
Bruttomarge vs. Nettomarge: Welche Zahl vergleichen Sie?
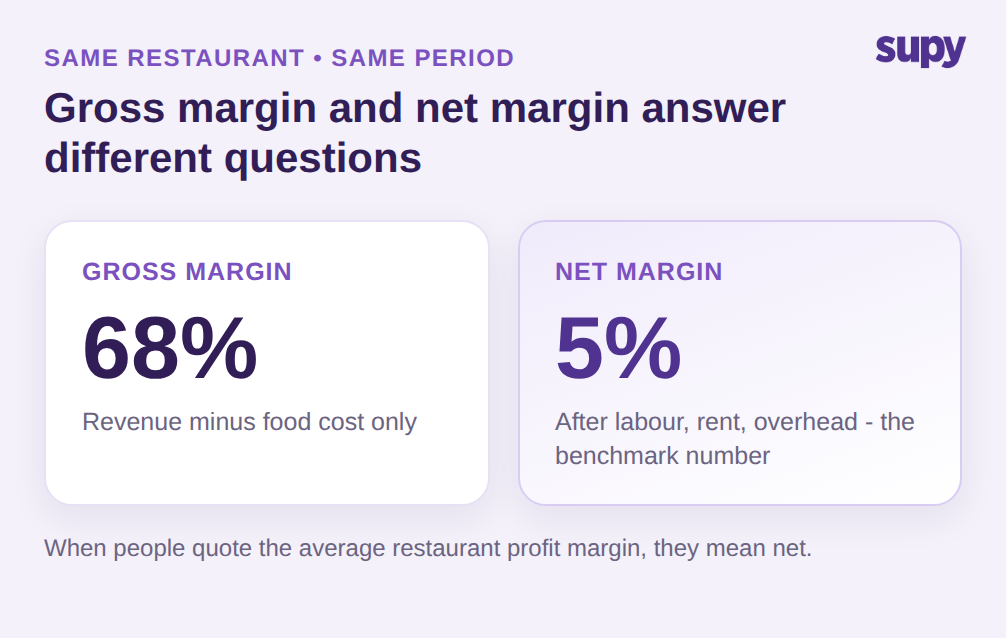
Die meisten Missverständnisse bei Benchmarks beginnen hier. Die Bruttomarge ist der Umsatz abzüglich der direkten Lebensmittelkosten und sieht meist gesund aus — häufig rund zwei Drittel des Umsatzes. Die Nettomarge ist das, was nach allem anderen bleibt: Personal, Miete, Nebenkosten, Marketing und Gemeinkosten. Dasselbe Restaurant kann eine Bruttomarge von 68 % und eine Nettomarge von 5 % ausweisen, und beides stimmt, weil sie unterschiedliche Fragen beantworten. Wenn Branchenvertreter die durchschnittliche Restaurantmarge zitieren, meinen sie fast immer die Nettomarge. Den Bruttoanteil des Bildes finden Sie ausführlich in unserem Leitfaden zur Bruttorendite von Restaurants.
Es gibt eine zweite Definitionsfalle, in die Multi-Channel-Betreiber ständig tappen: die Frage, was als Umsatz gilt. Eine Gruppe mit Inhouse- und Deliverybetrieb stellte fest, dass ihr Finanzteam und ihr Betriebsteam unterschiedliche Margen für dasselbe Geschäft auswiesen — die Finanzabteilung verwendete den Bruttoumsatz einschließlich der Lieferplattformgebühren, während der Betrieb die Provision herausrechnete. Beide lagen nicht falsch, aber sie waren nicht vergleichbar, und keine der beiden Zahlen passte sauber zum Benchmark. Klären Sie vor einem Vergleich den Nenner: Wird die Delivery zum Bruttobestellwert oder netto nach Provision erfasst? Ein Fehler hier lässt Sie einer Lücke nachjagen, die tatsächlich eine Definitionsdifferenz ist.
Die Unterscheidung ist wichtiger als sie klingt, denn Delivery hat die Marginenrechnung vieler Betreiber still umgestaltet. Ein Deliveryauftrag kann denselben Wareneinsatz wie ein Inhouse-Tischgast tragen, aber mit einem Fünftel oder mehr seines Wertes an Plattformprovision ankommen, bevor er in die GuV einfließt. Eine Marke, die ihren Delivery-Anteil ausgebaut hat, ohne die Margendefinition zu überprüfen, kann aussehen, als würde sie den Benchmark verfehlen, obwohl die eigentliche Geschichte der Channel-Mix ist, keine operative Schwäche. Die Lösung besteht nicht darin, Delivery aufzugeben, sondern die echte Deckungsmarge jedes Kanals separat zu messen, damit die gemischte Nettomarge verstanden und nicht beschuldigt wird. Erst wenn Brutto und Netto sowie Inhouse und Delivery sauber getrennt sind, sagt der Vergleich mit der durchschnittlichen Restaurantmarge überhaupt etwas aus.
Warum Ihre reale Marge unter dem Benchmark liegt
Sind die Definitionen geklärt, erklärt die Kostenstruktur eines Restaurants den größten Teil der Lücke zwischen Benchmark und Kontostand. Der Wareneinsatz liegt typischerweise bei 28–35 % des Umsatzes, die Personalkosten bei weiteren 28–35 %. Deshalb verfolgen Betreiber den Prime Cost (Wareneinsatz plus Personal) und versuchen ihn bei rund 60 % des Umsatzes zu halten. Die Nettomarge ist schlicht das, was nach Prime Cost, Miete und Gemeinkosten übrig bleibt — ein paar Prozentpunkte Abweichung beim Wareneinsatz oder Personal entscheiden zwischen einer gesunden und einer dünnen Zahl.
Das Problem ist, dass die Marge, von der die meisten Betreiber glauben, sie zu erzielen, theoretisch und nicht real ist. Die theoretische Marge basiert auf Standard-Rezeptkosten und Menüpreisen; die tatsächliche Marge ist das, was die GuV am Periodenende ausweist. Ein Operations-Leiter einer Fast-Casual-Kette mit mehreren Standorten stellte fest, dass die beiden Werte konsistent um 4–5 Prozentpunkte auseinanderdrifteten — zurückzuführen auf Rezeptkosten, die die tatsächlichen Einkaufspreise nicht mehr widerspiegelten. Jedes Mal, wenn ein Lieferantenpreis steigt und die Rezeptkosten nicht aktualisiert werden, driftet die theoretische Marge über die Realität hinaus, und der Betreiber entdeckt die tatsächliche Zahl erst am Monatsende — zu spät, um in dieser Periode zu handeln. Deshalb ist der Vergleich einer veralteten theoretischen Marge mit einem Benchmark in beide Richtungen irreführend. Unser Leitfaden zur Abweichung zwischen theoretischem und tatsächlichem Wareneinsatz erläutert, wie sich diese Lücke isolieren lässt.
Der Wareneinsatz ist in der Regel die sich am schnellsten bewegende der beiden Prime-Cost-Positionen, weshalb er die engste Überwachung verdient. Menüpreise werden einige Male im Jahr angepasst; Zutatenpreise ändern sich jede Woche. Ein Restaurant, das die Menüpreise trotz steigender Lieferantenpreise stabil hält, wird zusehen, wie die Wareneinsatzquote steigt und die Marge sinkt — obwohl sich an Speisekarte oder Betrieb scheinbar nichts geändert hat. Die Verfolgung der Wareneinsatzquote nach Rezept und Standort gegenüber einem Zielwert ist der Unterschied zwischen dem Erkennen dieser Abweichung in Woche zwei und dem Entdecken in den Quartalszahlen. Die Nettomarge, die Sie anstreben, liegt weiter downstream von dieser einen Disziplin als von jeder anderen.
Die Multi-Standort-Falle: Wie ein gemischter Durchschnitt Ihre schlechtesten Standorte verbirgt
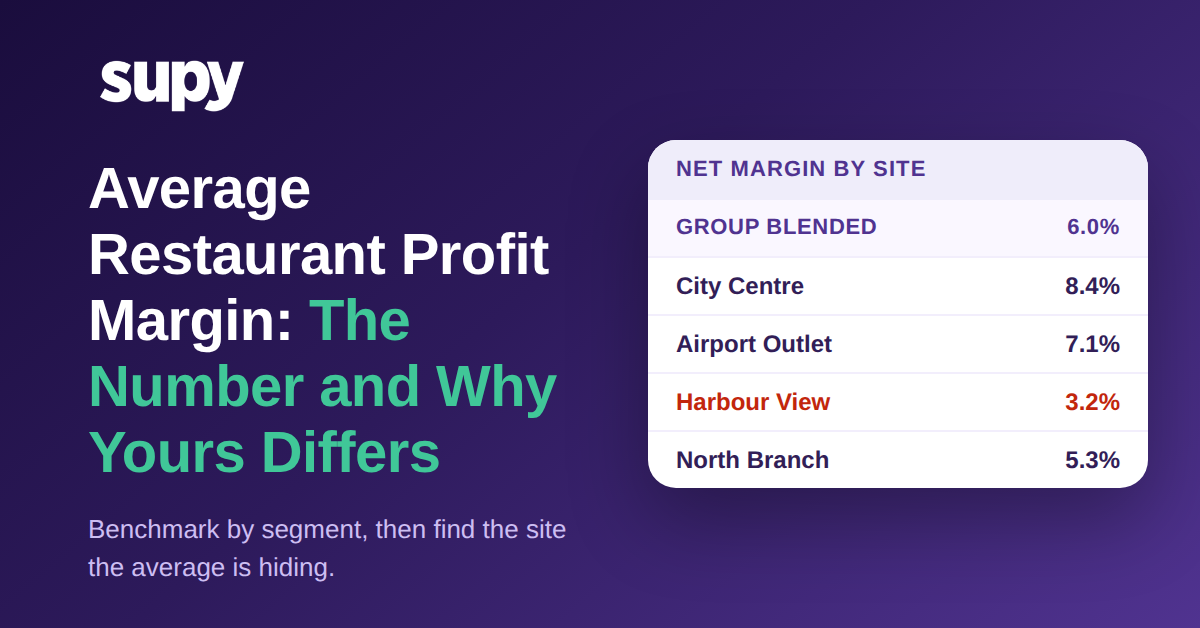
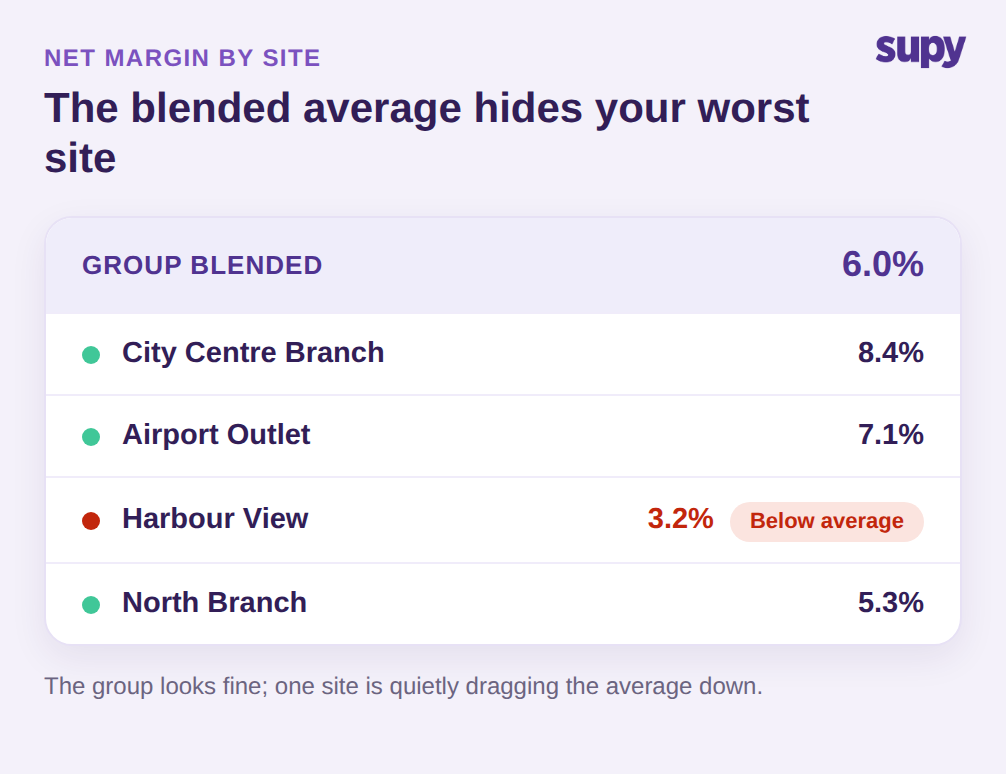
Für eine Gruppe ist die einzige gefährlichste Zahl der eigene gemischte Durchschnitt, denn er verhält sich genau wie der Branchenbenchmark: Er glättet über die Standorte hinweg, die Aufmerksamkeit benötigen. Das Finanzteam eines Casual-Dining-Betreibers mit mehreren Standorten meldete eine stabile gemischte Marge über die Gruppe hinweg und betrachtete dies als Stabilitätsbeweis. Ein vierteljährliches Deep-Dive ergab, dass zwei Standorte mehrere Prozentpunkte unter dem Rest lagen; die gesunden Standorte hatten sie getragen, und die gemischte Zahl hatte die Korrektur um ein volles Quartal verzögert.
Dies ist der Kerngrund, warum eine unternehmensweite durchschnittliche Restaurantmarge für einen Multi-Standort-Betreiber nahezu nutzlos ist. Eine Gruppe, die bequem auf ihrer gemischten Marge sitzt, kann leicht einen Standort mehrere Prozentpunkte darunter und einen anderen mehrere Prozentpunkte darüber enthalten — nur die Standortebene zeigt, wo eingegriffen werden muss. Die Benchmark-Frage für eine Gruppe lautet nie einfach: „Liegen wir über dem Durchschnitt?" Sie lautet: „Welche Standorte liegen unter unserem eigenen Durchschnitt, und um wie viel?" Durchschnitte — ob die der Branche oder die eigenen — sind der Ort, wo Underperformance sich versteckt.
Der Grund, warum diese Falle so verbreitet ist: Die meisten Reports aggregieren vor dem Drilldown. Ein monatliches GuV-Paket kommt als Gesamtgruppenformat an, die gemischte Marge sieht nah genug am Benchmark aus, und niemand stellt die Standortfrage, bis ein Betrieb in echten Schwierigkeiten steckt. Bis dahin hat die Gruppe den schwachen Standort monatelang mitgetragen, und die Erholung ist weit schwieriger als eine kleine Korrektur beim ersten Anzeichen einer Abweichung gewesen wäre. Die Marge nach Standort in jeder Periode zu sehen ist das, was den Benchmark von einer Eitelkeitszahl in ein Frühwarnsystem verwandelt.
Die Stellschrauben, die die Nettomarge tatsächlich bewegen
Preise erhöhen und Portionen kürzen — das ist der Rat, den man überall findet, und beides beeinträchtigt das Gästeerlebnis, bevor es die Marge nennenswert verschiebt. Die Stellschrauben, die die Nettomarge bewegen, ohne die Speisekarte anzutasten, sind operative — und alle hängen davon ab, die realen Zahlen nach Standort zu sehen. Hier kommt Supy ins Spiel, durch eine Warenwirtschaft, die die Lücke zwischen Theorie und Realität zu etwas macht, das Sie in der laufenden Periode angehen können, nicht erst danach.
Supy-Dashboards berechnen den theoretischen Wareneinsatz aus tatsächlichen Rezeptverkaufsmengen und aktuellen Zutatenkosten und vergleichen ihn dann mit dem tatsächlichen Verbrauch — so ist die Lücke, die Ihnen still Margenpunkte kostet, in Echtzeit sichtbar statt erst am Monatsende. Schwundkosten werden für einzelne Artikel und vollständige Rezepte erfasst und geben die Kosten von Verderb und Überproduktion nach Standort und Periode wieder — ein direkter Nettomargenhebel, den die meisten Gruppen nicht einmal messen können. Da jede Zahl nach Standort verfügbar ist, hört der gemischte Durchschnitt auf, die Underperformer zu verbergen: Sie sehen, welcher Standort eine größere Wareneinsatzlücke oder höheren Schwund aufweist, und korrigieren genau diesen — statt die Preise über die gesamte Gruppe anzupassen. Jede dieser Funktionen ist eine Live-Möglichkeit, und zusammen verwandeln sie „unsere Marge liegt unter dem Benchmark" in eine spezifische, standortbezogene Aktionsliste.
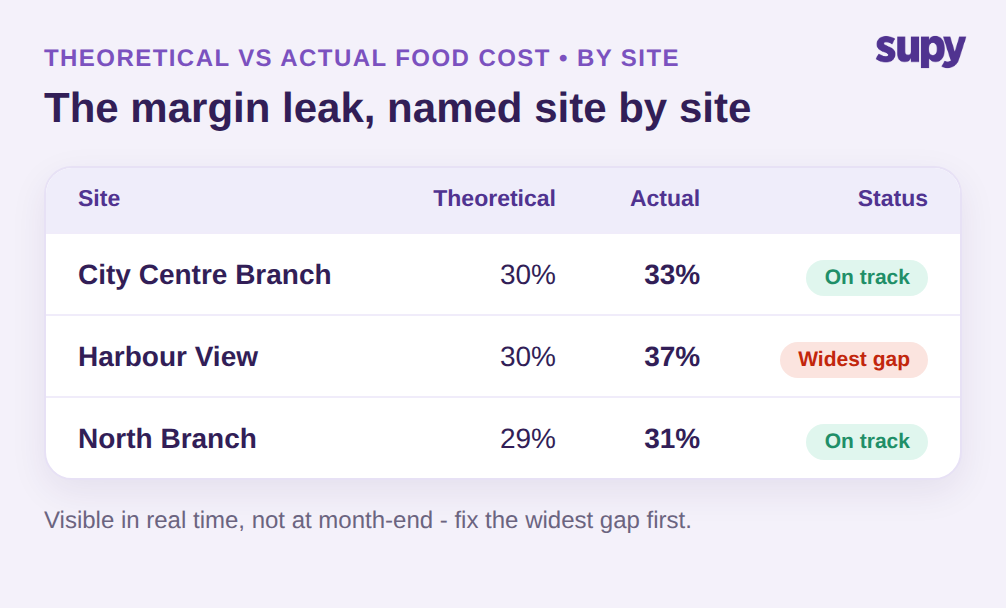
Nutzen Sie den Benchmark als Startlinie, nicht als Ziellinie. Erstens: Positionieren Sie sich — vergleichen Sie Ihre Nettomarge mit der Bandbreite Ihres eigenen Segments (3–5 % Vollservice, 6–9 % Schnellservice und Fast Casual, 2–5 % Fine Dining), nicht mit den pauschalen 3–9 %. Zweitens: Hören Sie auf, die gemischte Zahl zu betrachten, und ordnen Sie Ihre Standorte nach Nettomarge — so werden die unter Ihrem eigenen Durchschnitt liegenden namentlich benannt. Drittens: Messen Sie an jedem schwachen Standort die Lücke zwischen theoretischem und tatsächlichem Wareneinsatz; eine Lücke von 4–5 Prozentpunkten ist eine Periodenmargenansammlung in veralteten Rezeptkosten und nicht erfasstem Schwund. Schließen Sie die größte Lücke zuerst. Die durchschnittliche Restaurantmarge wird erst in dem Moment nützlich, in dem Sie aufhören, sich mit der Branche zu vergleichen, und anfangen, Ihre Standorte miteinander zu vergleichen.