.jpeg)


متوسط هامش الربح في المطاعم: المعايير المرجعية حسب القطاع ولماذا يختلف رقمك
متوسط هامش الربح في المطاعم حسب القطاع
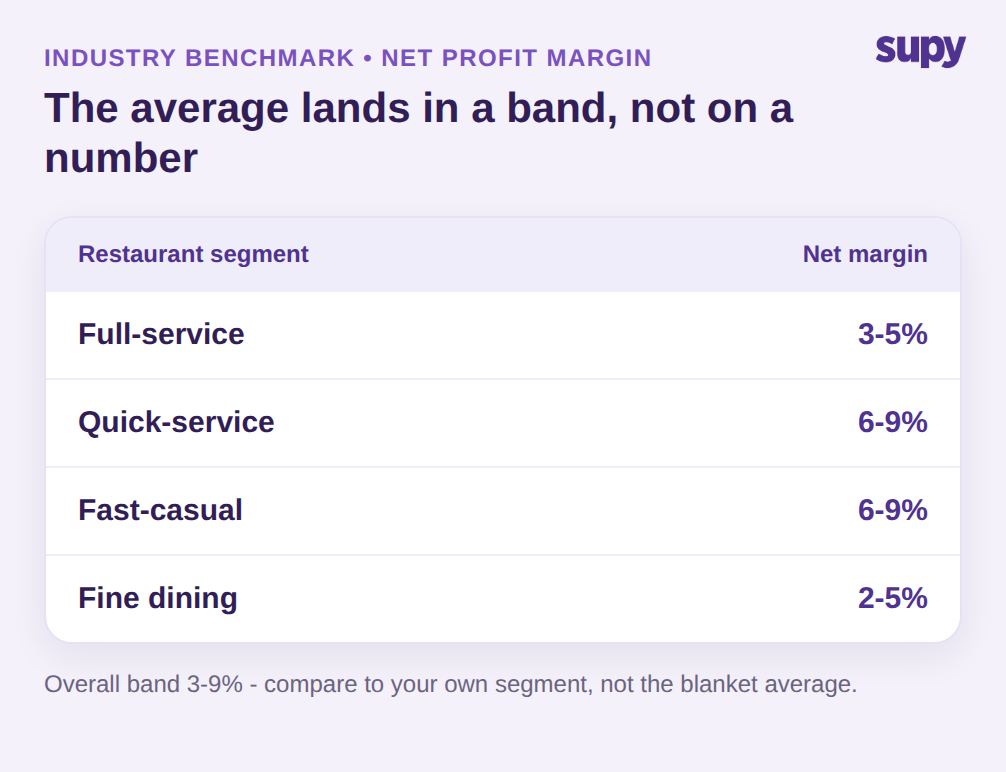
وفق المعايير المرجعية المنشورة في القطاع، يقع متوسط هامش الربح في المطاعم ضمن نطاق 3-9% من الإيرادات. هذا النطاق حقيقي، غير أنه يخفي أكثر مما يكشف، إذ يتباين هامش الربح الصافي بحدة بحسب نموذج الاستغلال. تُحقق مطاعم الخدمة الكاملة عادةً 3-5%. أما مفاهيم الوجبات السريعة والفاست كاجوال، فتتراوح مستوياتها عادةً بين 6 و9%، مستفيدةً من انخفاض كثافة العمالة وبساطة القوائم وارتفاع معدل دوران الطاولات. وتقع مطاعم راقية في الغالب عند الحد الأدنى من النطاق، حول 2-5%، لأن الأسعار المرتفعة في القائمة تُعوَّض بتكلفة الغذاء المرتفعة وأعباء العمالة الثقيلة.
إن الخطوة الأولى المفيدة عند مواجهة أي رقم لمتوسط هامش الربح في المطاعم هي التوقف عن التعامل معه كهدف، والبدء في التعامل معه نقطةً مرجعيةً خاصة بقطاعك. فهامش ربح صافٍ بنسبة 5% يُعدّ عادياً في مطعم راقٍ، لكنه إشارة تحذير لعلامة وجبات سريعة. يخبرك المعيار المرجعي أيَّ مناقشة يجب أن تخوضها، لا ما إذا كان رقمك الخاص صحيحاً. لتحديد ذلك، عليك أن تعرف بدقة أيَّ هامش تقيسه وما الذي يُثقله.
من المفيد أيضاً استحضار معنى الهامش الصافي قبل مقارنته بأرقام الآخرين. الهامش الصافي هو الربح بعد كل التكاليف، معبّراً عنه كنسبة مئوية من الإيرادات، وهذا يجعله الرقم الأضيق والأكثر هشاشةً في قائمة الأرباح والخسائر. بهامش صافٍ 5%، يصمد خمسة سنتات من كل يورو؛ وانخفاض نقطتين في تكلفة الغذاء قد يقسمه إلى النصف. هذه الهشاشة بالذات هي ما يجعل معياراً مرجعياً مُمزَّجاً واحداً أداةً ضعيفة، ولهذا يركّز هذا الدليل على مواطن تكوّن رقمك وأماكن تسرّبه.
هامش الربح الإجمالي في مقابل الهامش الصافي: أيّ الرقمين تقارن؟
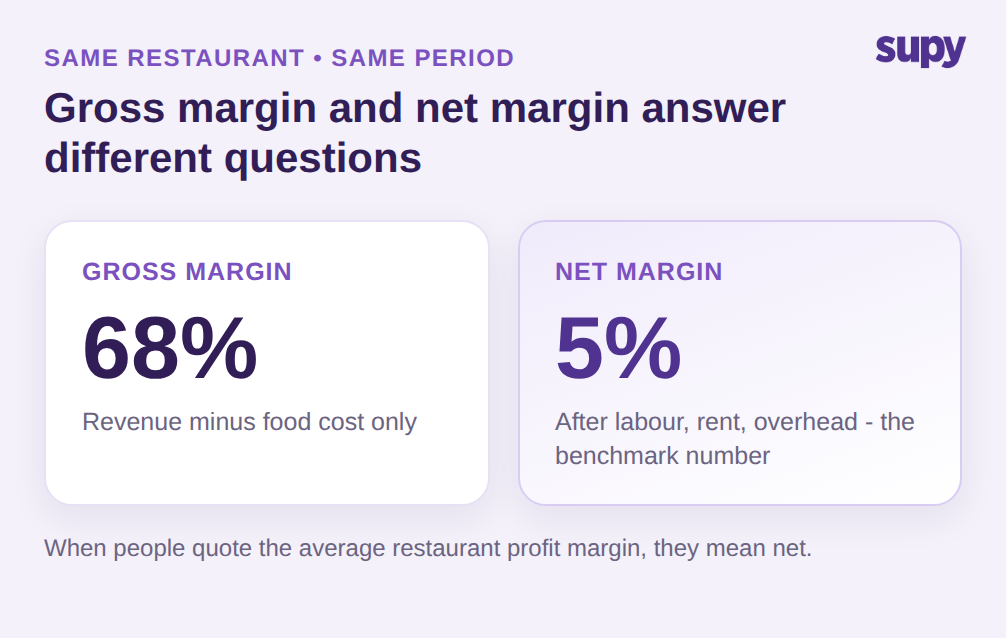
معظم الإرباك حول المعايير المرجعية يبدأ من هنا. هامش الربح الإجمالي هو الإيرادات ناقص تكلفة الغذاء، ويبدو عادةً مُرضياً، غالباً حول ثلثي المبيعات. الهامش الصافي هو ما يتبقى بعد كل شيء آخر: العمالة، والإيجار، والمرافق، والتسويق، والمصاريف العامة. بإمكان المطعم ذاته أن يُظهر هامش ربح إجمالي 68% وهامشاً صافياً 5%، وكلاهما صحيح لأنهما يجيبان على أسئلة مختلفة. حين يستشهد الناس بمتوسط هامش الربح في المطاعم، فهم يعنون في الغالب الهامش الصافي. للاطلاع على تفاصيل الجانب الإجمالي من الصورة، راجع دليلنا حول هامش الربح الإجمالي في المطاعم.
ثمة فخ تعريفي ثانٍ يقع فيه مشغّلو القنوات المتعددة باستمرار: ما يُحتسب إيراداً. اكتشفت إحدى المجموعات التي تشغّل بيع الصالة والتوصيل أن فريقها المالي وفريق العمليات يُبلّغان عن هوامش مختلفة للنشاط ذاته، لأن الفريق المالي استخدم الإيرادات الإجمالية شاملةً عمولات منصات التوصيل، بينما استبعد فريق العمليات العمولة. لم يكن أيٌّ منهما مخطئاً، لكنهما لم يكونا قابلَين للمقارنة، ولم يتطابق أيٌّ منهما مع المعيار المرجعي بدقة. قبل مقارنة رقمك بأي متوسط، حدّد المقام: هل يُحتسب التوصيل بالقيمة الإجمالية للطلب أم صافياً من العمولة؟ خطأ في ذلك سيجعلك تطارد فجوةً ليست في الواقع سوى فارق في التعريف.
التمييز أهم مما يبدو، إذ أعاد التوصيل بصمت رسم معادلة الهامش لكثير من المشغّلين. يحمل طلب التوصيل تكلفة الغذاء ذاتها التي يحملها الغطاء الداخلي، لكنه يصل بعد اقتطاع خُمس قيمته أو أكثر كعمولة منصة، قبل أن يظهر في قائمة الأرباح والخسائر. قد تبدو العلامة التجارية التي وسّعت نصيب التوصيل لديها دون إعادة النظر في تعريف هامشها كأنها تفوتها المعايير المرجعية، في حين أن القصة الحقيقية هي مزيج القنوات لا ضعف التشغيل. الحل ليس التخلي عن التوصيل، بل قياس هامش المساهمة الحقيقي لكل قناة بشكل منفصل، كي يُفهم الرقم الصافي المُمزَّج بدلاً من اتهامه. لا تُخبرك مقارنة نفسك بمتوسط هامش الربح في المطاعم بأي شيء إلا حين يُفصل هامش الربح الإجمالي عن الهامش الصافي، وبيع الصالة عن التوصيل.
لماذا هامشك الفعلي يقع تحت المعيار المرجعي
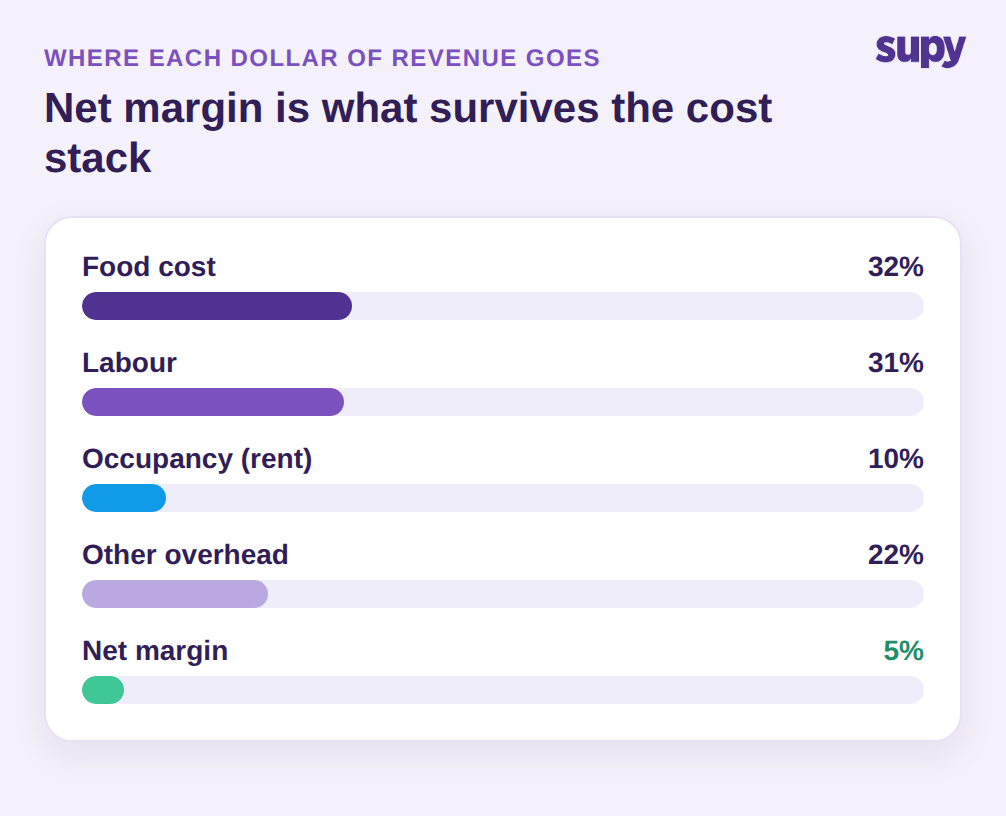
بمجرد توضيح التعريفات، يُفسّر هيكل تكاليف المطعم معظم الفجوة بين المعيار المرجعي ورصيد الحساب المصرفي. تُشكّل تكلفة الغذاء عادةً 28-35% من المبيعات، وتضيف العمالة 28-35% أخرى، ولهذا يتابع المشغّلون التكلفة الأولية (تكلفة الغذاء مع العمالة) ويسعون إلى إبقائها في حدود 60% من المبيعات. الهامش الصافي هو ببساطة ما يصمد بعد التكلفة الأولية والإيجار والمصاريف العامة، وبضعة نقاط من التباين في تكلفة الغذاء أو العمالة هي الفارق بين رقم صحي ورقم هشّ.
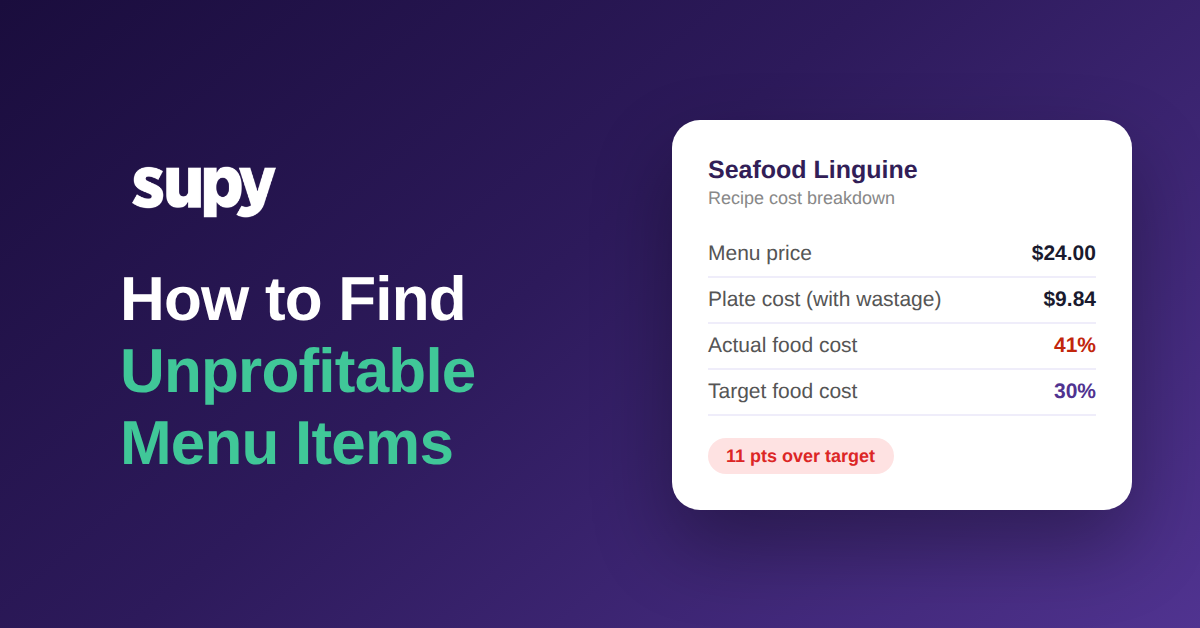
المشكلة أن الهامش الذي يعتقد معظم المشغّلين تحقيقه هو هامش نظري، لا هامش فعلي. يُبنى الهامش النظري من تكاليف الوصفات المعيارية وأسعار القوائم؛ أما الهامش الفعلي فهو ما ترصده قائمة الأرباح والخسائر في نهاية الفترة. وجد رئيس عمليات في سلسلة فاست كاجوال متعددة المواقع أن الرقمين يتباعدان باستمرار بمقدار 4-5 نقاط، بسبب تكاليف وصفة لم تعد تعكس أسعار الشراء الفعلية. في كل مرة يرتفع فيها سعر مورّد ولا تُحدَّث تكلفة الوصفة، يحلّق الهامش النظري فوق الواقع، ولا يكتشف المشغّل الرقم الحقيقي إلا في نهاية الشهر، وهو وقت متأخر جداً للتصرف في تلك الفترة. لهذا يكون مقارنة هامش نظري قديم بمعيار مرجعي مُضلِّلاً في الاتجاهين. يشرح دليلنا حول التباين بين تكلفة الغذاء النظرية والفعلية كيفية عزل مصدر هذه الفجوة.
تكلفة الغذاء هي عادةً أكثر عنصري التكلفة الأولية تذبذباً، لذا تستحق المراقبة الأدق. تُعاد أسعار القوائم مراجعتها بضع مرات في السنة؛ أما أسعار المكوّنات فتتحرك كل أسبوع. مطعم يُثبّت أسعار قائمته رغم ارتفاع أسعار المورّد سيرى نسبة تكلفة الغذاء ترتفع وهامشه ينخفض، حتى وإن لم يتغير شيء ظاهرياً في القائمة أو التشغيل. تتبّع نسبة تكلفة الغذاء مقابل هدف لكل وصفة ولكل موقع هو ما يجعل اكتشاف هذا الانحراف في الأسبوع الثاني بدلاً من الأرقام الربع سنوية أمراً ممكناً. الهامش الصافي الذي تنشده يعتمد على هذه الانضباطية الواحدة أكثر من أي انضباطية أخرى.
فخ المواقع المتعددة: كيف يُخفي المتوسط المُمزَّج مواقعك الأضعف أداءً
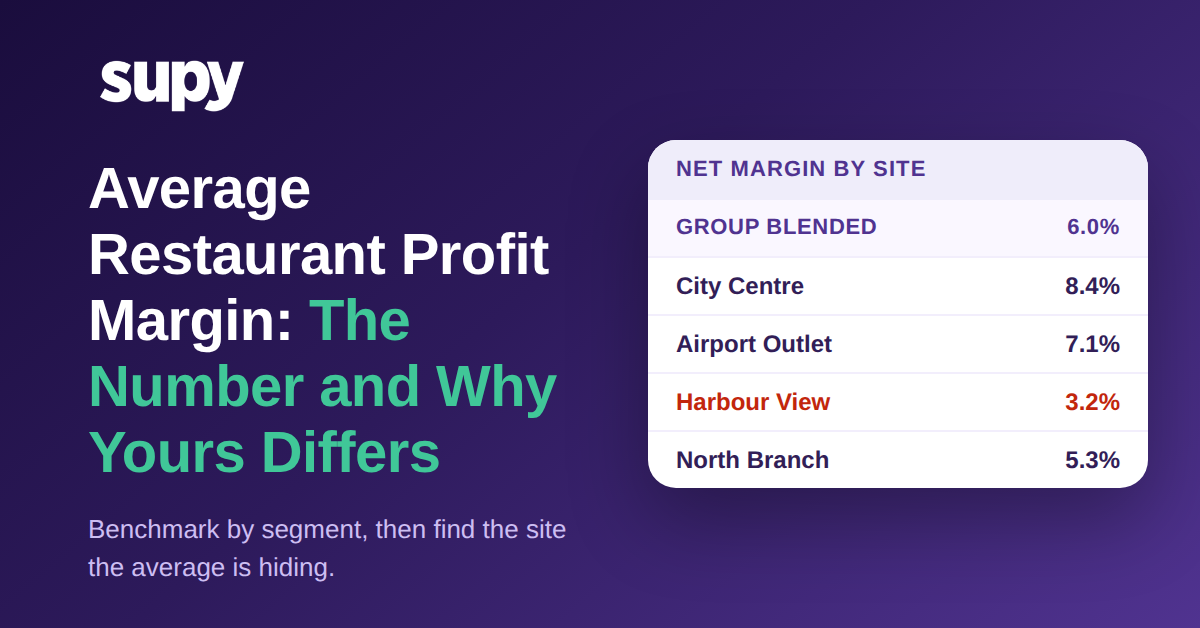
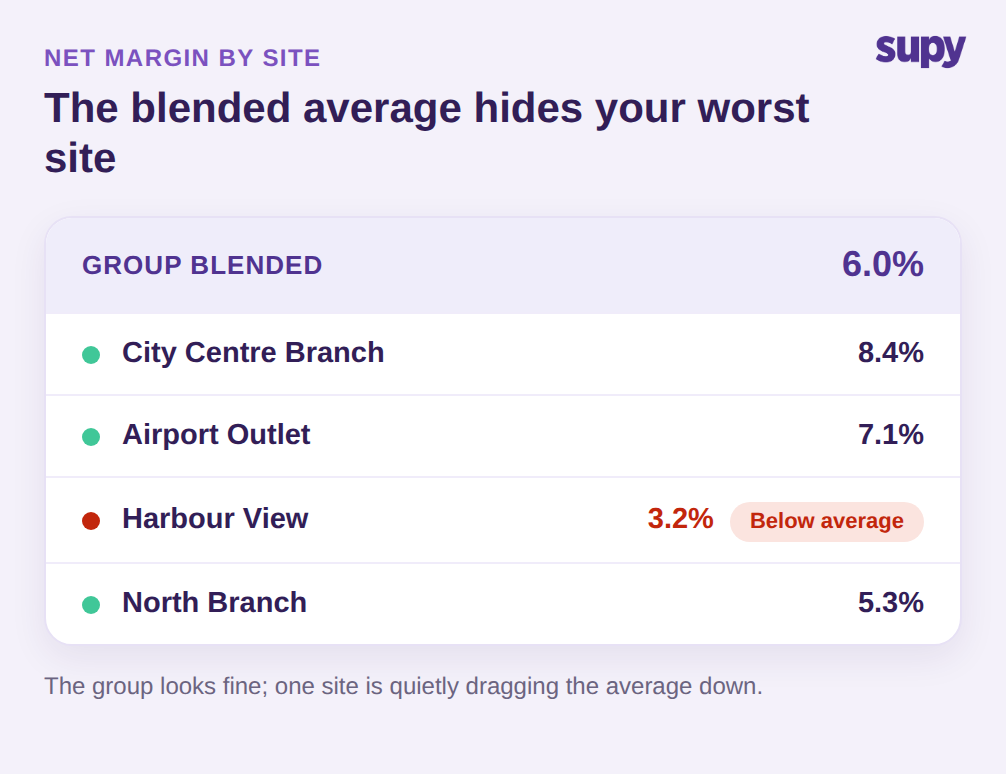
في سياق المجموعات، الرقم الأكثر خطورة هو المتوسط المُمزَّج الخاص بها، لأنه يتصرف تماماً كالمعيار المرجعي للصناعة: يُسوّي التباينات بين المواقع التي تحتاج اهتماماً. أبلغ الفريق المالي لمشغّل ضيافة عادية متعدد المواقع عن هامش مُمزَّج مستقر عبر المجموعة وتعامل معه كدليل على الاستقرار. كشف تعمق ربع سنوي أن موقعين كانا يعملان بعدة نقاط دون باقي المواقع؛ وكانت المواقع الصحية تتحمل العبء عنهما، وقد أخّر الرقم المُمزَّج التصحيح ربعاً كاملاً.
هذا هو السبب الجوهري في أن متوسط هامش الربح على مستوى الشركة أداة شبه عديمة الفائدة لمشغّل متعدد المواقع. مجموعة مرتاحة على هامشها المُمزَّج يمكن أن تحتوي بسهولة على موقع يقع بعدة نقاط دونها وآخر يقع بعدة نقاط فوقها، ولا توضّح أين يجب التدخل إلا النظرة على مستوى الموقع. سؤال المعيار المرجعي لمجموعة لا يكون أبداً مجرد: "هل نحن فوق المتوسط؟" بل: "أيّ المواقع يقع تحت متوسطنا الخاص، وبكم؟" المتوسطات، سواء كانت متوسطات الصناعة أو الداخلية، هي المكان الذي تختبئ فيه الأداءات الضعيفة.
السبب في شيوع هذا الفخ أن معظم التقارير تُجمّع قبل أن تُحلّل. يصل ملف قائمة الأرباح والخسائر الشهرية بصيغة إجمالي المجموعة، ويبدو الهامش المُمزَّج قريباً بما يكفي من المعيار المرجعي، ولا يطرح أحد السؤال على مستوى الموقع إلا حين يقع موقع في مشكلات حقيقية. حينئذٍ تكون المجموعة قد تحمّلت عبء الموقع الضعيف لأشهر، ويكون التعافي أصعب بكثير مما كان سيكون عليه تصحيح بسيط عند أول بادرة انحراف. رؤية الهامش حسب الموقع في كل فترة هي ما يحوّل المعيار المرجعي من رقم يُتباهى به إلى نظام إنذار مبكر.
الرافعات التي تحرّك الهامش الصافي فعلاً
رفع الأسعار وتقليص الأحجام هو النصيحة المنتشرة في كل مكان، وكلاهما يُدهور تجربة الضيف قبل أن يُحرّك الهامش كثيراً. الرافعات التي تحرّك الهامش الصافي دون المساس بالقائمة هي رافعات تشغيلية، وتعتمد كلها على رؤية الأرقام الفعلية حسب الموقع. هنا يتدخل Supy، من خلال إدارة المخزون التي تحوّل الفجوة بين النظري والفعلي إلى شيء يمكن التصرف بشأنه خلال الفترة، لا بعدها.
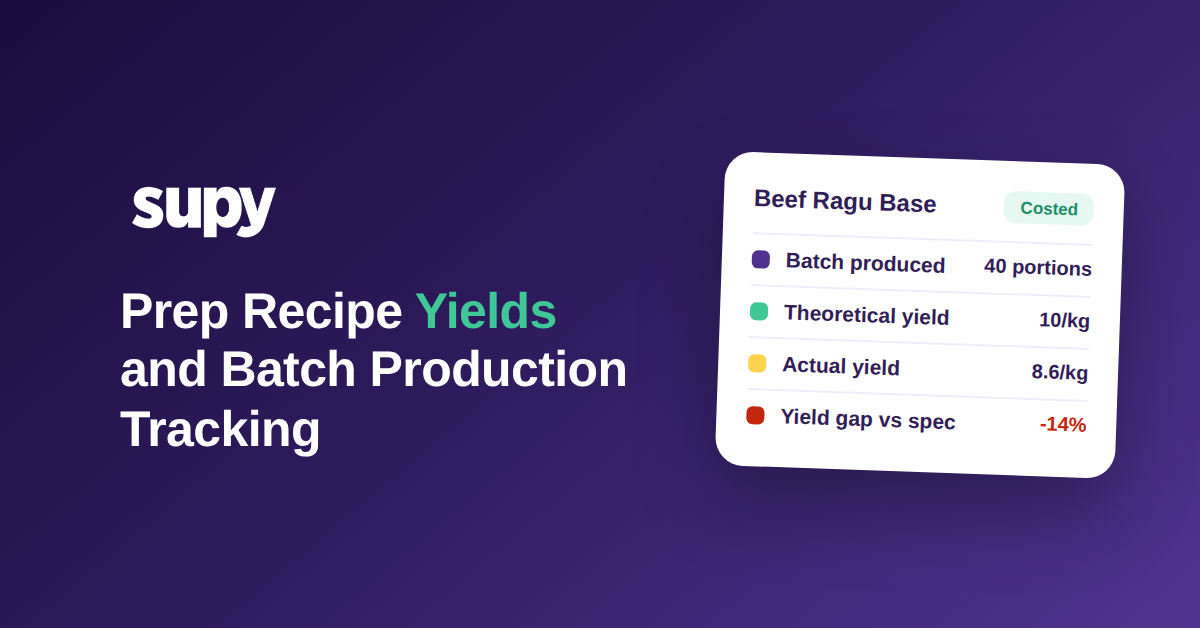
تحسب لوحة معلومات Supy تكلفة الغذاء النظرية من كميات مبيعات الوصفة الفعلية وتكاليف المكوّنات الحالية، ثم تقارنها بالاستهلاك الفعلي — وبذلك تكون الفجوة التي تُكلّفك صامتةً نقاط هامش مرئيةً في الوقت الفعلي لا في نهاية الشهر. يُتتبَّع الهدر لكل من المنتجات الفردية والوصفات الكاملة، ويُقدّم تكلفة الهدر والإنتاج الزائد حسب الفرع والفترة — وهو رافعة مباشرة على الهامش الصافي لا تستطيع معظم المجموعات حتى قياسها. لأن كل رقم متاح حسب الموقع، يتوقف المتوسط المُمزَّج عن إخفاء ضعاف الأداء: يمكنك رؤية أي موقع يُفرز فجوةً في تكلفة الغذاء أوسع أو هدراً أعلى، وتصحيح ذاك الموقع تحديداً، بدلاً من رفع الأسعار على مستوى المجموعة. كل ميزة من هذه الميزات قدرة حية، وتجتمع معاً لتحوّل "هامشنا دون المعيار المرجعي" إلى قائمة إجراءات محددة حسب الموقع.
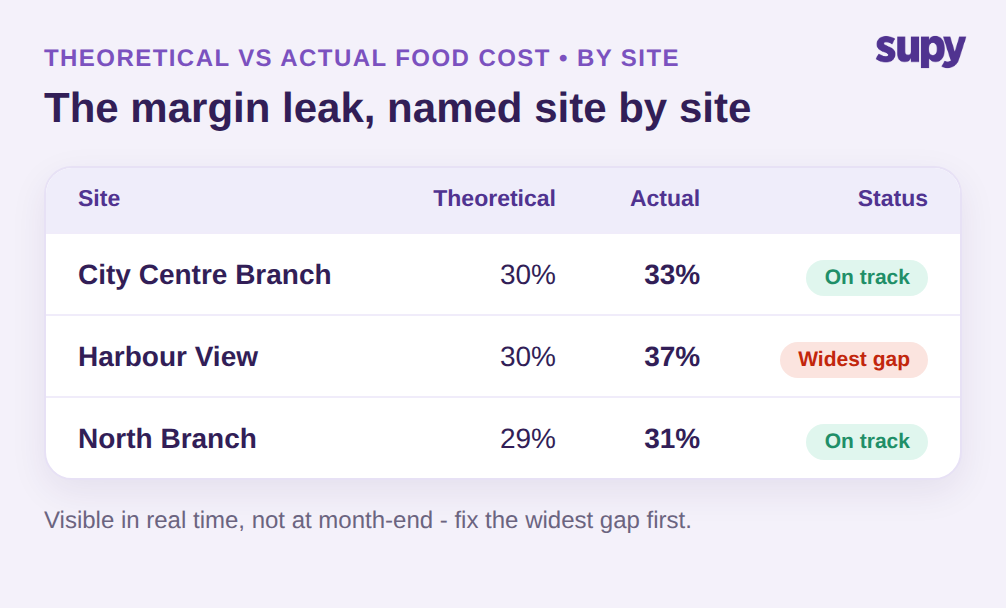
استخدم المعيار المرجعي نقطةَ انطلاق لا نقطةَ وصول. أولاً: ضع نفسك في السياق الصحيح — قارن هامشك الصافي بنطاق قطاعك الخاص (3-5% خدمة كاملة، 6-9% وجبات سريعة وفاست كاجوال، 2-5% مطاعم راقية)، لا بنطاق 3-9% الشامل. ثانياً: توقف عن النظر في الرقم المُمزَّج ورتّب مواقعك حسب الهامش الصافي، لتُسمّي المواقع الواقعة دون متوسطك الخاص. ثالثاً: في كل موقع ضعيف، قِس الفجوة بين تكلفة الغذاء النظرية والفعلية؛ فجوة 4-5 نقاط هي هامش فترة كامل مدفون في تكاليف وصفات قديمة وهدر غير مُسجَّل. أغلق الفجوة الأكبر أولاً. لا يصبح متوسط هامش الربح في المطاعم مفيداً إلا حين تتوقف عن مقارنة نفسك بالصناعة وتبدأ في مقارنة مواقعك ببعضها.