Cost Variance Report by Restaurant Location: Which Site Is Leaking?
Why One Group Variance Number Hides Your Worst Location
A cost variance report by restaurant location compares each site's actual food cost against its theoretical cost, then shows the gap site by site. A single blended figure averages a severe problem at one location into an acceptable group total. The group looks healthy while one kitchen loses margin every week.
Break the number apart and the problem has nowhere to hide.
- Location. Read variance by location first.
- Category and period. Then read by category and period inside the worst site.
You move from a group average to one site, one category, one week.
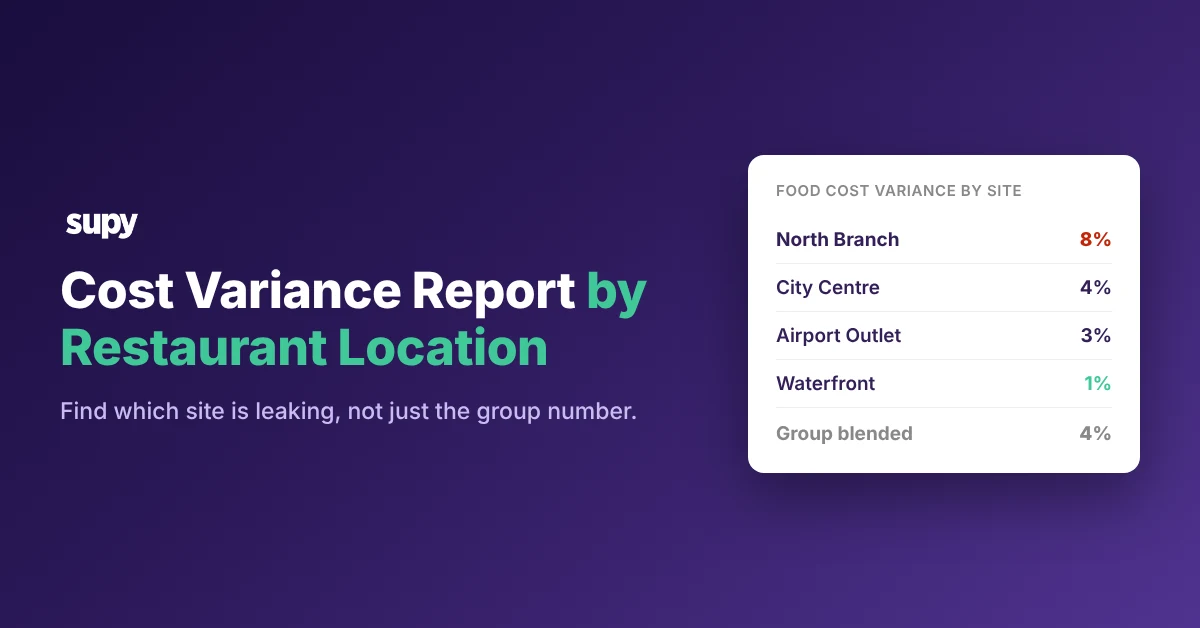
Say a four-site group reads a blended 4% variance. Split it and one site sits at 8% while the others hold between 1% and 4%. The group looks on target while one kitchen runs at double the blend, and the group number never shows it.
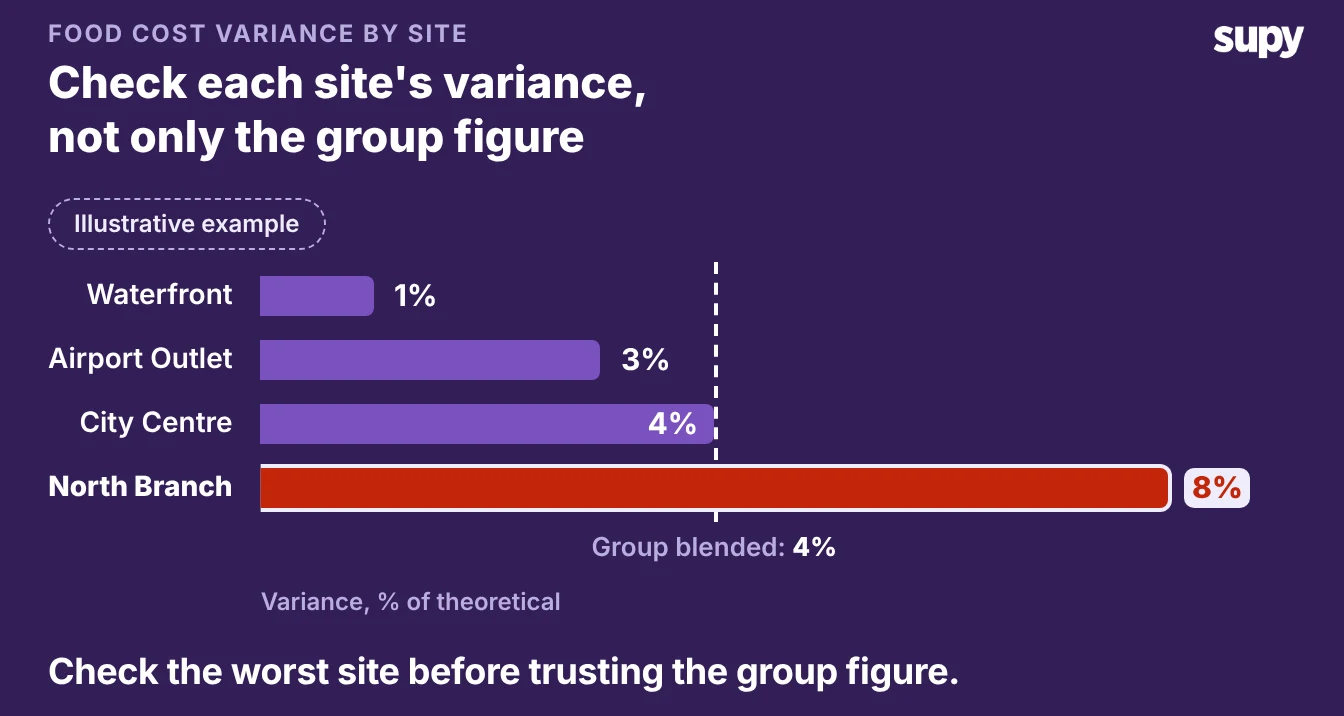
Read Variance by Location, Category and Period
Reading variance at three levels turns a flat group number into a map of where margin is lost.
- Location. Start at location to find the site.
- Category. Drop into category to see whether it is proteins, produce or beverages.
- Period. Read by period to tell whether it is every week or one bad count.
A restaurant analytics platform that tracks theoretical-versus-actual variance by site does this without a month-end spreadsheet merge. You open one view, sort every location by variance, and click into the worst branch. The drill-down carries you from the group figure to the dish.
Operators ask for this directly. Multi-venue groups want cost of goods and variance reported per location, not one consolidated group figure, because the group view cannot name which branch is losing money.
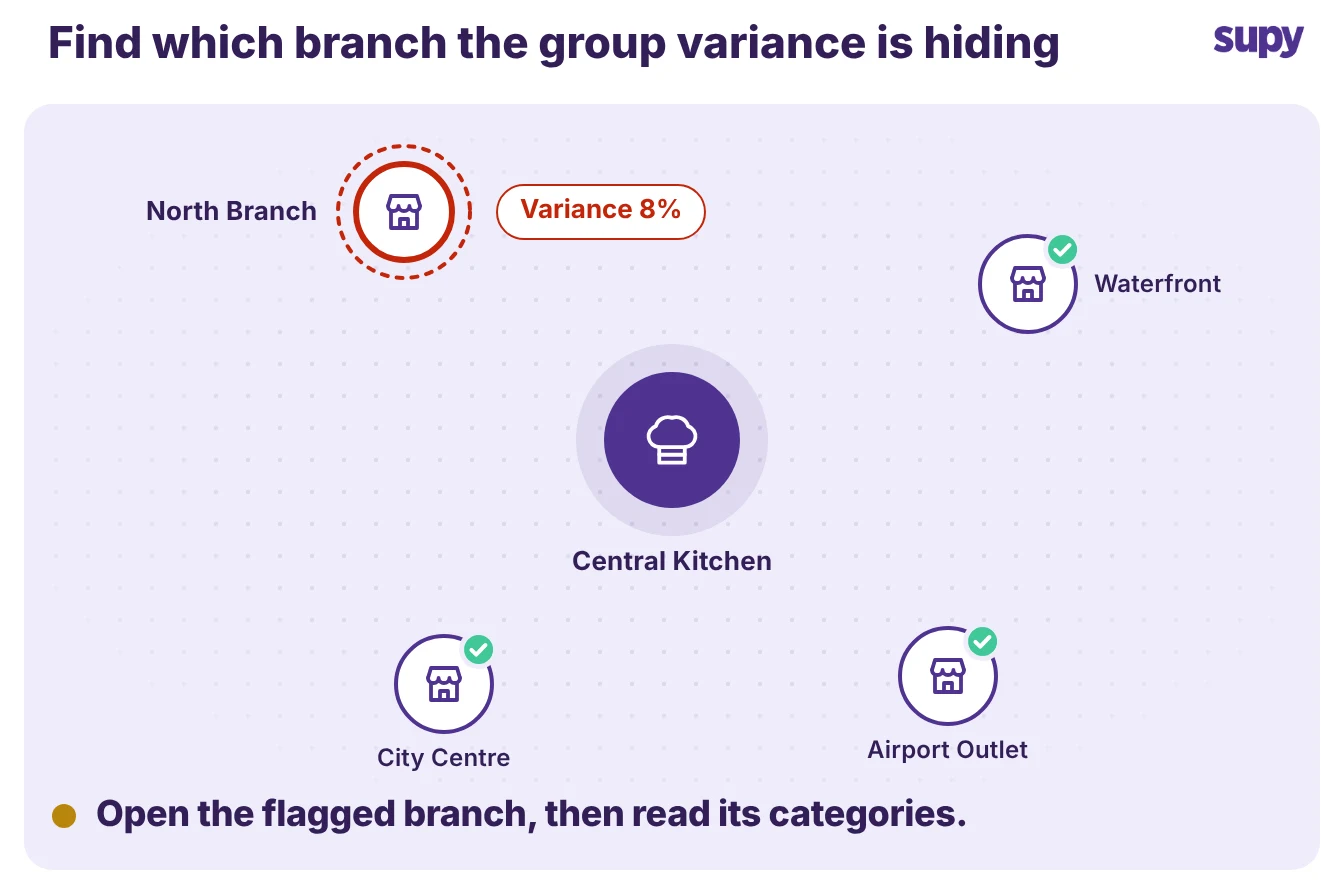
Find the Cause Once You Know the Site
A per-location variance number tells you where, not why. Three causes account for most of the gap, and each leaves a different trace in the report.
| Cause | What the report shows | First fix |
|---|---|---|
| Over-portioning | One category runs high at one site, week after week | Reweigh portions against the recipe, then retrain the line |
| Receiving gaps | Variance spikes in the weeks with large deliveries | Check goods received notes against invoices at the door |
| Inconsistent counts | Variance swings between periods with no menu change | Standardise the count: one template, one setting, one cut-off |
Read the pattern before you act.
A category that is high every week is a portioning or price problem. A category that spikes only when a big delivery lands is a receiving problem. A number that lurches up and down with no menu change is a counting problem, not a kitchen problem.
Catch Receiving Gaps at the Door, Not at Month-End
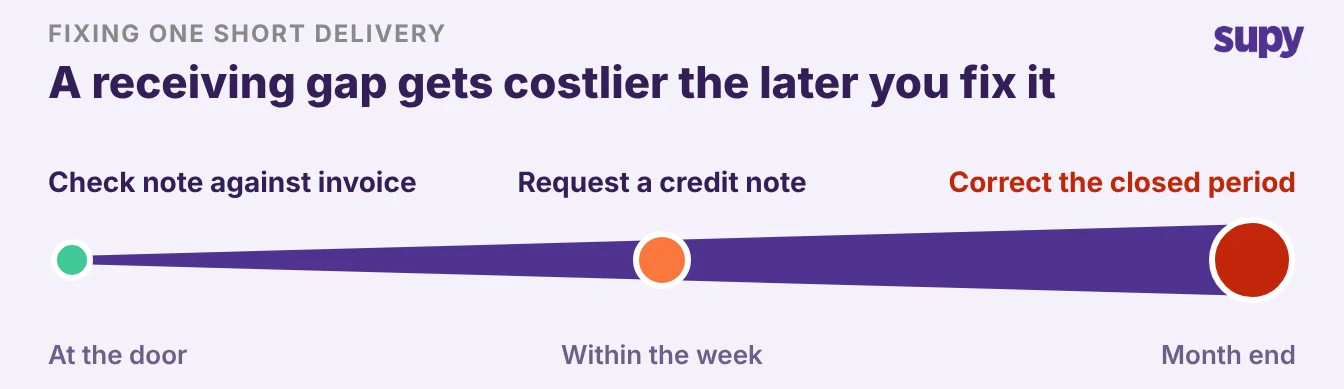
When you catch a receiving gap decides what it costs to fix. A short delivery or an overcharge spotted at the door takes one correction.
The same gap found at month-end is already baked into the variance, and often into the next order. Invoice discrepancies left to the finance team get caught centrally and late, which is how one site's receiving quietly inflates its cost of sales. Work it earliest first.
- At the door. Check the goods received note against the invoice and reject or short the line there.
- Within the week. Request a credit note while the supplier still has the delivery on record.
- By month-end. The gap has posted to variance, so you are unwinding a closed period instead of correcting a delivery.
Make the Numbers Trustworthy First
A variance report is only as accurate as the counts behind it. When staff skip variance checks because updating every outlet by hand takes too long, or a count runs with the wrong setting, the report points at the wrong site. Fix the inputs before you trust the output.
Once the counts are clean, the variance report lists every item where the counted quantity differs from the theoretical figure, for one location at a time. Each line carries the cost of its variance, so a costly line outranks one that moved more units. You work the money, not the quantity.
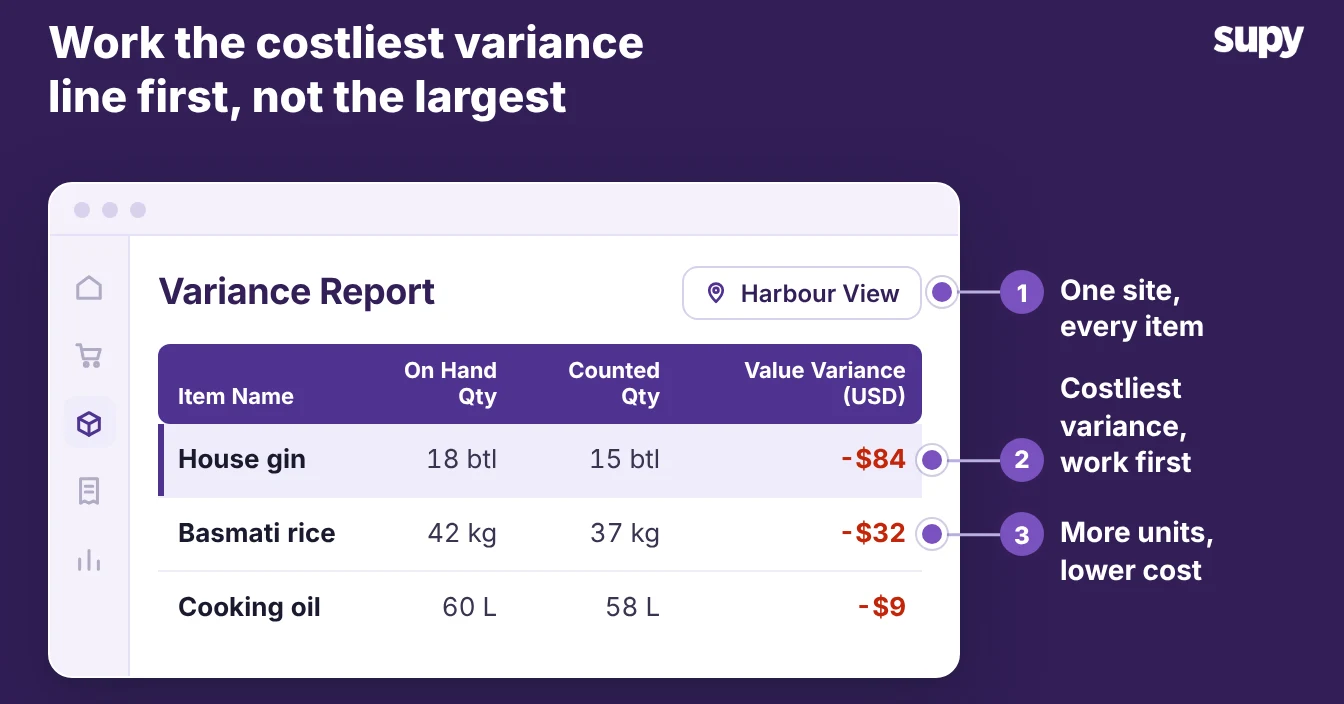
Three habits keep the report honest:
- Count every item the same way. One template in shelf order, with uncounted items set to zero, so a skipped line shows as a gap rather than phantom variance across the group.
- Lock the period before you read it. Set a cut-off so late invoices and transfers land in the right month, or the variance moves after you have acted on it.
- Make counting fast enough to actually happen. Supy's stock counting cuts counting time by over 50%, so a busy site stops skipping the count that feeds the report.
Name your situation, then take the one step for it.
- You cannot split the number yet. You hold only a group figure. Get variance by site for one period, even in a spreadsheet. The gap between your best and worst site is the size of the prize.
- One site is clearly worst. Read its variance by category for the last few periods. A category high every week points at portioning or price; a category that spikes with deliveries points at receiving.
- Every site swings period to period. Fix the count before the causes. Standardise the template and the cut-off, then re-read next period.
A group variance number tells you the group has a problem. A cost variance report by restaurant location tells you which kitchen, which category and which week.
That is the difference between knowing you lose margin and stopping it. As part of wider food cost management, the report turns one worrying number into a short list of fixes.