.jpeg)

Coût des recettes en restauration : moyenne pondérée, formule et traçabilité

Comment le coût d’une recette est réellement calculé : une moyenne pondérée glissante, pas le dernier prix payé
Le coût d’une recette est calculé à partir d’une moyenne pondérée glissante de ce que vous avez payé pour chaque ingrédient encore en stock, et non du dernier prix facturé. La formule est simple : additionnez la valeur de votre stock existant à la valeur du nouvel achat, puis divisez par la quantité combinée. Ce coût unitaire mixte, multiplié par la quantité utilisée dans la recette, correspond au coût de l’ingrédient.
Voici pourquoi cela surprend. Supposons que vous déteniez 20 kg de poulet achetés à 6,00 $ le kg, soit une valeur de stock de 120,00 $, et que vous en receviez 30 kg supplémentaires à 7,20 $ le kg, valant 216,00 $. Le système ne bascule pas sur le nouveau prix de 7,20 $. Il effectue un mélange : 336,00 $ de valeur pour 50 kg correspond à un coût moyen pondéré de 6,72 $ le kg. Un plat utilisant 0,25 kg de poulet est donc valorisé à 1,68 $, et non à 1,80 $ que la dernière facture seule suggérerait.
Cet écart est la raison la plus fréquente pour laquelle un coût de recette semble trop bas. L’opérateur se souvient d’avoir payé 7,20 $ et s’attend à ce que le plat le reflète, mais la moyenne pondérée reste en dessous de la dernière facture car un stock plus ancien et moins cher est encore utilisé. Le chiffre n’est pas erroné. C’est le véritable coût des ingrédients que vous cuisinez en ce moment, ce qui est exactement ce qu’un système de calcul des coûts de recettes est conçu pour afficher.

Pourquoi la même recette coûte différemment d’une semaine et d’un établissement à l’autre
Parce que la moyenne pondérée est recalculée à chaque réception de stock, le coût d’une recette est une donnée variable, pas une valeur fixe. Achetez à un prix plus élevé et le coût mixte augmente progressivement au cours des jours suivants, à mesure que le stock moins cher s’épuise. C’est normal, et c’est pourquoi un coût capturé dans une feuille de calcul une fois par trimestre devient rapidement obsolète, un problème abordé dans calcul des coûts de recettes sur tableur versus logiciel.
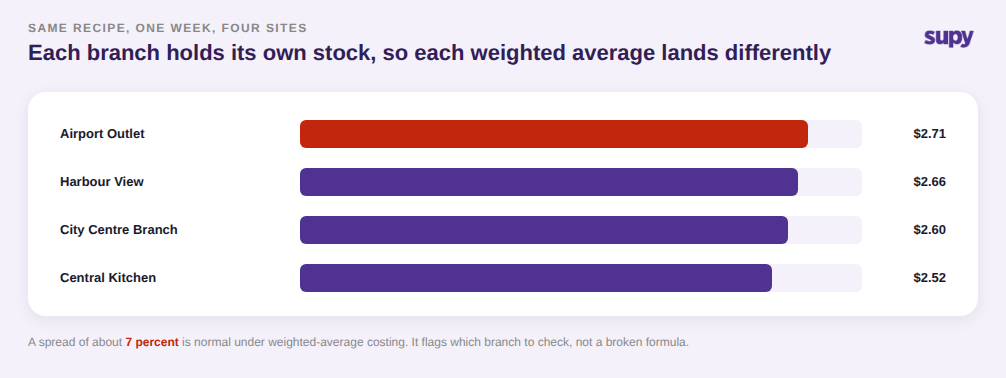
Le même effet se produit d’un établissement à l’autre. Chaque succursale détient son propre stock, acheté à ses propres prix, reçu selon son propre calendrier, de sorte que la moyenne pondérée de chaque site évolue indépendamment. La même recette peut coûter 2,52 $ dans un établissement et 2,71 $ dans un autre au cours de la même semaine, soit un écart d’environ 7 %, sans que rien ne soit anormal. Comprendre cela permet d’éviter la recherche inutile d’un « coût unique » et de recentrer la question sur les établissements dont les coûts dérivent et pourquoi.
D’où vient un coût qui semble erroné : la configuration des articles et la réception, pas la formule
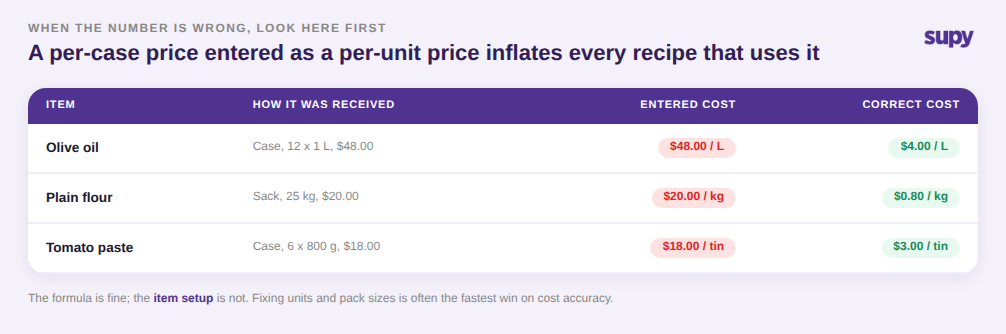
Quand un coût de recette est réellement faux, la formule est rarement en cause. La cause habituelle réside dans la façon dont l’ingrédient a été configuré ou réceptionné : une taille d’emballage, une conversion d’unité, ou un prix par caisse saisi comme un prix à l’unité. Une erreur à cette étape se propage silencieusement à grande échelle dans toutes les recettes utilisant cet article.
Le schéma est facile à repérer une fois qu’on le cherche. De l’huile d’olive achetée en caisse de douze bouteilles de 1 litre pour 48,00 $ devrait coûter 4,00 $ le litre ; saisie comme une unité unique, elle affiche 48,00 $ le litre, soit douze fois trop cher. Un sac de 25 kg de farine à 20,00 $ revient à 0,80 $ le kg, pas à 20,00 $. Nettoyer ces données de référence est souvent le levier le plus rapide sur la précision des coûts, c’est pourquoi la qualité des données articles compte plus que la plupart des opérateurs ne le pensent.
Comment les coûts des recettes de préparation et sous-recettes sont répartis lorsqu’un lot produit plusieurs sorties
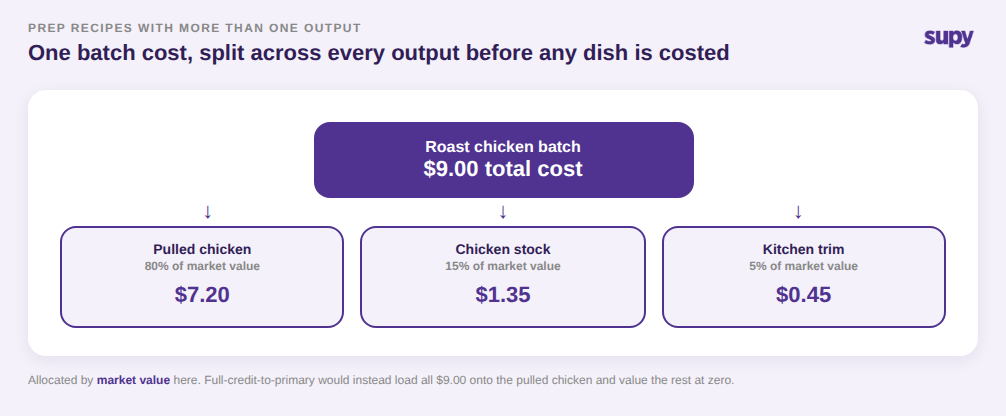
Les recettes de préparation compliquent le calcul car un lot produit souvent plus d’une sortie utilisable. Faites rôtir un lot de poulet pour 9,00 $ en ingrédients et préparation, et vous obtenez du poulet effiloché, du bouillon et des parures. Chacun de ces éléments devient un ingrédient dans d’autres recettes, donc le coût du lot doit être réparti entre eux avant qu’un plat fini puisse être correctement valorisé.
Supy gère cela avec une stratégie que vous choisissez par recette : répartir le coût du lot proportionnellement à la valeur marchande de chaque sortie, ou attribuer le crédit total à la sortie principale. Répartir le lot de 9,00 $ par valeur marchande pourrait allouer 7,20 $ au poulet effiloché, 1,35 $ au bouillon et 0,45 $ aux parures. Choisir le crédit total charge l’intégralité des 9,00 $ sur le poulet effiloché et valorise le bouillon et les parures à zéro. Ni l’un ni l’autre n’est plus correct dans l’absolu ; l’important est que le choix soit explicite et cohérent, afin que les coûts des recettes en aval soient justifiables. Si vous gérez des préparations à haut rendement, les rendements des recettes de préparation et le suivi de la production par lots mérite d’être lu en complément.
Comment prouver un coût de recette à un auditeur : la piste horodatée
Un auditeur ne veut pas uniquement le chiffre du coût. Il veut voir comment vous y êtes parvenu, ce qui signifie montrer l’historique des prix et le calcul qui sous-tend le chiffre, pas seulement la valeur du jour. C’est là qu’une feuille de calcul statique échoue : elle conserve le chiffre actuel sans trace de ce qu’il était le mois dernier ni pourquoi il a changé.
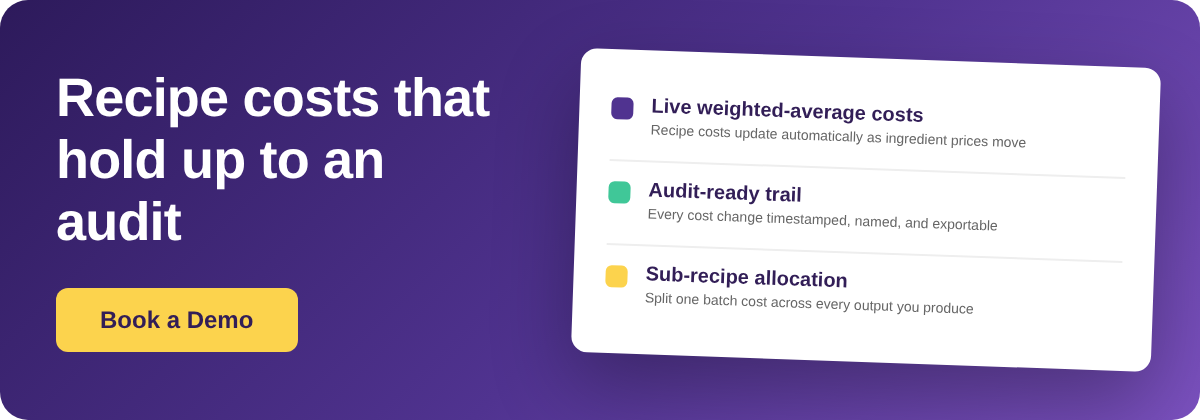
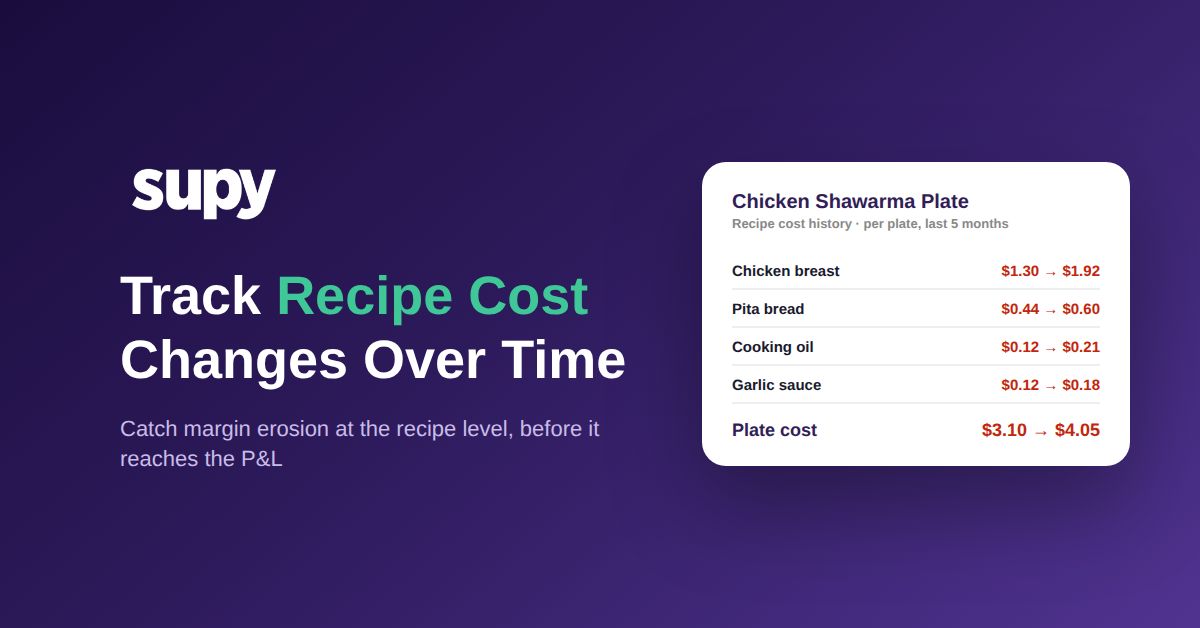
Supy conserve ce registre automatiquement. Chaque fois qu’un prix d’ingrédient change, les coûts des recettes concernées sont recalculés et une entrée horodatée est conservée indiquant ce qui a provoqué la variation, liée à l’utilisateur nommé et verrouillée afin de ne pouvoir être ni modifiée ni supprimée après coup. Pour prouver un coût à un auditeur, procédez en trois étapes : premièrement, montrez l’événement de changement de prix, par exemple le poulet passant de 6,00 $ à une moyenne pondérée de 6,72 $ ; deuxièmement, montrez le recalcul déclenché, avec la composante poulet du plat passant de 1,50 $ à 1,68 $ ; troisièmement, exportez la piste pour la période sous revue. Cette séquence transforme « faites confiance à notre chiffre » en une chaîne documentée et infalsifiable que tout auditeur peut suivre. Le tableau complet du calcul automatisé des coûts se trouve dans la présentation du logiciel de calcul des coûts de recettes.

Mettez le chiffre en pratique. Dans l’exemple ci-dessus, un coût de plat de 2,60 $ pour un prix de menu de 9,00 $ représente un coût matière de 28,9 %, bien dans la fourchette saine de 28 à 32 %. Utilisez cela comme indicateur : si le coût moyen pondéré d’un article à fort volume a augmenté alors que son prix de menu n’a pas suivi, ou si le coût de la même recette s’écarte de plus de quelques pour cent d’un établissement à l’autre, c’est le signal de revérifier la configuration des articles, de recompter le stock ou de revoir les prix — avant que la dérive ne grignote silencieusement un mois de marge.