.jpg)


How Restaurant Recipe Costs Are Actually Calculated: The Weighted-Average Formula & How to Prove It to an Auditor

How Recipe Cost Is Actually Calculated: A Rolling Weighted Average, Not the Last Price You Paid
A recipe cost is calculated from a rolling weighted average of what you paid for each ingredient still in stock, not the last invoice price. The formula is simple: add the value of your existing stock to the value of the new purchase, then divide by the combined quantity. That blended unit cost, multiplied by the amount the recipe uses, is the ingredient cost.
Here is why that surprises people. Say you were holding 20 kg of chicken bought at $6.00 per kg, a stock value of $120.00, and you receive 30 kg more at $7.20 per kg, worth $216.00. The system does not switch to the new $7.20 price. It blends the two: $336.00 of value across 50 kg is a weighted-average cost of $6.72 per kg. A dish using 0.25 kg of chicken is therefore costed at $1.68, not the $1.80 the latest invoice alone would suggest.
That gap is the single most common reason a recipe cost looks too low. The operator remembers paying $7.20 and expects the dish to reflect it, but the blended average sits below the latest invoice because older, cheaper stock is still being drawn down. The number is not wrong. It is the true cost of the ingredients you are actually cooking with right now, which is exactly what a recipe costing system is built to show.
The cost blends every purchase still in stock, not the last price
| Purchase | Quantity | Unit cost | Value |
|---|---|---|---|
| Existing stock | 20 kg | $6.00 | $120.00 |
| New delivery | 30 kg | $7.20 | $216.00 |
| Combined stock | 50 kg | $6.72 / kg | $336.00 |
Why the Same Recipe Costs Differently From One Week and One Branch to the Next
Because the weighted average recalculates every time stock is received, a recipe cost is a moving figure, not a fixed one. Buy at a higher price and the blended cost drifts up over the following days as cheaper stock runs down. This is normal, and it is why a cost captured in a spreadsheet once a quarter goes stale almost immediately, a problem covered in spreadsheet recipe costing versus software.
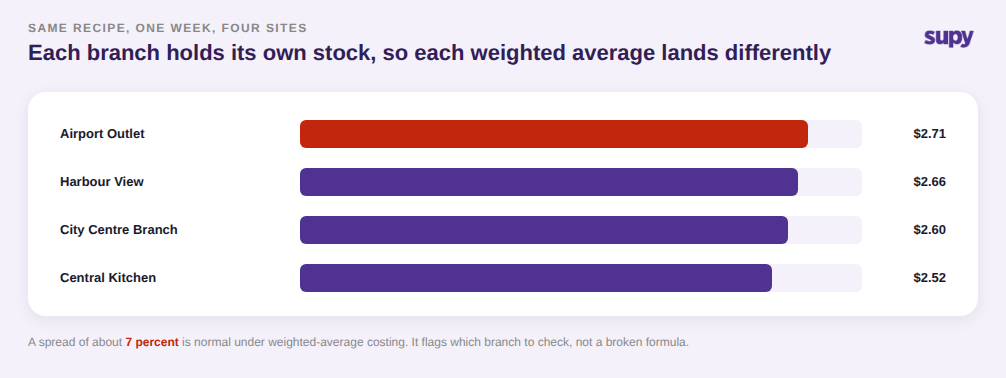
The same effect shows up across locations. Each branch holds its own stock, bought at its own prices, received on its own timeline, so each site's weighted average moves independently. The identical recipe can cost $2.52 at one location and $2.71 at another in the same week, a spread of roughly 7 percent, without anything being broken. Knowing this stops the pointless hunt for the "one true cost" and refocuses the question on which branch is drifting and why.
Where a Cost That Looks Wrong Usually Comes From: Item Setup and Receiving, Not the Formula
When a recipe cost really is wrong, the formula is rarely the culprit. The usual cause is how the ingredient was set up or received: a pack size, a unit conversion, or a per-case price entered as a per-unit price. Get that wrong once and every recipe using the item inherits the error, quietly, at scale.
The pattern is easy to spot once you look for it. Olive oil bought as a case of twelve 1-litre bottles for $48.00 should cost $4.00 per litre; entered as a single unit it reads $48.00 per litre, twelve times too high. A 25 kg sack of flour at $20.00 is $0.80 per kg, not $20.00. Cleaning up this master data is often the fastest single win on cost accuracy, which is why item master data hygiene matters more than most operators expect.
A per-case price entered as a per-unit price inflates every recipe that uses it
| Item | How it was received | Entered cost | Correct cost |
|---|---|---|---|
| Olive oil | Case, 12 x 1 L, $48.00 | $48.00 / L | $4.00 / L |
| Plain flour | Sack, 25 kg, $20.00 | $20.00 / kg | $0.80 / kg |
| Tomato paste | Case, 6 x 800 g, $18.00 | $18.00 / tin | $3.00 / tin |
How Prep and Sub-Recipe Costs Are Split When One Batch Makes Several Outputs
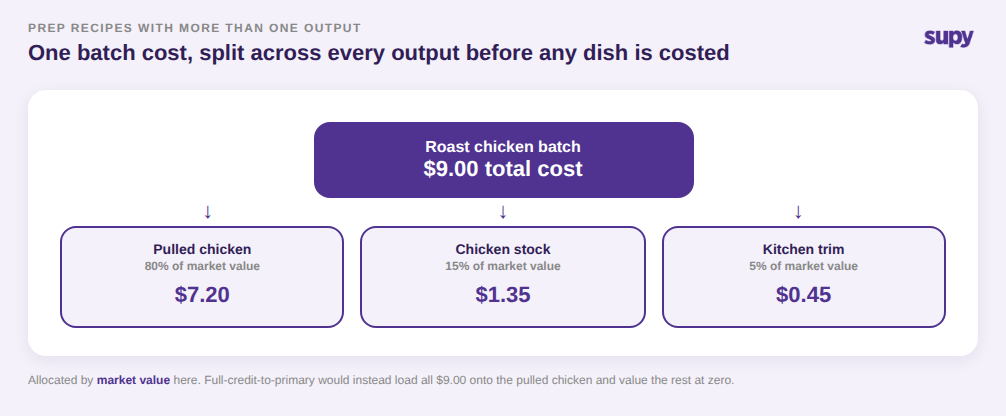
Prep recipes complicate the arithmetic because one batch often produces more than one usable output. Roast a batch of chicken costing $9.00 in ingredients and prep, and you get pulled chicken, stock, and trim. Each of those becomes an ingredient in other recipes, so the batch cost has to be distributed across them before any finished dish can be costed accurately.
Supy handles this with a strategy you choose per recipe: split the batch cost proportional to each output's market value, or give full credit to the primary output. Splitting the $9.00 batch by market value might allocate $7.20 to the pulled chicken, $1.35 to the stock, and $0.45 to the trim. Choosing full credit instead loads the entire $9.00 onto the pulled chicken and values the stock and trim at zero. Neither is more correct in the abstract; the point is that the choice is explicit and consistent, so downstream recipe costs are defensible. If you run high-yield prep, prep recipe yields and batch production tracking is worth reading alongside this.
How to Prove a Recipe Cost to an Auditor: The Timestamped Trail
An auditor does not want the cost figure. They want to see how you arrived at it, which means showing the price history and the calculation behind the number, not just the number on the day. This is where a static spreadsheet fails: it holds today's figure with no record of what it was last month or why it changed.
Supy keeps that record automatically. Every time an ingredient price changes, the affected recipe costs recalculate and a timestamped entry is kept of what drove the movement, tied to the named user and locked so it cannot be edited or deleted after the fact. To prove a cost to an auditor, work in three steps: first, show the price-change event, for example chicken moving from $6.00 to a $6.72 weighted average; second, show the recalculation it triggered, with the dish's chicken component moving from $1.50 to $1.68; third, export the trail for the period under review. That sequence turns "trust our number" into a documented, tamper-proof chain any auditor can follow. The full picture of automated costing sits in the recipe costing software overview.

Put the number to work. On the worked example above, a $2.60 plate cost against a $9.00 menu price is a 28.9 percent food cost, comfortably inside the healthy 28 to 32 percent band. Use that as your check: if a high-volume item's weighted-average cost has climbed while its menu price has not followed, or if the same recipe's cost spreads more than a few percent across your branches, that is your signal to recheck item setup, recount stock, or reprice, before the drift quietly eats a month of margin.