.jpg)


Breakdown Recipe Cost Allocation: Why Central Kitchens Cost Co-Products Wrong From a Single Input

Why One Average Cost Hides Your Best and Worst Co-Products
Breakdown recipe cost allocation is how a kitchen splits the purchase cost of one raw input across the several outputs it yields, so a premium cut, a secondary trim and a low-value by-product each carry a fair share of the cost instead of an identical average. Done well, it turns one weighed input into several correctly priced products you can actually make margin decisions on.
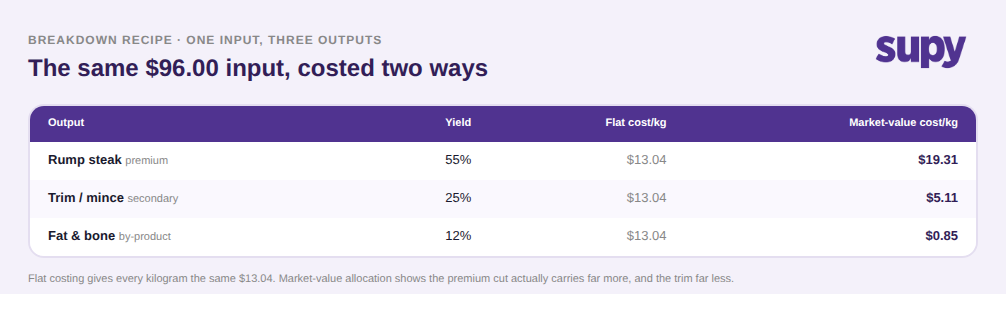
Most spreadsheet-built central kitchens never get there. When a $12.00 per kg input is broken down, the sheet takes the total cost and spreads it evenly across everything that came out. Buy a whole beef rump at 8.0 kg for $96.00, break it into a premium steak, a trim, and fat and bone, and every kilogram walks away carrying the same $13.04. The premium cut and the trimmings look identical on the margin report, which is the one thing you know for certain is false.
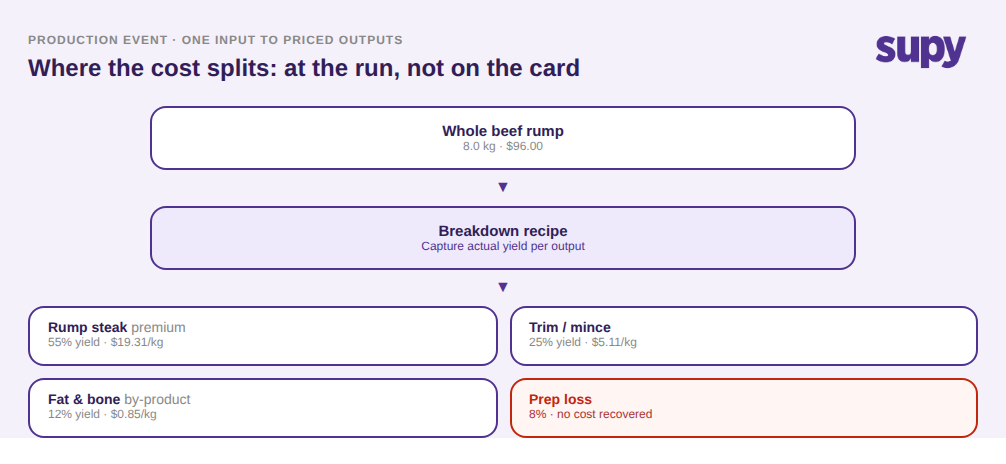
Allocate the same $96.00 by the market value of each output and the picture separates. The premium steak absorbs $19.31 per kg, the trim $5.11, the by-product $0.85. The flat average was under-costing your best output by $6.27 a kilo and over-costing the trim by $7.93, so the menu decisions built on top of it, which dish to push, which to reprice, which to drop, were all reading the numbers backwards.
Where Theoretical Yield and the Actual Production Run Diverge
Even a correctly allocated cost is only as honest as the yield behind it. A recipe card states a theoretical yield; the block on the bench on any given day does something else. Set the premium cut at a 55% yield and the food cost looks clean, until a run comes back at 48% because that day's input carried more fat and sinew.
That 7-point gap is not a rounding error. On an 8.0 kg input, 55% assumes 4.4 kg of premium output and 48% delivers 3.84 kg. The 0.56 kg difference is product your cost was calculated against but that never left the block. Every downstream number, the plate cost, the gross profit, the reorder quantity, inherits the error. This is exactly the case where recipe yield costing has to move from a static field on a card to a figure captured on the actual production run, because the only yield that costs anything is the one you really got. A central kitchen that also watches theoretical versus actual food cost at the site level can see the same divergence roll up into the variance report instead of hiding inside one recipe.

The High-Volume Prep Item Nobody Has Actually Costed
The output that hurts most is usually the one that moves most. A high-volume prep item, a base sauce, a portioned protein, a marinade, sells thousands of times a week, and its selling price is known to the cent. Its true build cost, ingredients plus prep loss, is often never calculated at all. Pricing and margin on the single item doing the most volume are effectively set blind.
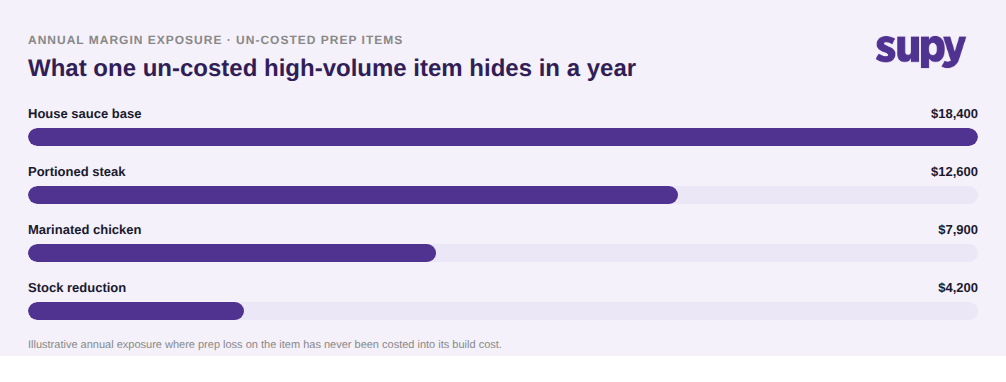
The exposure scales with the volume. A house sauce base that has never had its prep loss costed can quietly carry $18,400 of annual margin risk on its own; portioned steak $12,600; a marinated chicken prep $7,900; a stock reduction $4,200. None of these are exotic items. They are the everyday prep outputs a central kitchen produces in bulk, and the cost of getting their build cost wrong compounds with every batch. Getting prep recipe yields and batch production tracking right on those few items is where the recovered margin is largest.
How the Cost Splits Across Outputs at the Production Event
The fix is structural, not a harder afternoon with the calculator. One weighed input enters a breakdown recipe. Each output is defined with its own yield and prep wastage, so the trim is a stockable prep output in its own right, not the same raw material logged twice. At the production event, the run captures what was actually produced against what the recipe expected, and the input cost flows to each output by the chosen allocation method rather than being smeared evenly.
This is where the raw and the finished finally separate. When a central kitchen keeps raw inputs and finished co-products in one mixed stock view, production runs cannot be planned or counted cleanly and every stocktake inherits the confusion. Modelling each output as its own prep recipe, with its own yield, splits that view: raw on one side, finished co-products on the other, each counted and costed on its own terms. In Supy, prep and sub-recipes are set up with yields, shrinkage and prep wastage and tracked through batch production, and recipe and prep costing carries a target cost with an alert when a run drifts over it, so the gap between expected and actual surfaces at the bench instead of at month end.
Choosing an Allocation Method: Market-Value, Primary-Credit, or Weight-Based
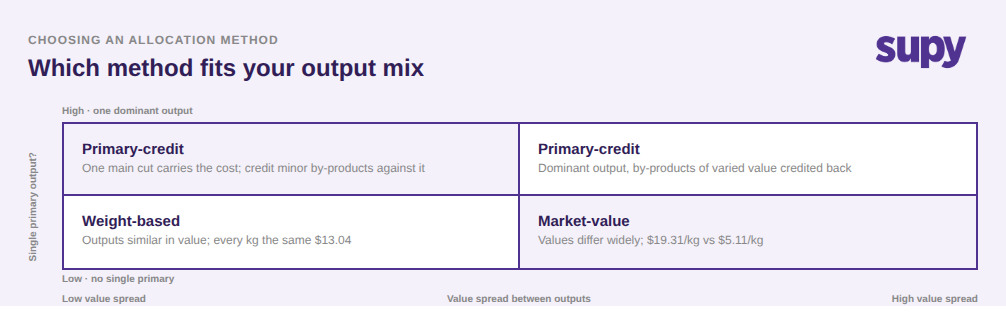
There is no single correct way to split one input's cost; there is a correct way for a given output mix. Three methods cover almost every case, and the right one depends on how the outputs relate to each other.
Weight-based allocation gives every kilogram the same cost. It is fair and simple when the outputs are genuinely similar in value, and wrong the moment they are not, which is the flat-average trap from the first section. Market-value allocation splits the cost in proportion to what each output is worth, so a premium co-product carries more of the cost than the trim; use it when the outputs differ widely in value and none clearly dominates. Primary-credit allocation treats one output as the main product and credits the value of the minor by-products against its cost; use it when a single output is the point of the whole break and the rest are genuinely secondary. Pick the method once per breakdown, apply it consistently, and the per-output cost stops being a matter of opinion.
Whichever method you choose, hold the currency and the costing rules steady across every site so the same prep item is never costed two different ways in two branches.
Check Whether This Is Happening in Your Kitchen
Pull your highest-volume prep item and look at its outputs. If every output from one input carries the same cost per kilogram, you are on flat costing and your premium outputs are mis-priced by roughly the spread you just saw between $13.04 and $19.31. The first move is not a new spreadsheet formula. It is to record one real production run's actual yields against the recipe's theoretical ones; the gap, the same kind of gap as 55% dropping to 48%, is your first honest number. Then decide, for that item, whether its outputs want weight-based, market-value, or primary-credit allocation, and apply it. That single item is usually where the largest recovered margin is hiding.
Supy gives central kitchen teams the recipe and prep costing, batch production tracking, and theoretical versus actual visibility to run co-product costing this way across every site. See where your co-product costs are drifting.