.jpg)


Track Recipe Cost Changes Over Time: Catch Margin Erosion Before It Hits Your P&L
Why Your Recipe Cost Is a Moving Number, Not a Fixed One
Tracking recipe cost over time means watching how a dish's total ingredient cost moves month to month, and knowing which ingredient drove each change. A recipe cost is not fixed. It shifts every time a supplier price changes, a portion is adjusted, or an ingredient is substituted, so the figure you costed a dish at last quarter is rarely the figure it costs today.
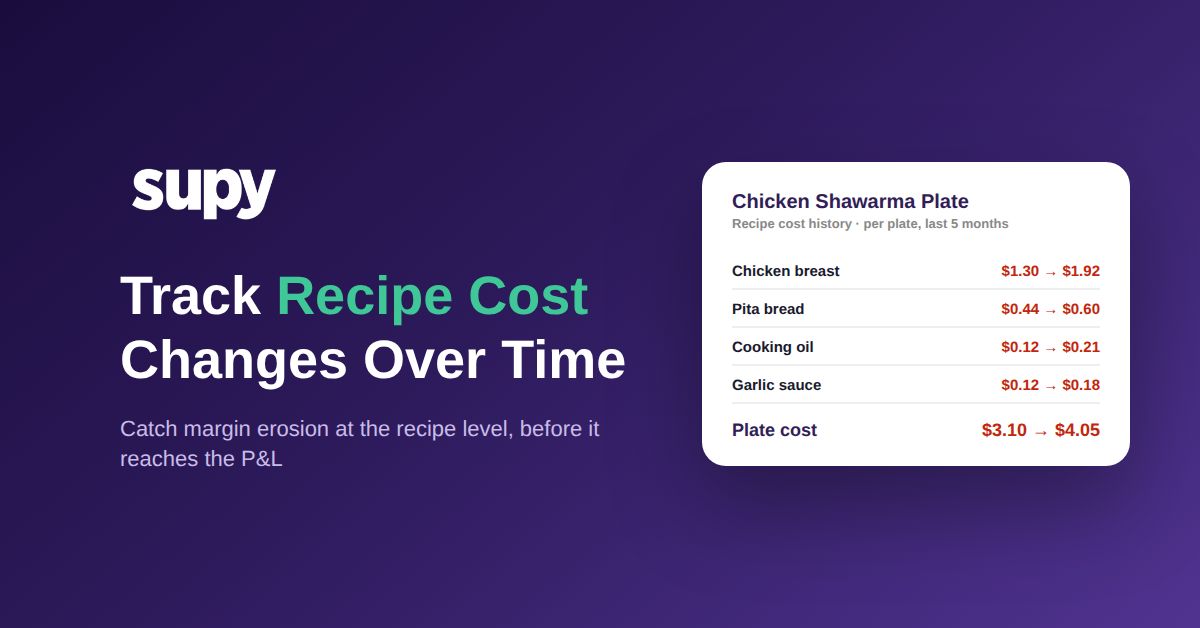
Here is what that drift looks like on a single high-volume item. A chicken shawarma plate that costed at $3.10 five months ago now costs $4.05 to build. Same recipe, same portion, no change to how it is made. That is a 31% rise driven entirely by ingredient prices moving underneath the recipe, and it pushed the plate's food cost from 25.8% to 33.8% of its $12.00 menu price, straight past the 28% target.

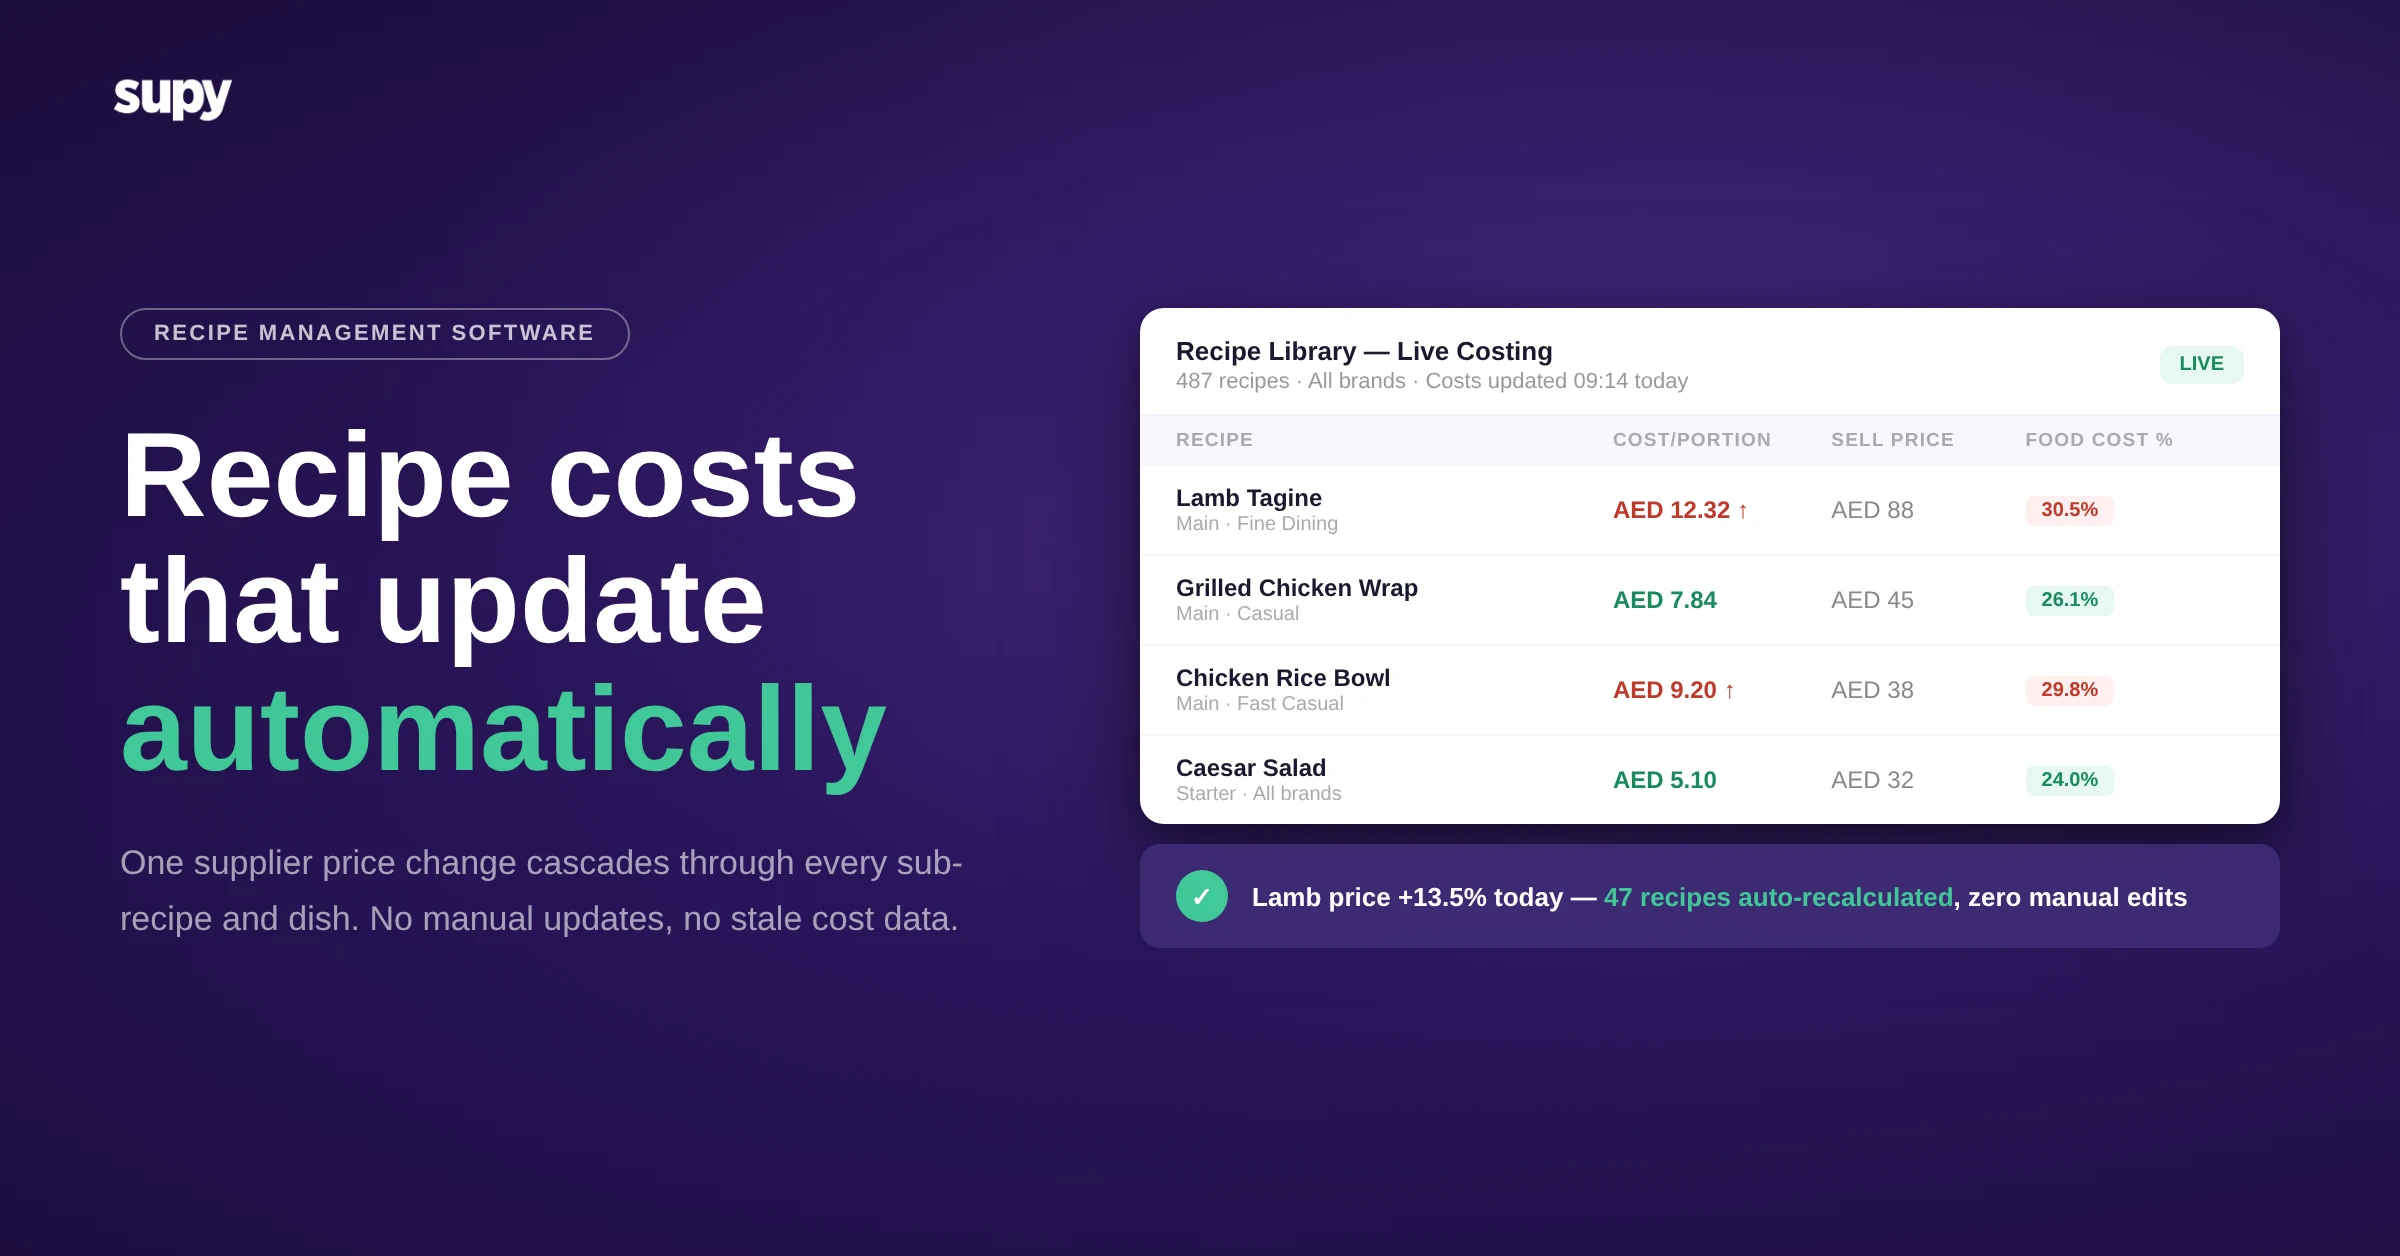
The reason this kind of erosion goes unnoticed is that it arrives in fractions of a cent per plate. That $0.95 increase feels like nothing on one ticket. Multiply it across 1,800 covers a month for this one dish and it is $1,710 a month, roughly $20,520 a year of margin quietly gone, on a single menu item. Nobody approved that. It simply accumulated invoice by invoice until it showed up as a worse food cost percentage on the month-end profit and loss statement, long after the moment anyone could have acted on it. Live recipe costing that updates the moment an invoice is captured is what turns that month-end surprise into something you can see while it is still happening.
How a Single Cheap Delivery Masks Your Real Food Cost
Recipe costing runs on a rolling weighted-average of every ingredient purchase, not on the price of the latest invoice. That is the correct way to cost a dish, but it has a side effect worth understanding: a single cheap delivery can make a recipe look cheaper than it really is until the average catches up, and a single expensive one can spike it.
Take the chicken in that shawarma plate. Last week's delivery landed at $8.90 per kilo, so a manager glancing at the invoice would conclude prices had eased. The weighted-average cost the recipe actually uses is $9.60 per kilo, because it still carries months of higher-priced buys. Cost the dish off the last invoice and you understate it; cost it off the running average and you see the truth.

This is exactly why a single snapshot lies and a trend tells the truth. Whether a recipe should follow the live weighted-average at all, or hold a fixed cost, depends on the ingredient, and we cover that decision in detail in our guide to live purchase price versus fixed cost. Either way, the number to watch is the direction of travel over several months, not the figure on any one delivery note.
Catching the Ingredient That Quietly Erodes Your Margin
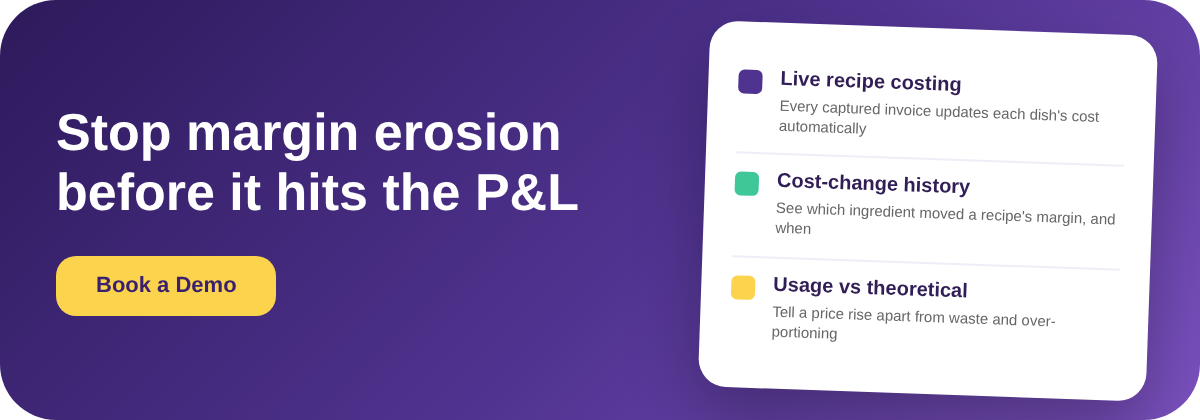
Knowing a dish got more expensive is only half the answer. The useful question is which ingredient moved it, and by how much, because that is what tells you where to act. A per-recipe cost-change history breaks the movement down to the line item, so instead of a vague sense that food cost is up, you get a ranked list of exactly what changed.

On this plate the story is clear the moment you see it broken out. Chicken breast alone moved from $1.30 to $1.92 per plate, which is $0.62 of the total $0.95 rise, roughly 65% of the whole problem. Pita, oil and garlic sauce make up the rest in much smaller amounts. That ranking changes what you do next: a supplier conversation or a spec change on chicken pays back the erosion far faster than tightening four minor ingredients would. Supy keeps this history per recipe, showing how the total cost has moved and attributing each shift to the ingredient behind it, so the highest-value fix is always the obvious one.
Price Rise or Waste? Read the Variance Before You React
A recipe that costs more and a kitchen that wastes more look identical on the profit and loss statement: both show up as cost you did not plan for. They need opposite fixes, though, and acting on the wrong one wastes effort. Reading the recipe cost-change history against a usage variance report separates them cleanly.
The cost-change history tells you the per-kilo price of an ingredient rose. A usage variance report, comparing what the recipes theoretically should have consumed against what stock records say was actually used, tells you whether the kitchen also went through more of it than the recipe called for.

Here the chicken carries both problems at once. Its price per kilo rose, which the cost-change history caught, and the kitchen also used 7.2 kilos more than the recipes called for, worth about $69 in this period, which the variance caught. One is a purchasing or specification fix; the other is a portioning, prep-loss or waste-logging fix. Our deeper walkthrough of theoretical versus actual food cost variance covers how to run that split each period. One more thing keeps the history trustworthy while you work: when you correct a recipe or update a portion, Supy reprocesses the historical inventory transactions so earlier periods still reconcile, and your cost trend does not break every time you fix something.
Turn This Into a Fifteen-Minute Monthly Check
You do not need a project to get ahead of margin erosion, just a short routine. Run this self-diagnostic once a month and it will surface the drift while it is still small:

First, pull your ten highest-volume dishes, because a few cents of drift there dwarfs a large swing on an item you sell twice a week. Second, compare each dish's current recipe cost against its cost a quarter ago. Third, for any dish that moved more than a point or two of food cost percentage, open its cost-change history and find the ingredient behind the move. Fourth, decide per ingredient whether it is a price fix, meaning a supplier or specification conversation, or a usage fix, meaning portioning, prep loss or unlogged waste. Start with the single biggest mover on your single highest-volume dish, and you will recover more margin in fifteen minutes than a broad, unfocused cost-cutting drive usually finds in a week.
Recipe cost is a moving number, and the operators who protect their margins are the ones who watch it move rather than discovering where it landed at month-end. Track the trend, attribute the change, separate price from waste, and the P&L stops delivering surprises.