.jpeg)


Rezept-Wareneinsatz im Zeitverlauf verfolgen: Margenerosion erkennen, bevor sie die G&V trifft
Warum Ihr Rezept-Wareneinsatz eine variable Zahl ist, keine feste
Den Rezept-Wareneinsatz im Zeitverlauf zu verfolgen bedeutet, zu beobachten, wie sich die Gesamtzutatenkosten eines Gerichts von Monat zu Monat verschieben, und zu erkennen, welche Zutat jede Änderung antreibt. Ein Rezept-Wareneinsatz ist nicht festgelegt. Er verschiebt sich jedes Mal, wenn ein Lieferantenpreis sich ändert, eine Portion angepasst oder eine Zutat substituiert wird — daher ist die Zahl, zu der Sie ein Gericht im letzten Quartal kalkuliert haben, selten die Zahl, die es heute kostet.
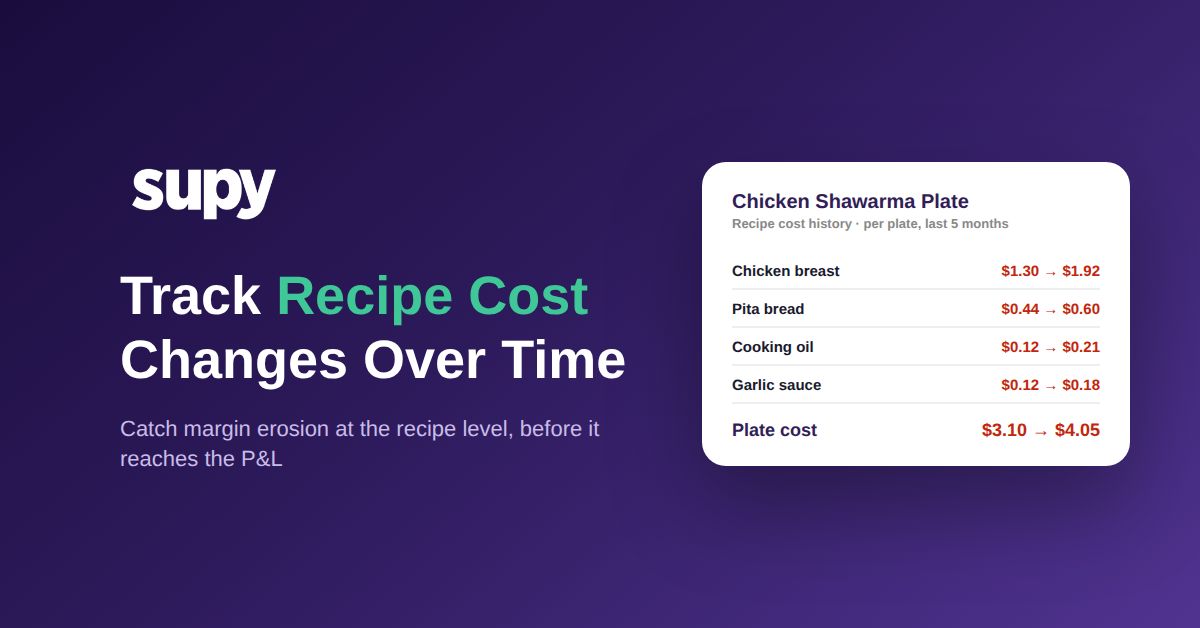
So sieht diese Entwicklung bei einem einzigen hochvolumigen Gericht aus. Ein Hühnchen-Schawarma-Teller, der vor fünf Monaten mit $3,10 kalkuliert wurde, kostet heute $4,05 in der Herstellung. Gleiches Rezept, gleiche Portion, keine Änderung in der Zubereitung. Das ist ein Anstieg von 31 %, der ausschließlich durch Zutatenpreise entstand, die sich unter dem Rezept verschoben haben, und er erhöhte den Wareneinsatz des Tellers von 25,8 % auf 33,8 % seines Menüpreises von $12,00 — weit über das 28-%-Ziel hinaus.

Der Grund, warum diese Art von Erosion unbemerkt bleibt, ist, dass sie in Bruchteilen eines Cents pro Teller eintrifft. Ein Anstieg von $0,95 erscheint bei einem Bon wie nichts. Multipliziert man ihn auf 1.800 Gäste pro Monat für dieses eine Gericht, ergibt das $1.710 im Monat — rund $20.520 im Jahr an Marge, die still und leise verloren geht, bei einem einzigen Menüpunkt. Niemand hat das genehmigt. Es hat sich einfach Rechnung für Rechnung angesammelt, bis es am Monatsende als schlechtere Wareneinsatzquote in der Gewinn- und Verlustrechnung auftauchte, lange nachdem jemand hätte eingreifen können. Eine Live-Rezeptkalkulation, die sich aktualisiert, sobald eine Rechnung erfasst wird, verwandelt diese Monatsend-Überraschung in etwas, das Sie sehen können, während es noch passiert.
Wie eine einzige günstige Lieferung Ihren tatsächlichen Wareneinsatz verschleiert
Die Rezeptkalkulation basiert auf einem rollierenden gewichteten Durchschnitt aller Zutateinkäufe, nicht auf dem Preis der letzten Rechnung. Das ist die richtige Methode, um ein Gericht zu kalkulieren, hat aber einen Nebeneffekt, den es zu verstehen gilt: Eine einzige günstige Lieferung kann ein Rezept günstiger erscheinen lassen, als es tatsächlich ist, bis der Durchschnitt sich angepasst hat — und eine einzige teure Lieferung kann ihn in die Höhe treiben.
Nehmen wir das Hühnchen in diesem Schawarma-Teller. Die letzte Lieferung kam zu $8,90 pro Kilo an, daher würde ein Manager, der kurz auf die Rechnung schaut, schlussfolgern, die Preise hätten sich entspannt. Der gewichtete Durchschnittspreis, den das Rezept tatsächlich verwendet, liegt bei $9,60 pro Kilo, weil er noch Monate teurer eingekaufter Ware trägt. Das Gericht auf Basis der letzten Rechnung zu kalkulieren führt zu einer Unterschätzung; es auf Basis des rollierenden Durchschnitts zu kalkulieren zeigt die Wahrheit.

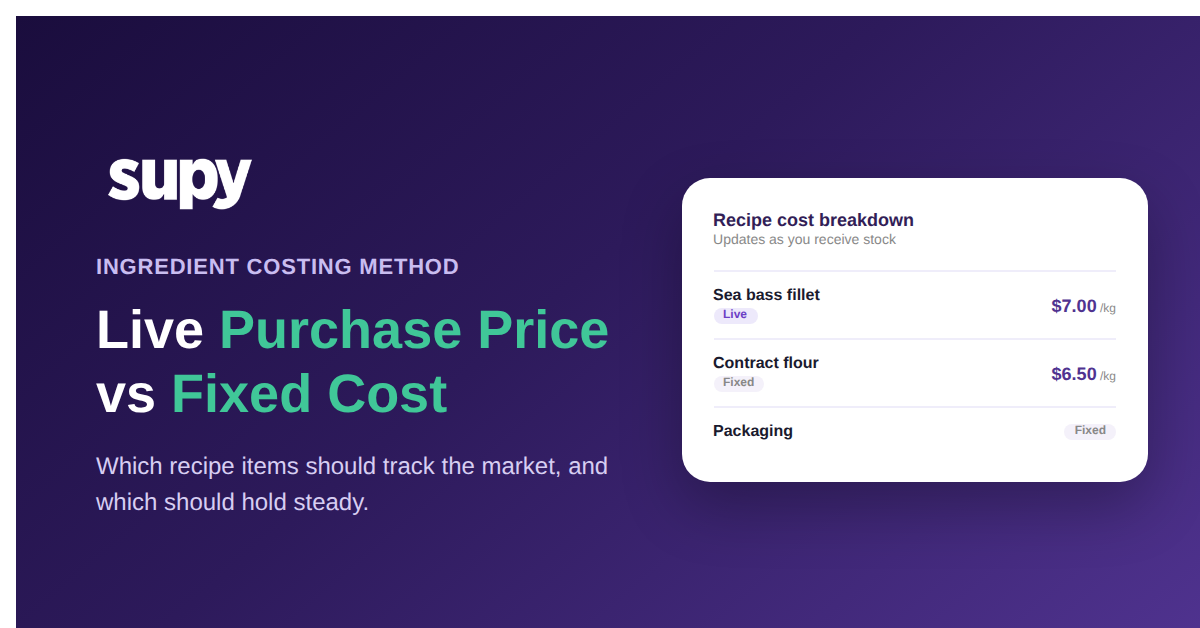
Genau deshalb lügt ein einzelner Schnappschuss und eine Trendlinie erzählt die Wahrheit. Ob ein Rezept überhaupt dem Live-gewichteten-Durchschnitt folgen oder eine feste Kalkulation behalten soll, hängt von der Zutat ab — diese Entscheidung behandeln wir ausführlich in unserem Leitfaden zu Live-Einkaufspreis versus feste Kosten. In jedem Fall ist die zu beobachtende Zahl die Entwicklungsrichtung über mehrere Monate, nicht die Zahl auf einem einzigen Lieferschein.
Die Zutat finden, die Ihre Marge still und leise aushöhlt
Zu wissen, dass ein Gericht teurer geworden ist, ist nur die halbe Antwort. Die nützliche Frage ist, welche Zutat es bewegt hat und um wie viel — denn das zeigt, wo man handeln muss. Eine Kostenänderungshistorie pro Rezept schlüsselt die Bewegung bis zum Einzelposten auf, sodass man statt eines vagen Gefühls, dass der Wareneinsatz gestiegen ist, eine Rangliste der genauen Veränderungen erhält.

Bei diesem Teller ist die Geschichte sofort klar, wenn man sie aufgeschlüsselt sieht. Hähnchenbrust allein stieg von $1,30 auf $1,92 pro Teller — das sind $0,62 des Gesamtanstiegs von $0,95, also rund 65 % des gesamten Problems. Pita, Öl und Knoblauchsauce machen den Rest in deutlich kleineren Beträgen aus. Diese Rangliste ändert, was als Nächstes zu tun ist: Ein Lieferantengespräch oder eine Spezifikationsänderung bei Hähnchen bringt die Erosion weit schneller zurück als das Anziehen von vier Nebenzutaten. Supy führt diese Historie pro Rezept und zeigt, wie sich die Gesamtkosten entwickelt haben und ordnet jede Verschiebung der dahinterstehenden Zutat zu — so ist die Maßnahme mit dem höchsten Wert stets die offensichtlichste.
Preisanstieg oder Verschwendung? Lesen Sie die Abweichung, bevor Sie handeln
Ein Rezept, das mehr kostet, und eine Küche, die mehr verschwendet, sehen in der Gewinn- und Verlustrechnung identisch aus: Beide erscheinen als ungeplante Kosten. Sie erfordern jedoch gegenteilige Maßnahmen, und auf die falsche zu reagieren verschwendet Mühe. Die Kostenänderungshistorie des Rezepts gegen einen Abweichungsbericht zu lesen, trennt sie sauber voneinander.
Die Kostenänderungshistorie zeigt Ihnen, dass der Preis pro Kilogramm einer Zutat gestiegen ist. Ein Abweichungsbericht — der vergleicht, was die Rezepte theoretisch hätten verbrauchen sollen, mit dem, was die Lagerbestandsaufzeichnungen als tatsächlich verwendet ausweisen — sagt Ihnen, ob die Küche auch mehr davon verbraucht hat, als das Rezept verlangte.

Hier trägt das Hühnchen beide Probleme gleichzeitig. Sein Preis pro Kilo stieg, was die Kostenänderungshistorie erfasste, und die Küche verwendete 7,2 Kilo mehr als die Rezepte verlangt hätten — etwa $69 in diesem Zeitraum —, was die Abweichungsanalyse erfasste. Das eine ist ein Einkaufs- oder Spezifikationsproblem; das andere ist ein Portionierungs-, Vorbereitungsverlust- oder Schwund-Problem. Unsere ausführlichere Anleitung zur theoretischen versus tatsächlichen Wareneinsatzabweichung erklärt, wie man diese Aufteilung jede Periode durchführt. Noch etwas sorgt dafür, dass die Historie während der Arbeit verlässlich bleibt: Wenn Sie ein Rezept korrigieren oder eine Portion aktualisieren, verarbeitet Supy die historischen Lagertransaktionen neu, sodass frühere Perioden weiterhin abgestimmt sind und Ihr Kostentrend bei jeder Korrektur nicht abbricht.
Machen Sie daraus eine monatliche Fünfzehn-Minuten-Prüfung
Sie brauchen kein großes Projekt, um Margenerosion zuvorzukommen — nur eine kurze Routine. Führen Sie diese Selbstanalyse einmal im Monat durch, und sie deckt die Entwicklung auf, solange sie noch klein ist.

Erstens: Rufen Sie Ihre zehn umsatzstärksten Gerichte ab, denn ein paar Cent Entwicklung dort überwiegen bei weitem eine größere Schwankung bei einem Artikel, den Sie zweimal pro Woche verkaufen. Zweitens: Vergleichen Sie den aktuellen Rezept-Wareneinsatz jedes Gerichts mit dem von vor einem Quartal. Drittens: Öffnen Sie für jedes Gericht, das sich um mehr als ein oder zwei Prozentpunkte des Wareneinsatzes verschoben hat, die Kostenänderungshistorie und finden Sie die Zutat hinter der Verschiebung. Viertens: Entscheiden Sie pro Zutat, ob es ein Preisproblem ist — ein Lieferanten- oder Spezifikationsgespräch — oder ein Verbrauchsproblem, also Portionierung, Vorbereitungsverluste oder nicht erfasster Schwund. Beginnen Sie mit dem einzelnen größten Verursacher bei Ihrem einzigen umsatzstärksten Gericht, und Sie werden in fünfzehn Minuten mehr Marge zurückgewinnen als eine breite, ungezielte Kostensenkungsaktion in einer Woche normalerweise findet.
Der Rezept-Wareneinsatz ist eine variable Zahl, und die Unternehmer, die ihre Margen schützen, sind diejenigen, die beobachten, wie er sich verschiebt, anstatt am Monatsende zu entdecken, wo er gelandet ist. Den Trend verfolgen, die Veränderung zuordnen, Preis von Schwund trennen — und die Gewinn- und Verlustrechnung hört auf, Überraschungen zu liefern.