.jpg)


How to Set Up Restaurant Wastage Tracking Across Multiple Sites
This is a step-by-step guide to setting up wastage tracking across a restaurant group, so the number you get at the end is one you can actually act on. It is less about buying software and more about getting four steps right, in order: capture every entry in one place, split waste into the types that have different fixes, set the units so the numbers are trustworthy, then roll every site up onto one scale. Work through them in that order and the group view you want mostly builds itself. Here is how to do it.
Step 1: Move waste capture off paper into one shared system
Start by making every waste entry land in the same place. Wastage tracking is simply the way a restaurant group records what gets thrown away, entry by entry, so the totals are consistent enough to compare across sites, and none of that works while each site keeps its own record.
Set it up so staff log waste by item, quantity, reason and type in seconds from a phone or a desktop, and every entry lands in the same structure. Connect the till while you are at it: when a sale is voided or cancelled, the waste record can be created for you, so the obvious losses are not left to memory at the end of a busy shift.
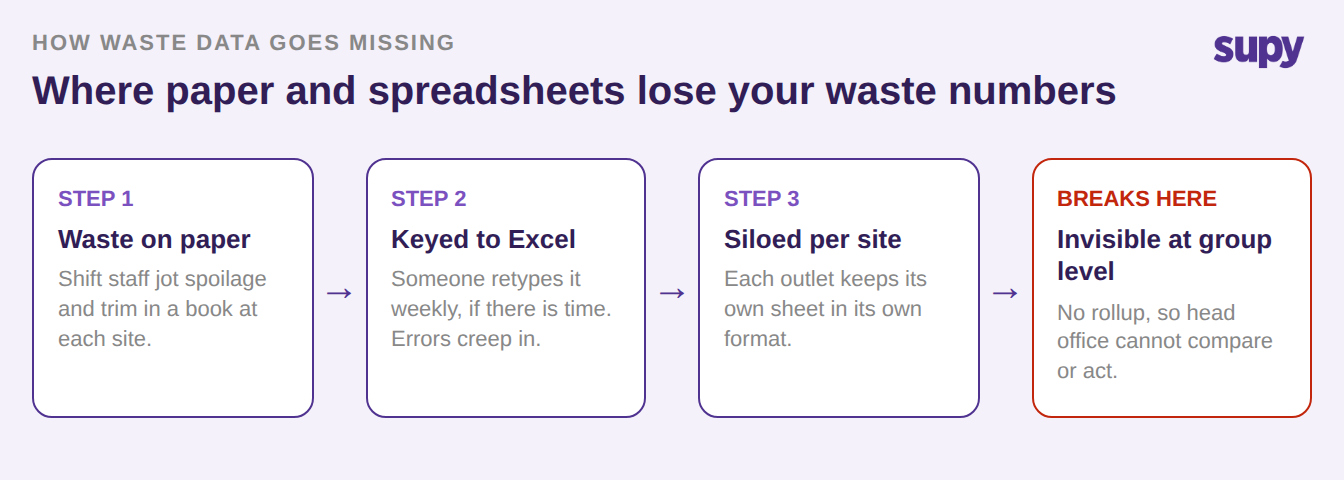
The pattern to design out is the one most groups start from: a shift lead writes spoilage and failed batches in a book, someone retypes it into a spreadsheet at the end of the week if there is time, and each outlet keeps its own sheet in its own format. Fix that plumbing first and there is finally something to add up at group level.
Step 2: Split production waste from ingredient waste
Next, record production waste and ingredient waste apart from day one rather than lumping them into one figure. Production waste is a batch that failed: dough that did not rise, a sauce that split, a prep run that had to be binned. Ingredient waste is spoilage, expiry and trim: the items that went off before use, or the peel and offcuts left after prep. The first points back at a recipe or a process; the second points at ordering, rotation and portioning.
So tag every entry with a type and a reason. Recorded apart, each number tells you where to look; recorded together, a rising total tells you only that something is wrong. Because waste is recorded against the recipe, the cost follows automatically, so you end up looking at money, not just kilograms.
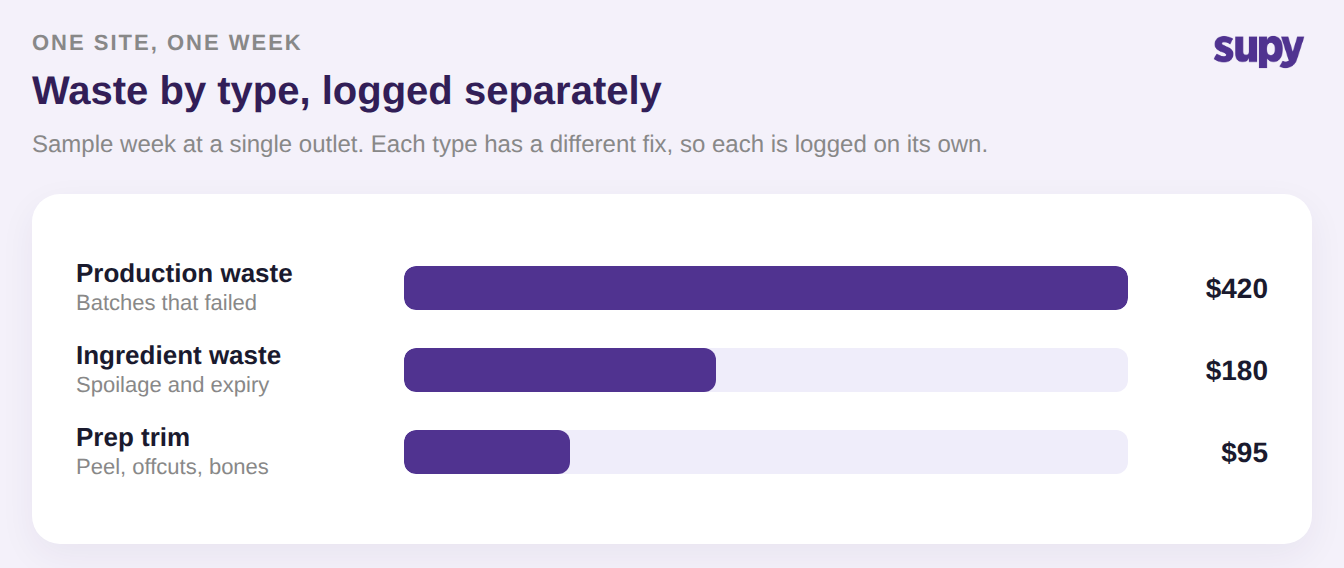
In a sample week at a single outlet, that might read as $420 of production waste, $180 of ingredient waste and $95 of prep trim. Three numbers, three owners, three different fixes. Prep trim that is set once in a recipe and never revisited is its own slow leak, which is why stale prep-wastage percentages quietly inflate variance over time.
Step 3: Get your units of measure right so the numbers hold up
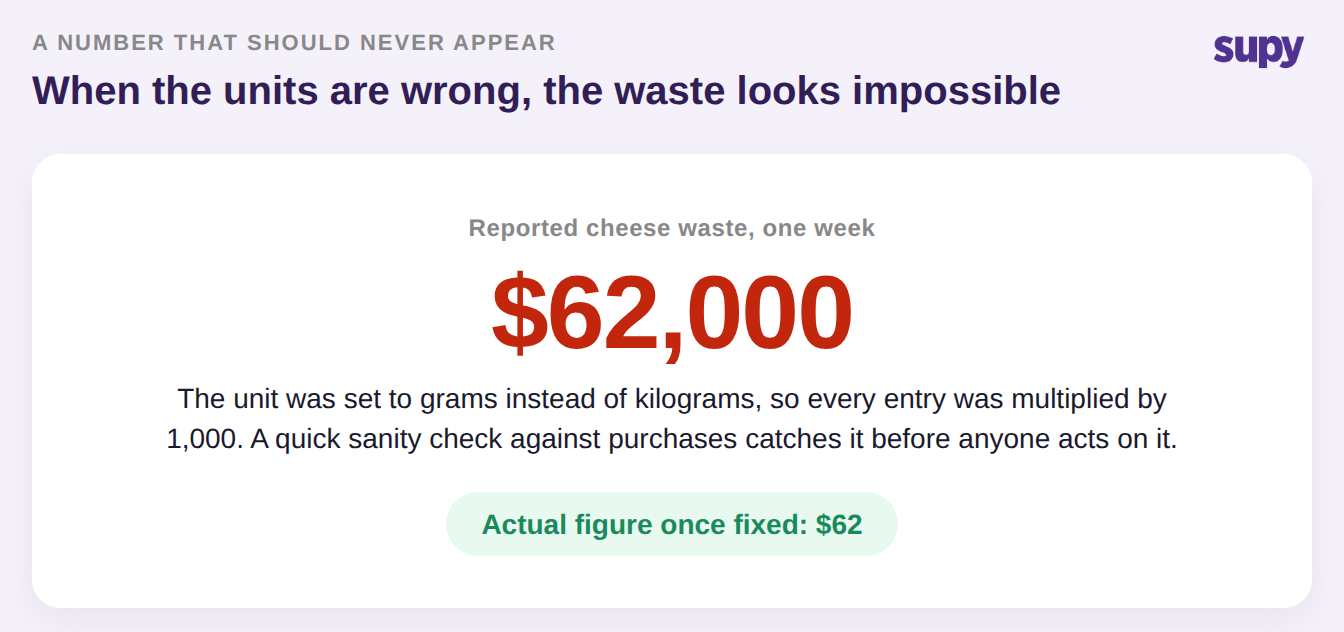
Before anyone trusts a waste report, lock down the units of measure. This is the step that decides whether the whole report is believable, because a single wrong unit is the fastest way to produce a figure that cannot be real: set one item to grams instead of kilograms and every entry for it is multiplied by a thousand, so a week of cheese waste that should read $62 comes back as $62,000.
Build three quick checks into the setup so a bad number never reaches a decision. First, sanity-check the waste total against what the site actually bought that week: waste cannot be a large multiple of purchases. Second, confirm the unit on your highest-value items, where a wrong unit costs the most. Third, watch for any single entry that dwarfs its whole category. A number that looks impossible usually is, and the fix is a setup correction, not a policy memo.
Step 4: Roll every site up into one comparable number
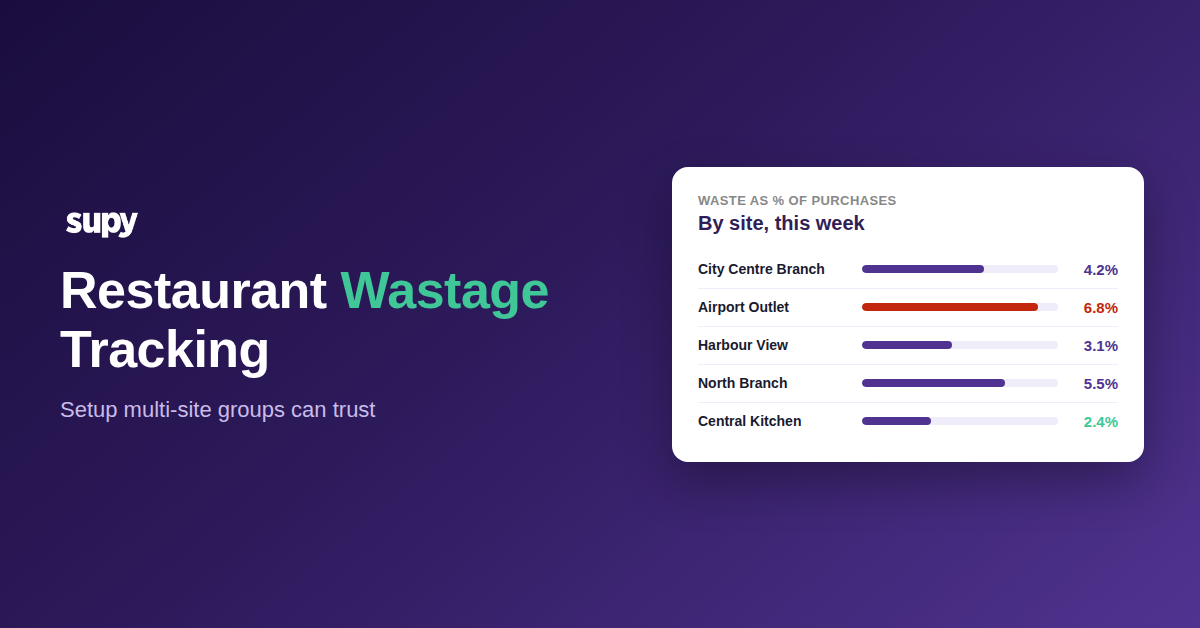
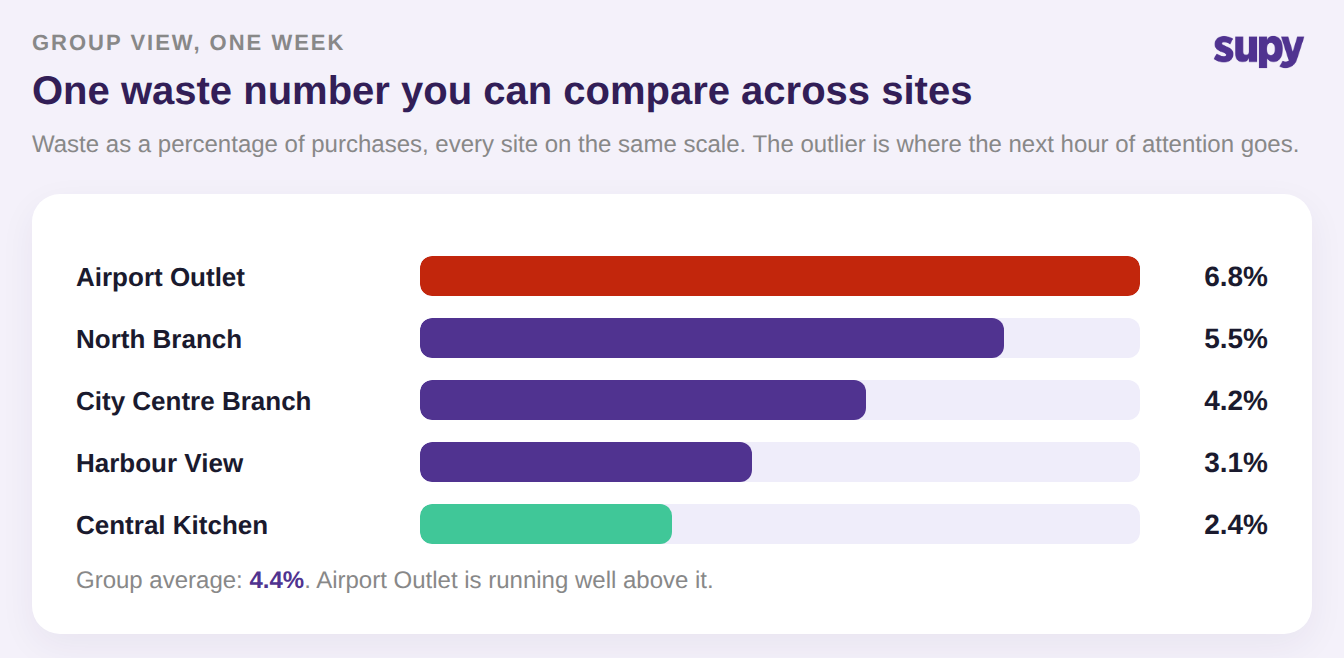
Finally, roll the sites up into one number you can compare. This is the whole reason to set the rest up, and by this step the earlier work pays off: when each waste entry is scoped to one outlet on one date, the same records roll up into a group picture without anyone re-keying a thing. Express waste as a percentage of purchases, so a small site and a large one sit on the same scale and the comparison is fair.
Then the outlier does the work of telling you where to spend the next hour. Say the group averages 4.4 percent, and the sites run from Central Kitchen at 2.4 percent up to an Airport Outlet at 6.8 percent. You do not need a meeting to know which site to call. Pairing that view with the depletion your recipes and stock counts already produce is what turns waste from a monthly surprise into a weekly signal, and it sits alongside the rest of your restaurant inventory management.
You do not need a group-wide policy to start. Pick the ten highest-value ingredients, confirm the unit of measure on each, and agree the two or three waste reasons everyone will use so the data stays consistent. Then log for one week and open the group view. The site that stands out is where next week's attention goes, and once the setup is right, that signal arrives on its own every week after.