.jpg)


Restaurant Stock Variance: Why Counts Go Negative Across Sites
When Your Stock Count Does Not Match Reality
Stock variance is the gap between the stock a restaurant's system expects to be on hand and the stock a physical count actually finds. Across a group of sites it shows up as a variance report full of red lines, a staple that reads as a negative balance, or a number that simply keeps growing. The reassuring part for a multi-site operator is that most of that gap is not theft or spoilage at all: it is a handful of fixable data and setup problems, and the same variance report that surfaces the gap is also where you find the cause.
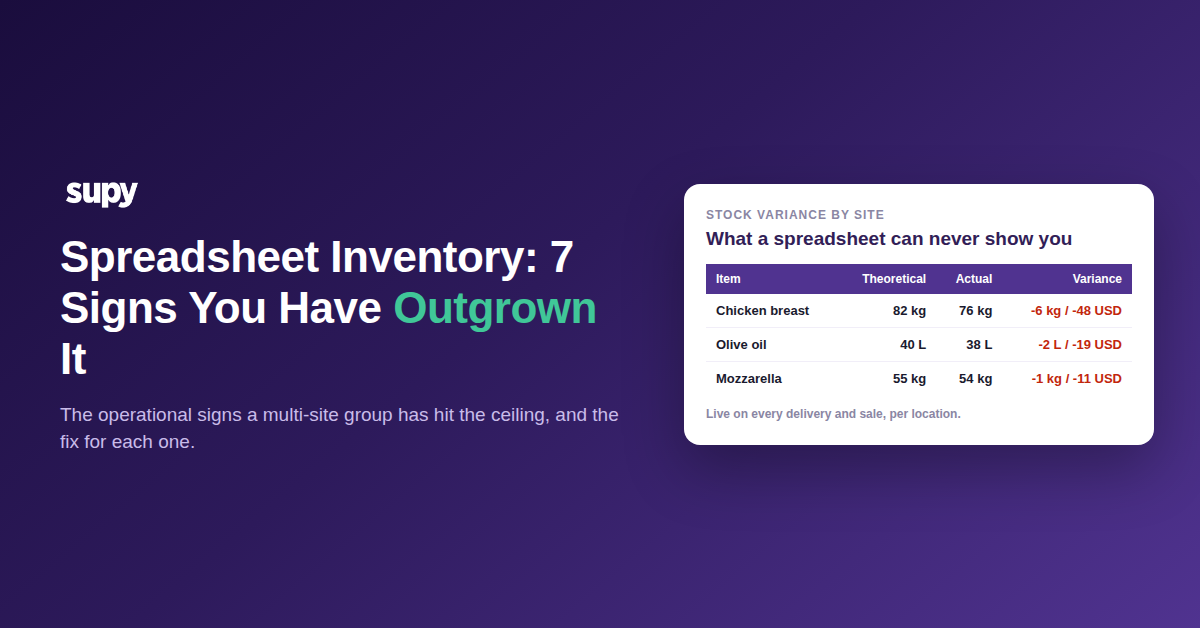
Before you send anyone to recount a walk-in, it helps to see what a clean weekly variance snapshot looks like for a single outlet, so the outliers stand out from the noise. A small negative on a high-turnover protein is ordinary; a six-kilo swing on mozzarella or an impossible balance is where the investigation actually starts.
| Item | Theoretical | Actual | Variance |
|---|---|---|---|
| Chicken breast | 42 kg | 38 kg | -4 kg / -$32 |
| Mozzarella | 18 kg | 12 kg | -6 kg / -$54 |
| Olive oil | 24 L | 22 L | -2 L / -$18 |
| Vine tomatoes | 30 kg | 31 kg | +1 kg / +$4 |
| House tomato sauce (prep) | 20 L | 20 L | 0 / $0 |
Read across a whole group, the job is to separate the lines that reflect real physical loss from the ones that are an artefact of how the count or the sales data was handled. The four sections below are the checks that catch the artefacts first, in the order they most often bite.
Why Counts Show Negative Balances
A negative on-hand balance is the clearest signal that the cause is in the data, not on the shelf, because no store can physically hold less than nothing. When a staple like basmati rice reads as -18 kg across several branches, two setup problems account for almost every case, and both are quick to confirm.
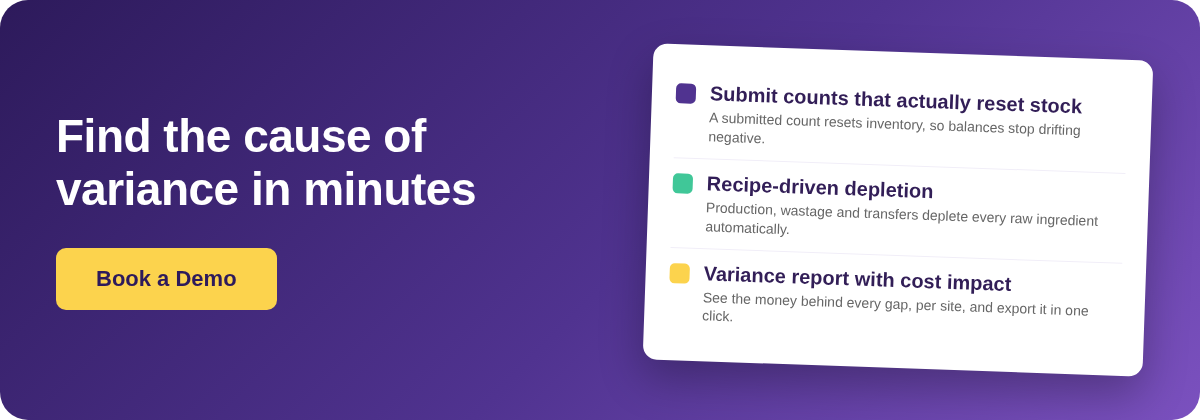
The first is a stock count that was saved but never submitted. In Supy a count only resets inventory once it is submitted; a count left in draft is stored but does not take effect, so the system keeps depleting from an old, higher figure and the balance drifts below zero. The second is a break in the sales feed: if point-of-sale data has not been uploaded for a period, item depletion cannot run, and the stock that was actually sold never leaves the books until the gap is filled. Retraining branch teams to submit every count, and backfilling any missing sales days, resolves the negative balances at the source.
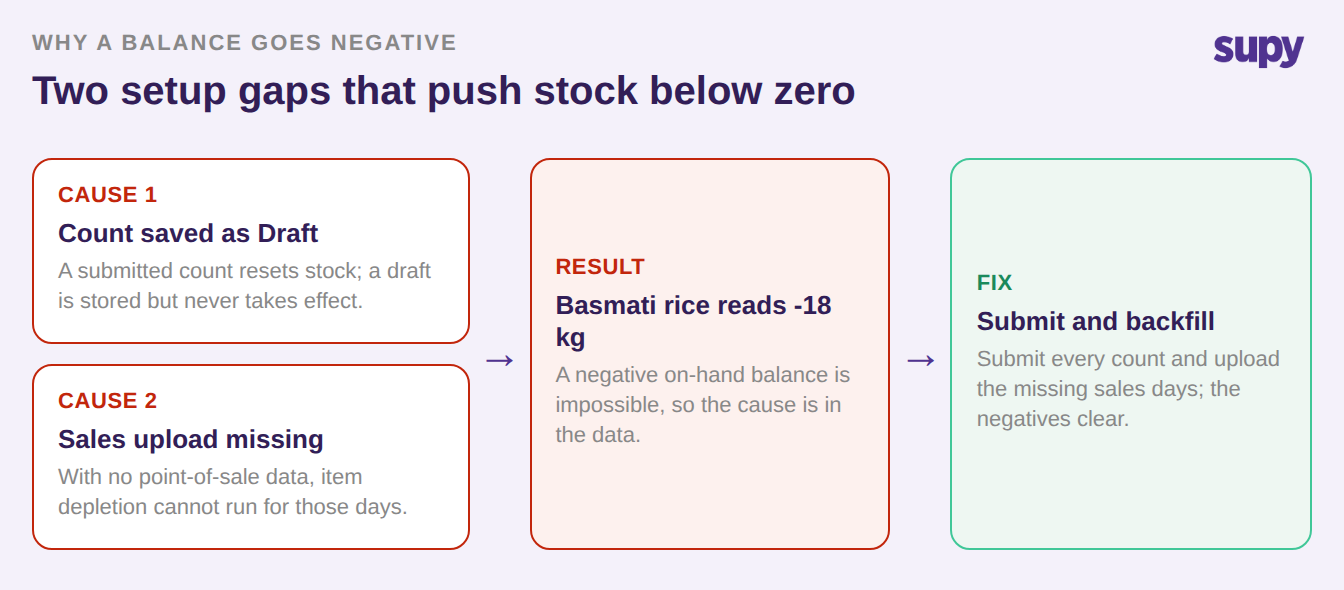
The practical check is fast: filter the variance report to the items showing impossible balances, confirm the most recent count for those sites was submitted rather than left in draft, and confirm sales uploaded for every trading day in the period. Fix those two and the negatives usually disappear on the next count.
When Variance Keeps Growing Week After Week
A variance that climbs steadily, week after week, points to depletion that is not firing rather than to a one-off loss. The most common cause in a multi-site kitchen is a recipe that should be depleting its ingredients but is not, because auto production has not been switched on for stockable semi-finished items such as a house sauce, stock base, or batch prep.
When production of those prep items does not trigger depletion, the raw ingredients they consume are never deducted, so the theoretical stock stays high while the shelf empties, and the gap widens with every service. Supy traces depletion through the recipe to each raw ingredient once production, wastage, transfers, or counts are recorded against it, so enabling auto production on the stockable prep recipes closes the leak going forward. One caveat matters for the investigation: production events cannot be backdated, so historical variance needs a manual correction and the improvement shows from the fix forward, not retroactively.
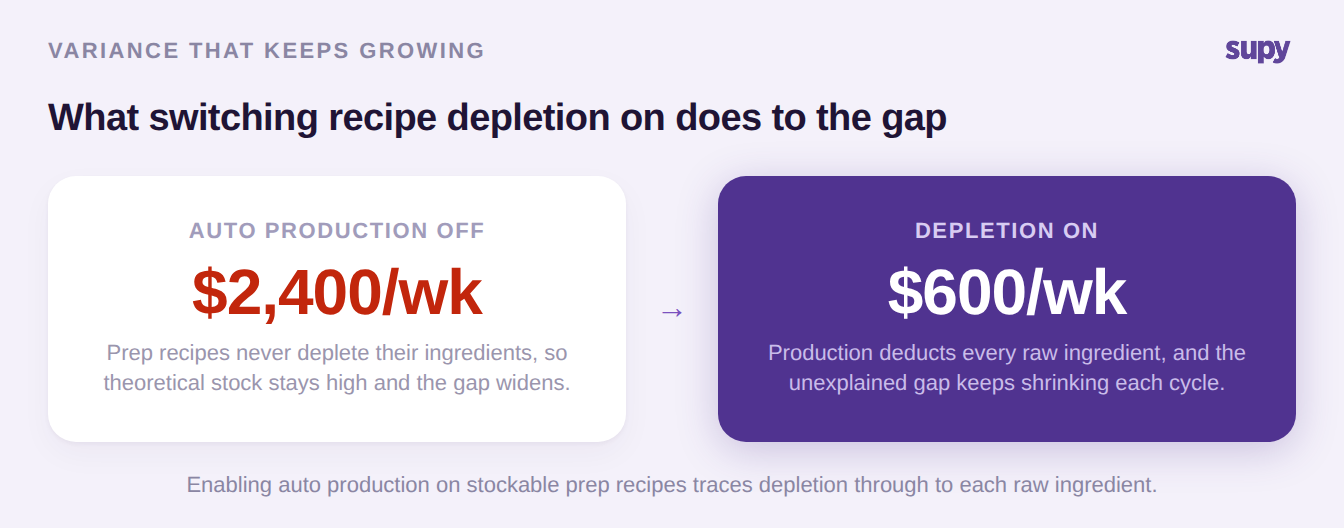
Expect the numbers to settle over two or three counting cycles rather than overnight, because you are watching a corrected process replace an accumulated error. If the trend flattens instead of falling, the cause is elsewhere and the next section applies.
When You Do Not Trust the Number Itself
Sometimes the balances are plausible and the counts are submitted, but a single item shows the same discrepancy week after week: chicken reading two to four kilos off against what the recipes say it should have used. A recurring, item-specific gap like that is rarely shrinkage. It is a definition problem, and the risk is that the same error is quietly affecting other key items such as flour, fries, and other proteins.
The way to settle it is to work one suspect item down three branches rather than recounting everything. Check the recipe definition first: a wrong quantity or a unit set to grams where it should be kilograms multiplies every depletion. Check the point-of-sale portion mapping next: if a menu item is mapped to the wrong recipe or portion, every sale depletes the wrong amount. Check the counting method last: an item counted in a different unit or pack size than it is purchased in will drift by a fixed amount every week.
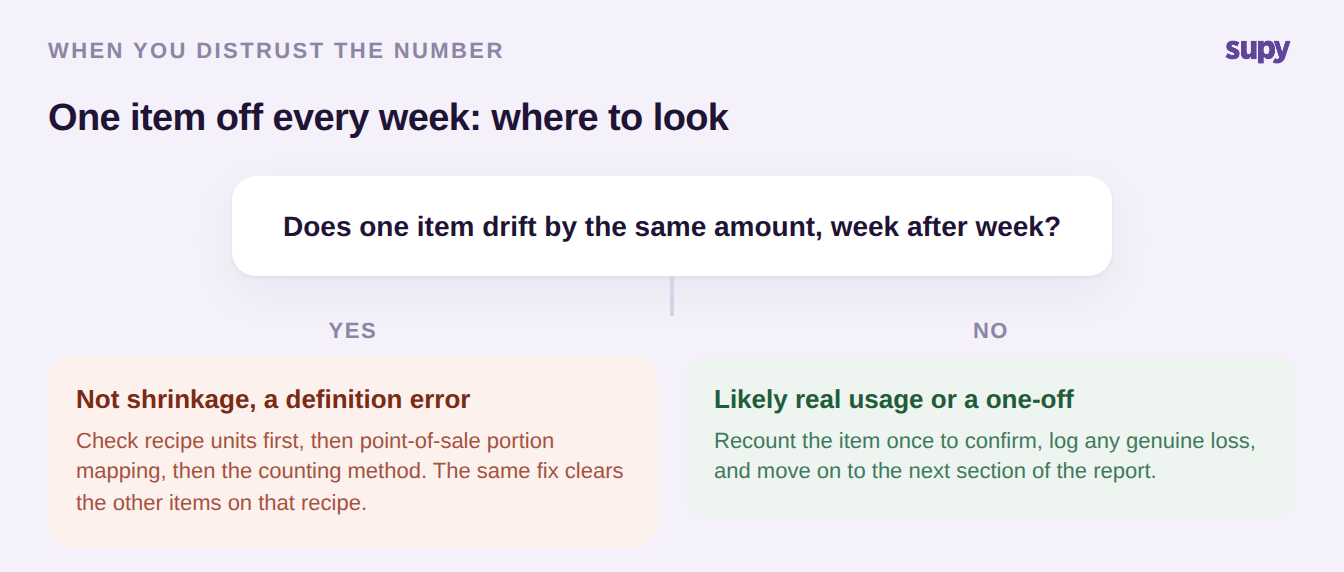
Because the discrepancy repeats by a consistent amount, one clean cycle on the suspect item usually reveals which branch is at fault, and the same fix then applies to the other items sharing that recipe pattern.
Reading the Variance Report Without Guessing
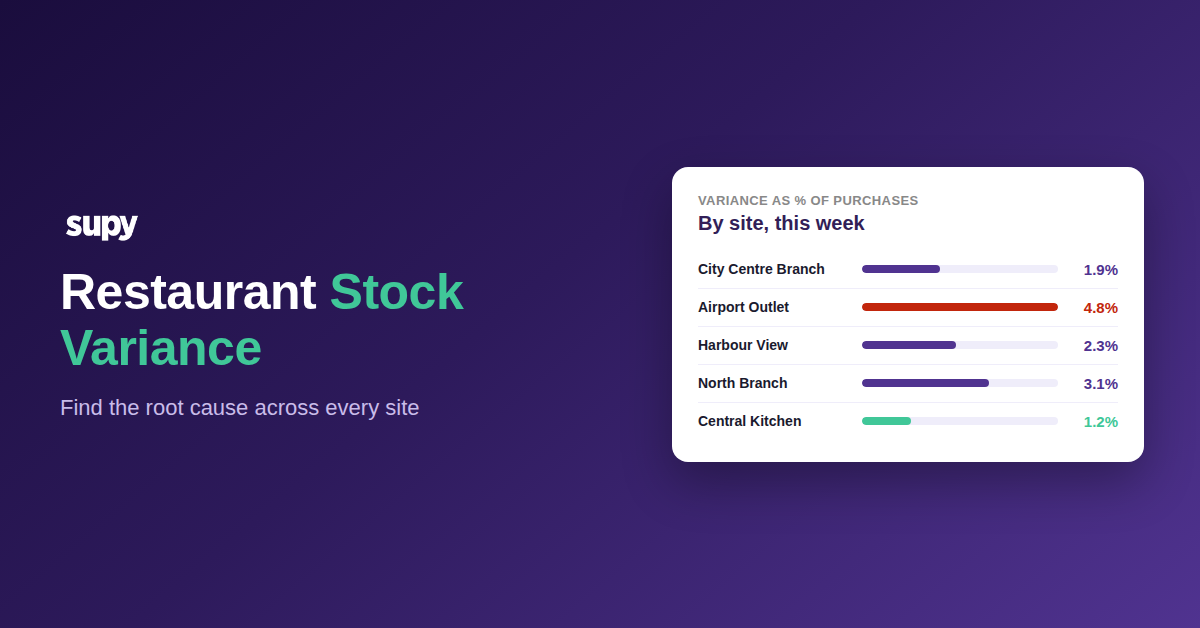
Once the setup checks are done, the variance report itself is the investigation surface, and a few of its behaviours keep an audit honest across sites. The expected on-hand quantity it shows is what the system recorded at the exact moment of the count, not the current balance, so a report reviewed several days later still compares like with like. A multi-period report only lets you pick dates that have a posted count behind them, so a comparison never returns a misleading result from a day nobody counted.
From there, filtering the report by item category lets a manager focus on one section at a time instead of scrolling hundreds of lines, and the biggest money is usually concentrated in one or two sections rather than spread evenly. Because Supy captures the recipe cost for each location and count date when a count completes, the report shows the food-cost impact of every variance per site, not just the quantity difference, and the whole thing exports to a spreadsheet in one click for an offline drill-down or a hand-off to finance. If you want to pressure-test what a single line item should cost before you chase it, a free food cost calculator settles it in a minute.
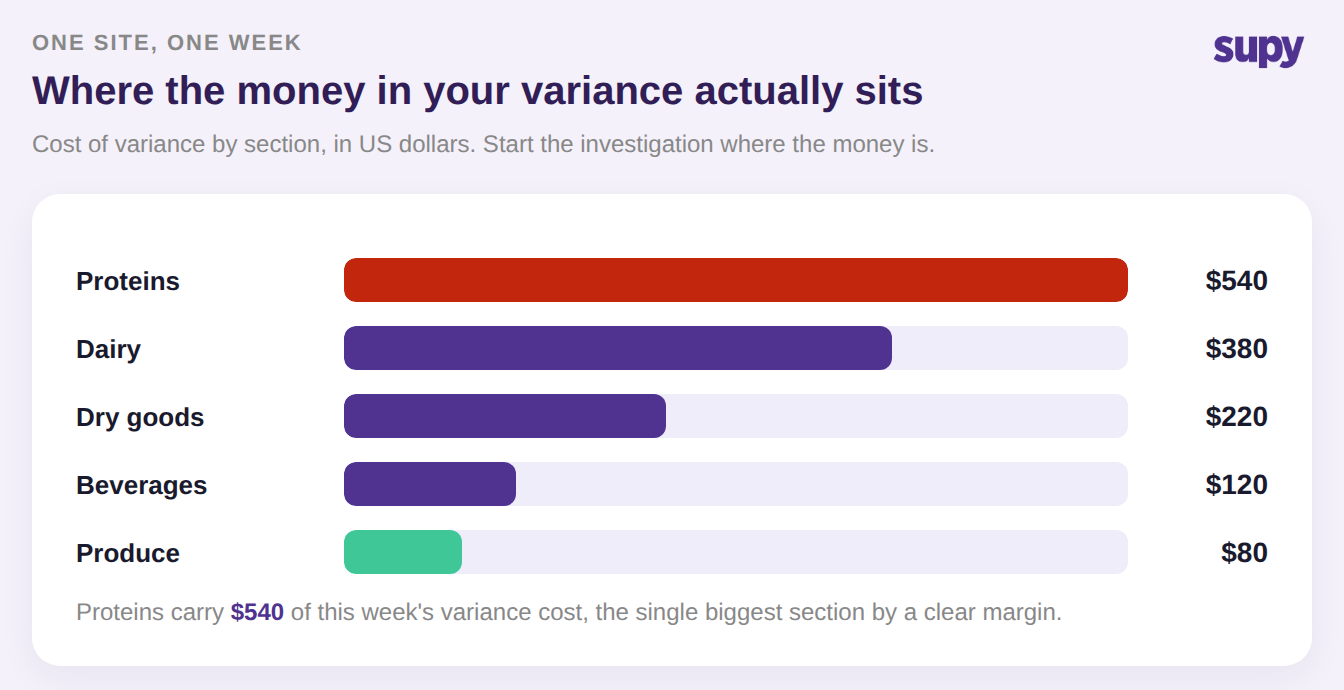
Sort by cost impact, start with the section carrying the most money, and you spend the investigation where it pays back rather than on the longest list of red lines.
Where to Start Your Next Investigation
The next time a site shows variance you cannot explain, run the four checks in order before you assume loss. Confirm the count was submitted, not left in draft. Confirm sales uploaded for every trading day. Confirm auto production is on for the stockable prep recipes. Then, if a single item still drifts, work it down the recipe, portion-mapping, and counting-method branches. Sort the report by cost impact, fix the section carrying the most money first, and give the change two or three counting cycles to show in the numbers. A trustworthy variance number is a setup you build once and then rely on at every site. If you want to see how stock counting and variance reporting work together across a group, the fastest way is to walk through it on your own data.