.jpg)


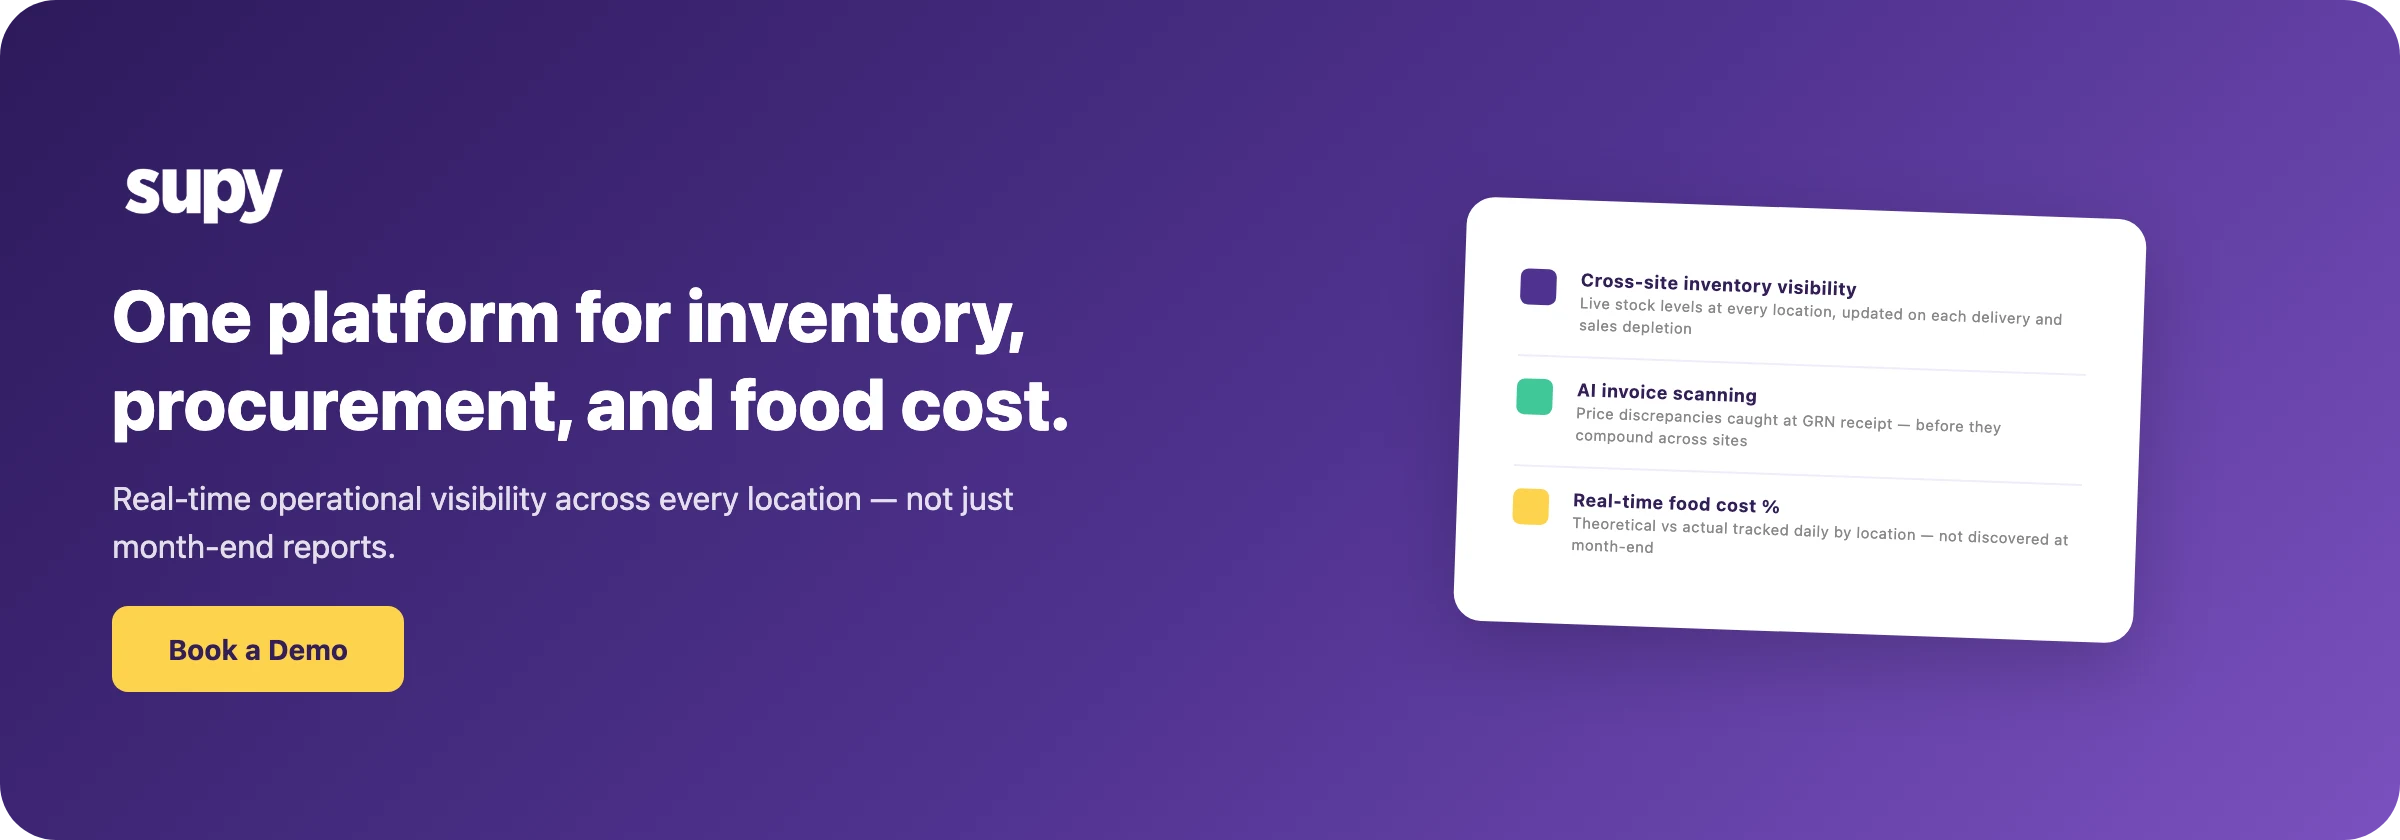
Restaurant Operations: The Ultimate Guide for F&B Managers
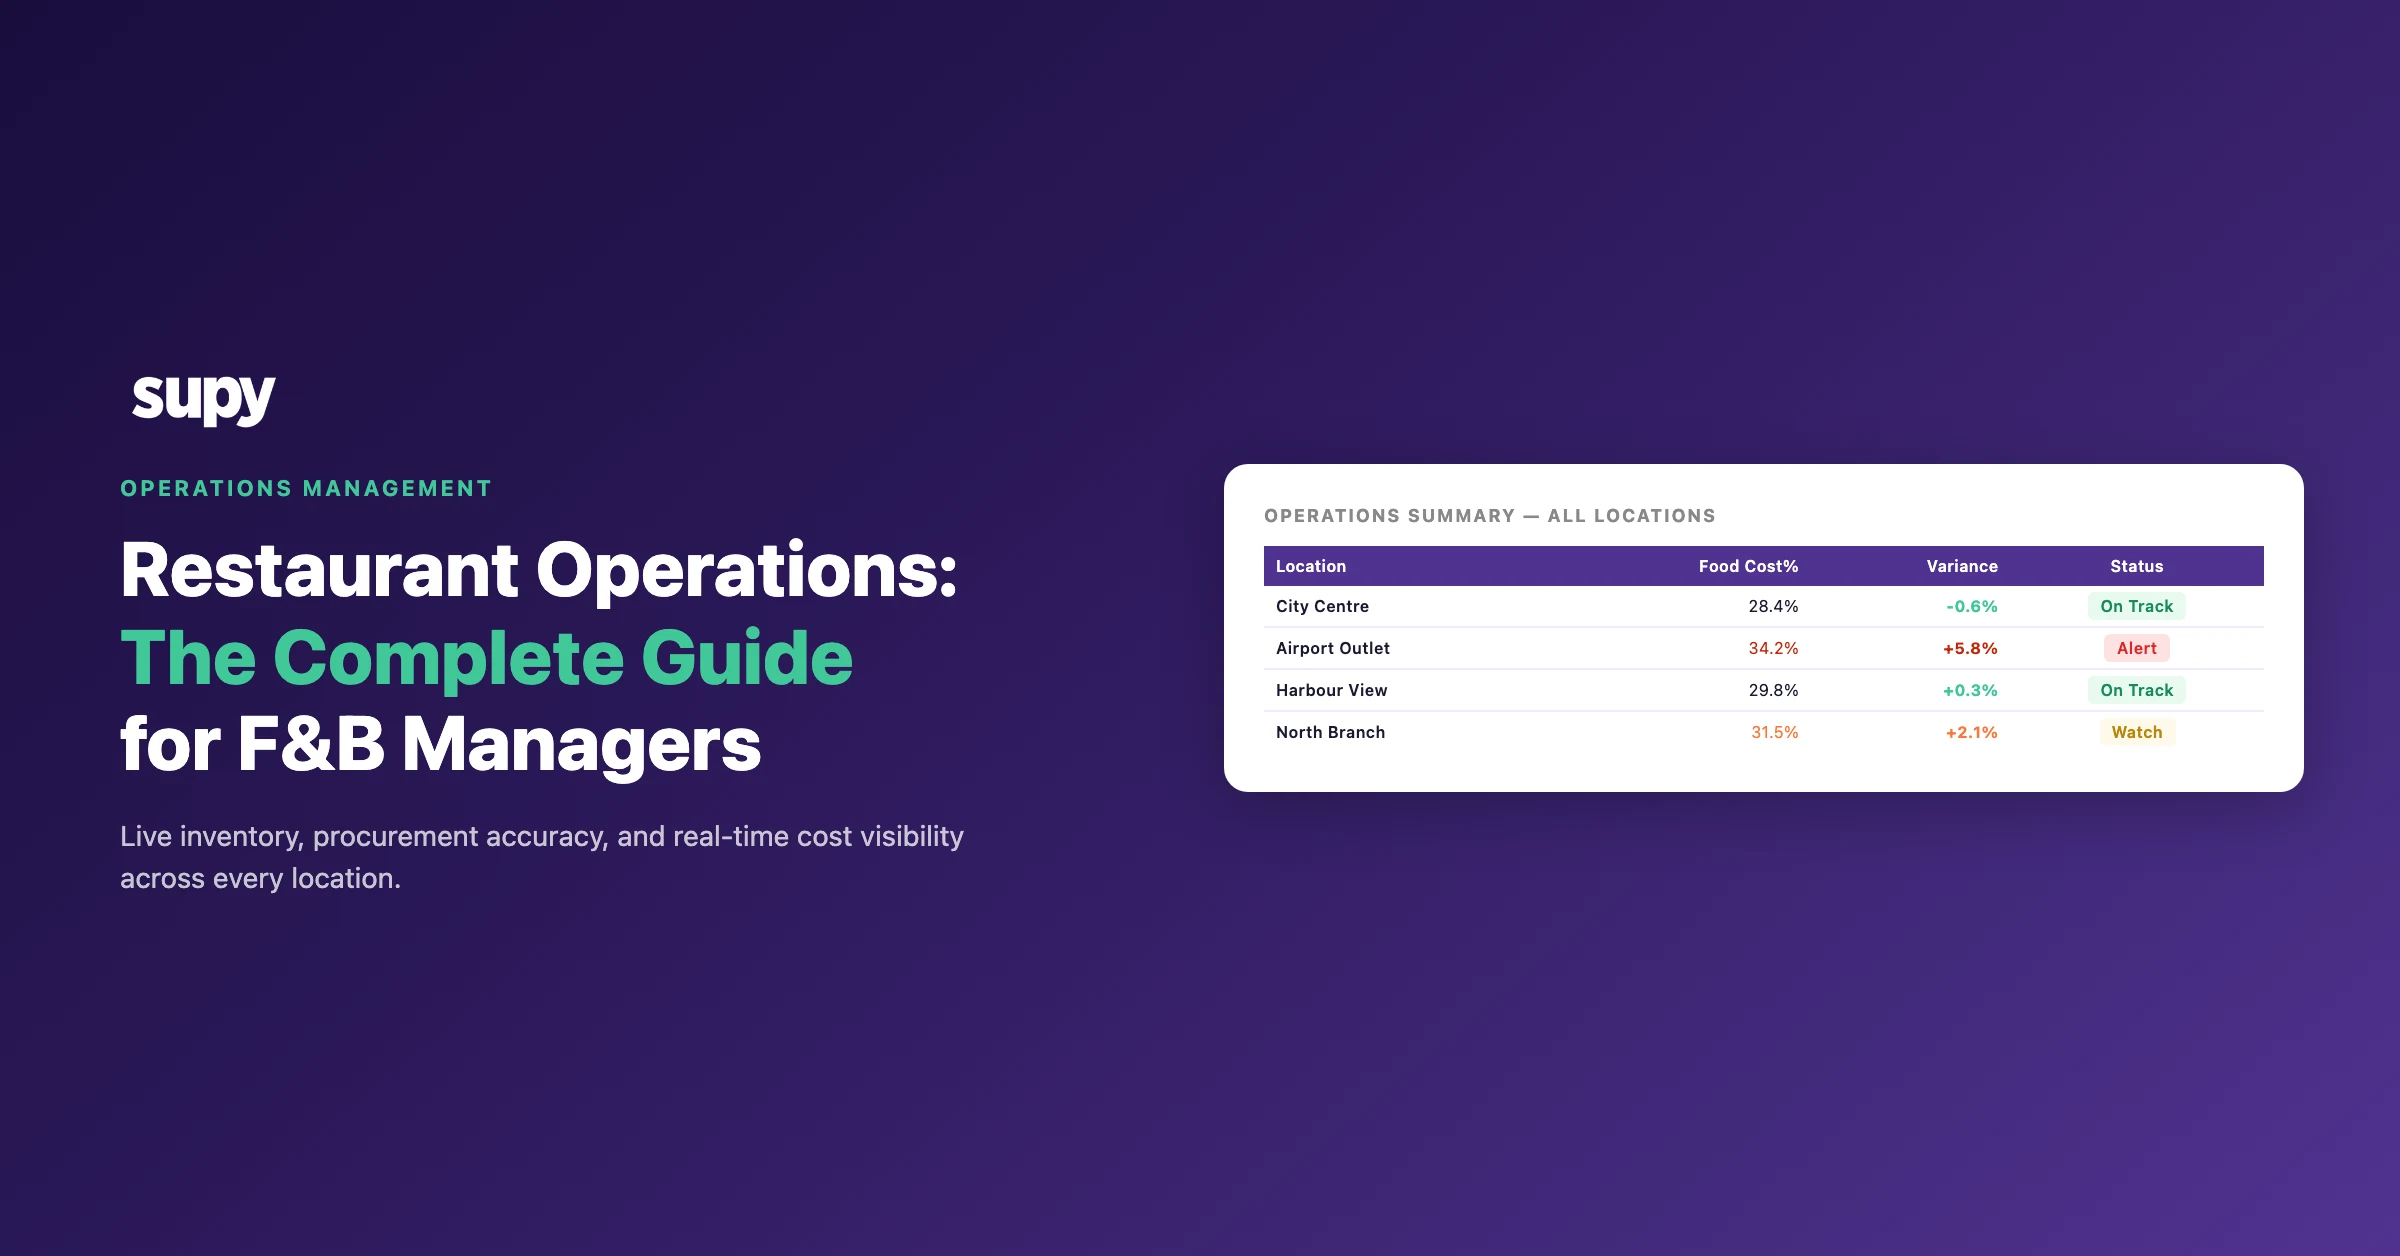
At a single site, restaurant operations run on a manager's instinct. Across a multi-site group that instinct does not scale, and the first place it shows is whether anyone can see stock in real time.
Restaurant Operations Begin with Real-Time Inventory Visibility
Most multi-site operators think they know their stock position. They have a spreadsheet updated after each count, a rough par level set by the head chef, and a manager who does a visual walk each morning. That is not inventory visibility - that is memory with a lag.
The real cost shows up in three specific ways. First, branches run out of high-margin items mid-service and scramble to transfer stock from another location, often without recording the movement. The sending location then shows a phantom variance at the next count. Second, managers over-order to avoid stockouts, carrying excess perishables that generate waste. Third, without stock-on-hand data by storage unit, prep teams work from habit rather than what is actually available.
A multi-location QSR chain in APAC discovered that manual stock counting across branches was generating a 4-6% food cost variance every month. The managers were spending 5-10 hours per week per site on counting alone - still arriving at inaccurate results because templates were not in shelf order and multiple counters were reconciling on paper.
What real-time inventory visibility actually requires:
The question to ask before selecting any inventory tool: does stock update automatically when goods are received and when recipes are produced, or does someone have to enter it manually?
Procurement Accuracy: Where the Cost Is Set Before the Food Arrives
A Saudi Arabia-based F&B group with multiple outlets ran a paper-based goods-received note (GRN) process for supplier deliveries. When a key protein supplier raised prices mid-contract, the increases passed through receiving undetected for weeks. By the time finance reconciled actual invoice values against the purchase budget, the food cost vs budget gap had reached 8-12%.
This is not a rounding error - it is a process failure. When the GRN step does not automatically compare received prices against the approved purchase order, price changes pass through unchallenged. In multi-site operations, this gap multiplies across every location and every delivery.
Procurement accuracy in a well-run restaurant operation covers four distinct functions:
Purchase order discipline - Orders are raised against approved templates with preferred-supplier assignments, quantities reviewed before submission, and sent via a direct integration rather than email. See restaurant procurement software for a detailed breakdown of what a modern procurement module should cover.
GRN-to-invoice matching - Every received delivery is matched against the corresponding PO. Price variances, quantity differences, and substitutions are flagged before the invoice is approved and stock is updated.
Invoice scanning - Suppliers that email invoices into a paper or email workflow create a manual entry bottleneck. AI invoice scanning extracts line items, prices, and totals from inconsistent formats, matches them to POs automatically, and flags exceptions for human review before any data reaches accounts.
Approval governance - Multi-site operations need sequential approval workflows triggered by order value and branch. Up to 5 approvers, spending limits by supplier and category, and a full audit trail of who approved what at what amount.
What to ask before choosing a procurement tool: can it compare received prices against the PO at the line-item level, flag the exception before the invoice is approved, and send that flag to the right person automatically?
Recipe-to-Actual Variance: The Blind Spot No Operator Can Afford
Recipe-to-actual variance is the gap between what your recipes say should have been consumed and what stock actually disappeared. Operators evaluating food inventory software consistently cite this as their biggest blind spot - and with good reason.
Without this data, an operator facing a food cost overrun cannot determine whether the cause is:
Each of these requires a different operational response. Without recipe-to-actual tracking, every investigation starts from zero.
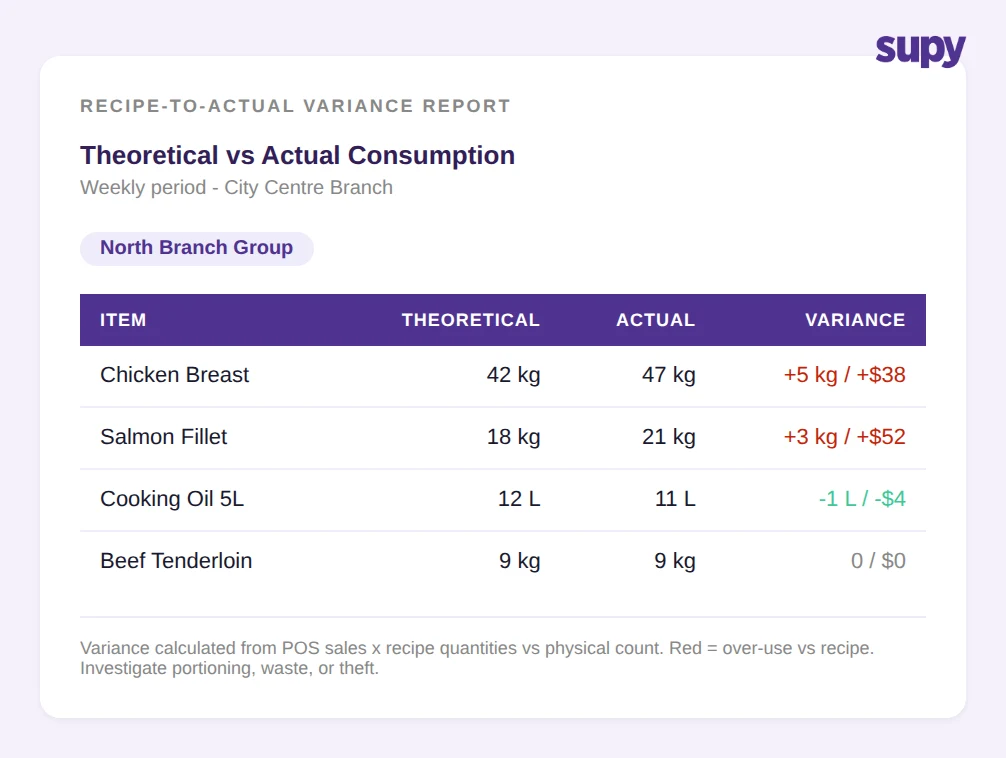
The process that makes this work requires three connected elements. First, every menu item must link to a recipe that specifies ingredient quantities, yield, and shrinkage. Second, every POS sale must deplete the correct ingredients automatically based on the recipe. Third, each stock count must compare actual usage against theoretical consumption for the same period.
This tracking extends to par level inventory management - understanding not just variance at month-end but whether each location is running at the right par for its sales volume.
For multi-site groups, recipe-to-actual variance at a group level also reveals which locations are performing consistently and which are outliers. A location running 3% above theoretical consumption on a specific category warrants a different conversation than one that is consistently on target.
Waste Management: From Acceptable Loss to Controlled Variable
Industry benchmarks indicate acceptable waste variance of 6-7% for GCC restaurant operators. A casual dining group across 8 locations in the GCC market reported a 28% reduction in food waste within 90 days of adopting dedicated software. The gap between those two figures is not luck - it is visibility and accountability.
The fundamental problem with waste in most restaurant groups is that it is invisible until counted. Prep waste, spoilage, trim waste, and overproduction all disappear into a general "shrinkage" figure that never gets attributed to a specific item, location, or cause.
What effective waste management requires:
Logged waste at the point of occurrence - Staff log the item, quantity, and reason category in seconds on a mobile device. The log auto-deducts from stock and assigns a cost impact. No end-of-shift reconciliation. No manager entry from memory.
Reason categorisation - Waste reasons (spoilage, overproduction, trim, error) allow the operation to identify systemic issues. A location logging 40% of waste as "overproduction" on a specific menu category needs a portion review, not a general cost conversation.
Multi-site comparison - A group-level view of waste by location, category, and item identifies which sites are outliers and what they are wasting that others are not. This is the data that makes a waste reduction conversation specific rather than general.
For a detailed treatment of waste tracking systems and how they integrate with inventory, see restaurant food waste tracking.
Before choosing a waste management tool, ask: can staff log waste at the point of occurrence on a mobile device with reason codes, and does that log immediately update stock and cost tracking at the branch level?
BI and Analytics: Replacing End-of-Month Discovery with Daily Visibility
The restaurant analytics conversation usually starts with dashboards and ends with a report that arrives three days after month-end when the problem is already done. What operators actually need is the data that prevents the problem, not the report that documents it.
Operational BI for restaurant groups serves three distinct functions:
Daily food cost tracking - Live COGS and food cost percentage at group and site level. Not a dashboard that refreshes weekly - one that updates as GRNs are received and POS sales are processed. A manager who can see today's food cost percentage at 2pm can still change something today.
Variance analytics - Theoretical-vs-actual usage broken down by item, location, and period. Slow-mover identification that flags items sitting past their expected sell-through. This is where the recipe-to-actual data becomes actionable for decisions about portion sizes, batch prep quantities, and menu mix.
AI sales forecasting - A 14-day sales forecast by branch and menu item that feeds into ordering decisions. The forecasting model uses historical POS data to project what each location will sell, and that projection flows directly into suggested order quantities, adjusted for current stock on hand. This removes the "manager's gut feel" from procurement and replaces it with a data-backed suggestion that a manager still reviews and approves before anything is sent.
This connects directly to the back of house restaurant operational model - where every function from inventory to procurement to waste feeds a single group-level view of cost performance.
Before choosing a BI tool for restaurant operations, ask: does it show live food cost percentage today, or does it show me last week's data? If the answer is the latter, it is a reporting tool - not an operational one.
The Restaurant Operations Integration Gap: Fragmented Tools vs a Connected Platform
The five systems above - inventory visibility, procurement accuracy, recipe tracking, waste management, and BI analytics - do not work in isolation. The operator who has inventory software, a separate procurement tool, a recipe costing spreadsheet, a paper waste log, and a monthly finance report has five data sources with no shared foundation. The numbers cannot reconcile because they were never connected.
The execution gap becomes visible at scale. A single-location operator can hold the connections in their head. A group with 8 or 15 or 30 locations cannot. At that scale, the cost of fragmentation is not inconvenience - it is the difference between knowing your food cost today and finding out in three weeks.
Inter-branch stock transfers are a concrete example. When a central kitchen dispatches stock to a branch, and the branch does not record the receipt, both locations show incorrect stock positions. The sending location shows stock it no longer has. The receiving location shows a phantom variance at its next count. Without a transfer system that requires the receiver to confirm before stock updates, this error repeats every time a transfer is made.
Food cost management software that integrates across all five functions eliminates the reconciliation layer entirely. There is no end-of-month manual consolidation because every transaction - GRN, sale, waste log, transfer, count - updates a single data model in real time.
Inventory management software for restaurants sits at the centre of this model. When inventory is the source of truth that procurement, recipe tracking, and waste all write into and read from, the group-level food cost view is always current.
What Supy Covers for Multi-Site F&B Operations
Supy is a back-of-house operations platform built for restaurant groups. Its core modules address each of the five systems described in this guide:
Supy integrates with 75+ POS, accounting, and ERP systems including Foodics, Oracle Micros, QuickBooks, Xero, and NetSuite.