.jpeg)

Food and Beverage Operations : la vraie différence entre gérer la Salle et gérer la Cuisine

La Salle et la Cuisine : deux opérations différentes sous un même nom
Food and Beverage Operations désigne le travail quotidien de gestion d'un établissement de restauration, divisé en deux disciplines distinctes : la Salle (Front of House), qui gère le service, le personnel et le flux des clients, et la Cuisine (Back of House), qui gère les Stocks, le coût des Recettes et l'Approvisionnement. La plupart des groupes les font fonctionner comme une seule équipe mais les mesurent comme deux.
Ces deux moitiés ont des rythmes différents. La Salle est jugée dans l'instant : couverts servis, temps d'attente, vente additionnelle, masse salariale rapportée à une ligne de ventes en direct. La Cuisine est jugée sur une période : ce qui a été acheté, ce qui a été consommé, ce que coûte la mise en assiette d'un plat, et quelle part a silencieusement disparu. Un problème en Salle se voit ce soir. Un problème en Cuisine apparaît dans le rapport de coûts du mois suivant, longtemps après que la cause a été oubliée.
Les deux fonctionnent aussi sur des outils différents. Service et planning se trouvent généralement dans un point de vente et une application de planification. Les Stocks, le Coût matière des Recettes et les achats vivent ailleurs, souvent dans un tableur. Traiter les Food and Beverage Operations comme une seule et même chose, c'est la façon dont les groupes se retrouvent avec une Salle bien tenue posée au-dessus d'une Cuisine que personne ne voit vraiment.
La Salle et la Cuisine ne sont pas la même opération
| Salle (Front of House) | Cuisine (Back of House) | |
|---|---|---|
| Gère | Service, personnel, flux clients | Stocks, coût des Recettes, Approvisionnement |
| Mesurée sur | Couverts et masse salariale, dans l'instant | Coûts et gaspillage, sur une période |
| Fonctionne sur | Point de vente et applications de planification | Systèmes de Stocks et de calcul des coûts |
| Un problème apparaît | Ce soir, en Salle | Le mois prochain, dans le rapport de coûts |
Où la Salle et la Cuisine doivent se transmettre des données
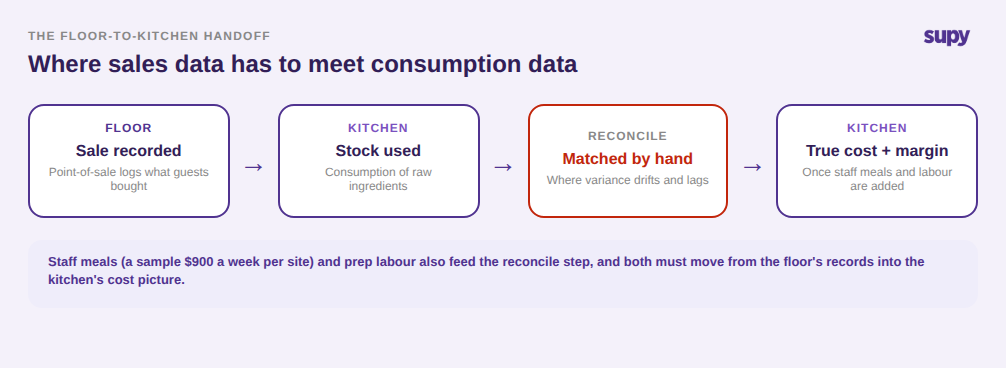
Les deux disciplines ne sont pas indépendantes. Elles se transmettent en permanence des données au passe, et c'est à cette jonction que réside la plupart de la douleur opérationnelle. Trois échanges comptent plus que tous les autres, et tous trois échouent de la même façon : les données naissent dans un système et doivent être réconciliées dans un autre à la main.
Le premier est ventes contre consommation. Le point de vente de la Salle sait ce qui a été vendu ; la Cuisine sait ce qui a été utilisé. Quand ces deux chiffres sont tirés de systèmes différents et alignés manuellement, ils dérivent – et l'Écart entre eux est l'endroit où le vol, le gaspillage et les erreurs de portionnement se cachent. Que cette comparaison soit juste dépend entièrement de la propreté avec laquelle les données de ventes transitent, ce qui est d'abord un problème de qualité des données, pas un problème de reporting. Il vaut la peine de comprendre comment les données du point de vente se rapprochent vraiment de ce que la Cuisine a consommé.
Le deuxième échange est les repas du personnel. La nourriture consommée par l'équipe est un coût réel, mais pas une vente client – elle doit être imputée hors chiffre d'affaires et intégrée au tableau de coûts de la Cuisine. Sur un seul site, cela peut représenter environ 900 $ par semaine qui, laissés sans imputation, gonflent silencieusement le Coût matière et font paraître la Salle moins rentable qu'elle ne l'est.
Le troisième échange est la main-d'œuvre dans le calcul du coût des Recettes. Le temps de préparation – pas seulement les ingrédients – fait partie du coût d'un plat. Quand les données de personnel ne vivent que dans l'outil de planification et n'atteignent jamais le modèle de calcul des coûts, la vraie Marge de la Cuisine reste une estimation.
Pourquoi la Cuisine travaille plus souvent en aveugle que la Salle
La Salle a presque toujours un chiffre en direct : le point de vente affiche le chiffre d'affaires en temps réel. La Cuisine a rarement l'équivalent. Le coût des matières premières, la Marge par plat et les Dépenses de Conditionnement sont généralement reconstitués après la clôture de la période, s'ils sont suivis du tout. Cette asymétrie est la raison pour laquelle la Cuisine est la moitié des Food and Beverage Operations la plus susceptible de fonctionner en aveugle.
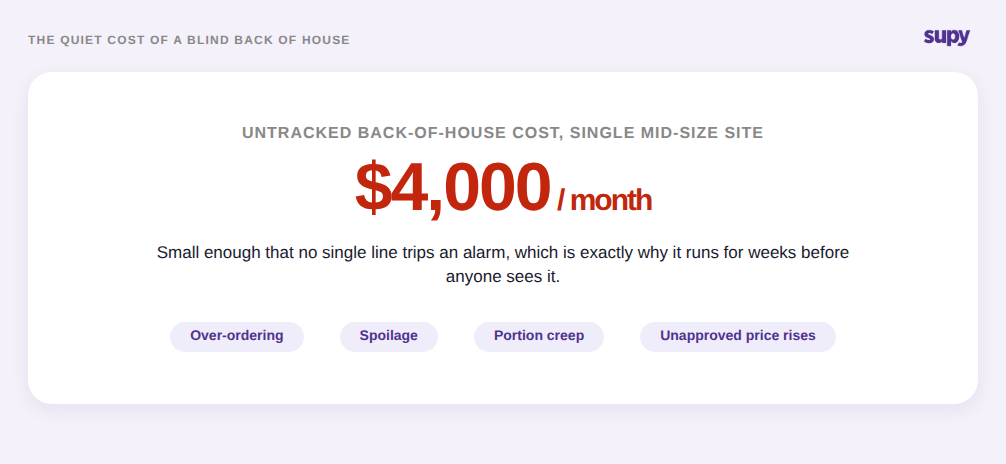
Le coût de cet aveuglement n'est pas dramatique ; il est silencieux. Quand personne ne peut voir les coûts de la Cuisine en quasi-temps réel, de petites fuites courent pendant des semaines avant que quiconque les remarque. Sur un seul site de taille moyenne, le coût de Cuisine non suivi peut atteindre par exemple 4 000 $ par mois, réparti entre surcommande, détérioration, dérive des portions et prix qui ont augmenté sans que personne ne les approuve. Aucun n'est assez important pour déclencher une alerte seul – c'est exactement pourquoi il survit.
Le problème se cumule sur plusieurs Points de vente. Un groupe ne peut pas comparer le Coût matière entre des établissements qu'il ne peut pas voir chacun, et les Stocks partagés aggravent les choses quand plusieurs Points de vente tirent d'un seul entrepôt sans propriétaire clairement désigné. Obtenir une réponse claire commence par déterminer qui détient réellement les Stocks sur les sites partagés. Tant que la Cuisine n'a pas sa propre vue en direct, l'exploitant pilote la moitié la plus coûteuse de l'activité dans le rétroviseur.
Ce que la fragmentation des outils coûte vraiment à un groupe multi-sites
La raison pour laquelle les jonctions échouent et les coûts fonctionnent en aveugle se résume généralement à un fait structurel : la Salle et la Cuisine fonctionnent sur des outils qui ne communiquent pas entre eux. Planification dans une application, service dans le point de vente, maintenance dans une troisième, et coûts de Cuisine et Stocks dans un tableur déconnecté de tout.
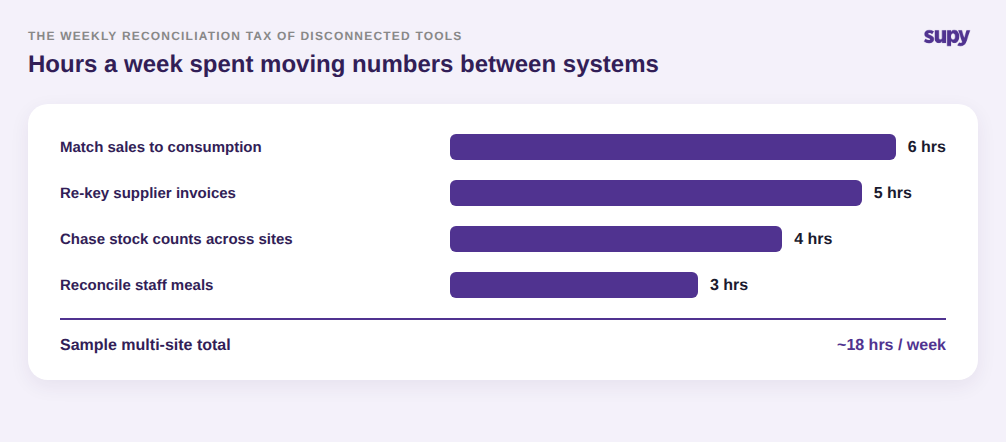
La fragmentation a un coût continu, payé en heures. Chaque lacune devient un rapprochement manuel que quelqu'un fait chaque semaine : faire correspondre les ventes à la consommation, ressaisir les factures des Fournisseurs d'un système à un autre, réconcilier les repas du personnel et suivre les Prises d'inventaire entre Points de vente. Sur un groupe multi-sites type, ces quatre tâches seules peuvent absorber environ 18 heures par semaine – du temps passé à déplacer des chiffres entre systèmes plutôt qu'à agir dessus.
Les heures ne sont que le coût visible. Le plus important est que les décisions sont prises sur des données obsolètes et assemblées à la main, si bien que l'exploitant est toujours en retard d'une semaine sur son propre établissement. Même les grands groupes le ressentent : un grand établissement de restauration rapide peut encore faire tourner ses achats en amont et la mise en place de nouveaux Produits sur des tableurs, ce qui limite la rigueur du contrôle de tout ce qui est construit dessus.
Pourquoi choisir un logiciel d'opérations est une décision d'adéquation, pas une course aux fonctionnalités
Quand un groupe cherche enfin un logiciel pour relier tout cela, le piège est d'acheter sur une liste de fonctionnalités. La plupart des outils de Food and Beverage Operations offrent des listes de fonctionnalités quasi identiques, si bien qu'une comparaison de spécifications ne dit presque rien. Le vrai facteur de différenciation est l'adéquation : dans quelle mesure l'outil correspond à la façon dont votre Salle et votre Cuisine fonctionnent réellement, et avec quelle propreté il transporte les données à travers la jonction entre elles.
Cela transforme la décision en un petit nombre de questions à tester lors d'une démo, pas une colonne de coches. Ferme-t-il la boucle ventes-consommation, afin que vous puissiez voir de vraies données de point de vente entrer et un Écart sortir de l'autre côté – plutôt qu'une capture d'écran d'un Tableau de bord ? Peut-il affecter des coûts hors ventes comme les repas du personnel, et pouvez-vous voir où ce coût atterrit ? Les coûts de Cuisine se mettent-ils à jour sans clôture mensuelle, ou la seule vue des coûts est-elle un rapport de période ? Et maintient-il une vue unique sur chaque Point de vente, si bien que saisir quelque chose dans un établissement change la vue du groupe en direct ?
Jugez chacun de ces points sur ce que vous voyez se produire à l'écran, pas sur ce que la liste de fonctionnalités promet. Un outil faible sur les quatre jonctions ci-dessus ne s'améliorera pas après l'achat, quelle que soit la longueur de sa liste.

Le constat honnête est qu'aucun système unique ne gère les deux moitiés des Food and Beverage Operations. Les outils de service, de personnel et de planification de la Salle forment leur propre catégorie. Supy se situe de l'autre côté du passe – la couche de contrôle de la Cuisine – où les Stocks, l'Approvisionnement et le Coût des recettes déterminent la Marge, et il se connecte aux systèmes de Salle qui gèrent le service plutôt que de chercher à les remplacer. Si la Cuisine est la moitié de votre établissement qui fonctionne en aveugle, c'est la couche à corriger en premier – et le moyen le plus rapide de voir si elle s'adapte à vos Cuisines est de l'observer avec vos propres données.