.jpeg)


Food and Beverage Operations: The Real Difference Between Running the Floor and Running the Kitchen

Front of House and Back of House Are Two Different Operations Sharing One Name
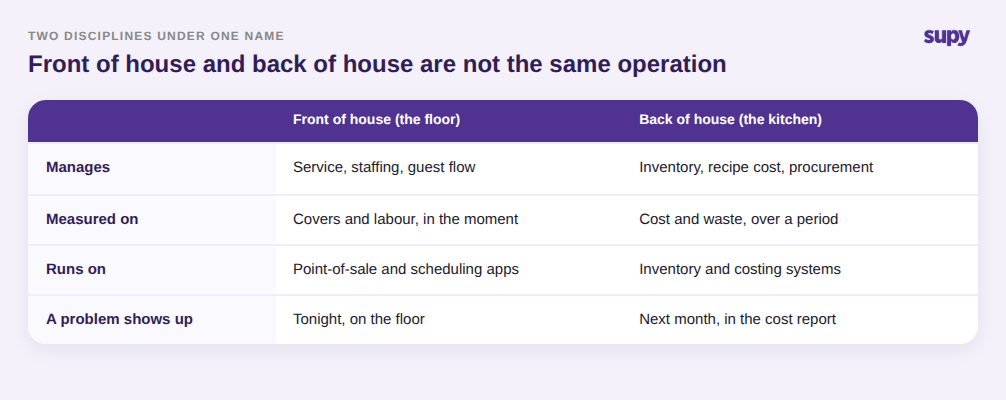
Food and beverage operations is the work of running a hospitality business day to day, and it splits into two distinct disciplines: the floor, or front of house, which manages service, staffing and guest flow, and the kitchen, or back of house, which manages inventory, recipe cost and procurement. Most groups run them as one team but measure them as two.
Those two halves keep different clocks. The floor is judged in the moment: covers turned, wait times, upsell, labour against a live sales line. The kitchen is judged over a period: what was bought, what was used, what it costs to put a dish on a plate, and how much of that quietly disappeared. A floor problem shows up tonight. A kitchen problem shows up in next month's cost report, long after the cause has been forgotten.
They also run on different tools. Service and labour usually live in a point-of-sale system and a scheduling app. Inventory, recipe cost and purchasing live somewhere else entirely, often a spreadsheet. Treating food and beverage operations as one undivided thing is how groups end up with a polished floor sitting on top of a kitchen nobody can actually see.
Where the Floor and the Kitchen Have to Hand Data to Each Other
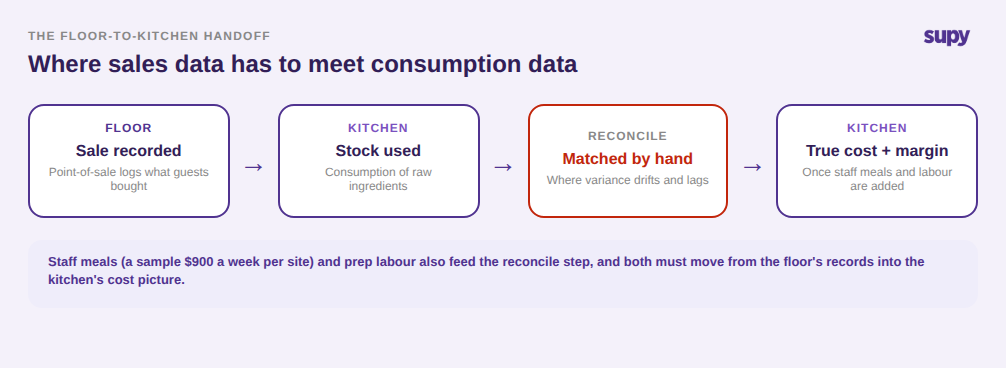
The two disciplines are not independent. They constantly hand data across the pass, and the handoff is where most operational pain lives. Three exchanges matter more than any other, and all three break the same way: the data starts in one system and has to be reconciled into another by hand.
The first is sales against consumption. The floor's point-of-sale knows what was sold; the kitchen knows what was used. When those two numbers are pulled from different systems and lined up manually, they drift, and the gap between them, the variance, is where theft, waste and portioning errors hide. Getting that comparison right depends entirely on how cleanly sales data crosses over, which is a data-quality problem before it is a reporting one, and it is worth understanding how point-of-sale data actually reconciles with what the kitchen used.
The second is staff meals. Food eaten by the team is a real cost, but it is not a customer sale, so it has to be attributed away from revenue and into the kitchen's cost picture. At a single site that might be a sample $900 a week that, left unattributed, silently inflates food cost and makes the floor look less profitable than it is.
The third is labour into recipe cost. Prep time, not just ingredients, is part of what a dish costs. When labour data lives only in the scheduling tool and never reaches the costing model, the kitchen's true margin stays a guess.
Why Back-of-House Cost Runs Blind More Often Than the Floor
The floor almost always has a live number: the point-of-sale shows revenue as it happens. The kitchen rarely has an equivalent. Raw material cost, margin by dish and packaging spend are usually reconstructed after the period closes, if they are tracked at all. That asymmetry is why the back of house is the half of food and beverage operations most likely to be flying blind.
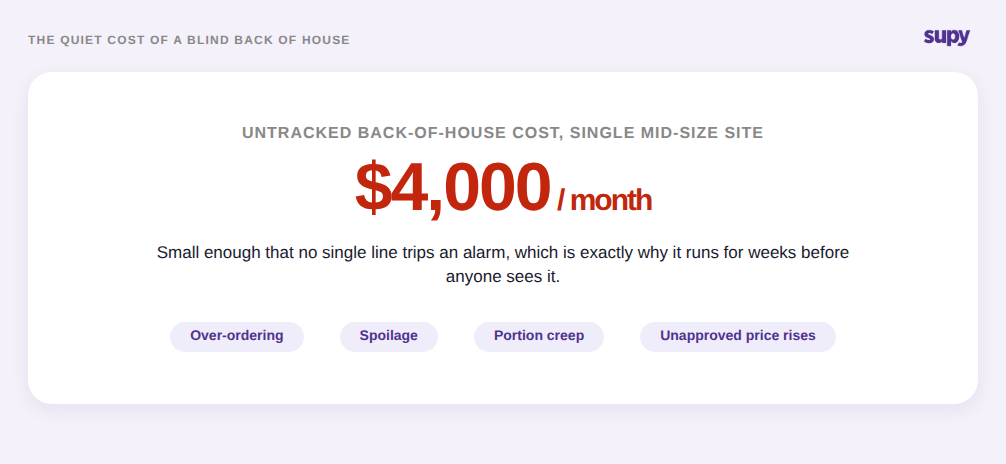
The cost of that blindness is not dramatic; it is quiet. When nobody can see back-of-house cost in near real time, small leaks run for weeks before anyone notices. At a single mid-size site, the untracked back-of-house cost can reach a sample $4,000 a month, spread across over-ordering, spoilage, portion creep and prices that crept up without anyone approving them. None of it is large enough to trigger an alarm on its own, which is exactly why it survives.
The problem compounds across locations. A group cannot compare food cost between branches it cannot each see, and shared stock makes it worse when several outlets draw from one store with no clear owner. Getting a straight answer starts with fixing who actually owns stock across shared sites. Until the kitchen has its own live picture, the operator is steering the more expensive half of the business by looking in the rear-view mirror.
What Tool Fragmentation Actually Costs a Multi-Site Group
The reason the handoffs break and the cost runs blind usually comes down to one structural fact: the floor and the kitchen run on tools that do not talk to each other. Scheduling in one app, service in the point-of-sale, maintenance in a third, and back-of-house cost and inventory in a spreadsheet disconnected from all of them.
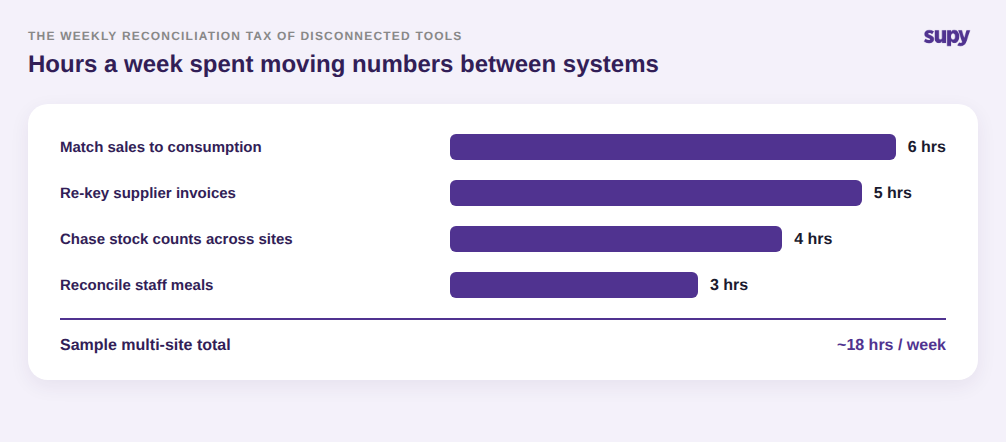
Fragmentation has a running cost, and it is paid in hours. Every disconnect becomes a manual reconciliation somebody does every week: matching sales to consumption, re-keying supplier invoices from one system into another, reconciling staff meals, and chasing stock counts across sites. On a sample multi-site operation those four tasks alone can absorb around 18 hours a week, time spent moving numbers between systems rather than acting on them.
The hours are only the visible cost. The larger one is that decisions get made on stale, hand-assembled data, so the operator is always a week behind their own business. Even large groups feel this: a big quick-service operation can still run its upstream buying and new-product setup on spreadsheets, which caps how tightly everything built on top of it can be controlled.
Why Choosing Operations Software Is a Fit Decision, Not a Feature Race
When a group finally goes looking for software to pull this together, the trap is to shop by feature checklist. Most food and beverage operations tools offer near-identical feature lists, so a spec-sheet comparison tells you almost nothing. The real differentiator is fit: how well the tool matches the way your floor and your kitchen actually run, and how cleanly it carries data across the handoff between them.
That turns the decision into a small number of questions worth testing in a demo, not a column of ticks. Does it close the sales-to-consumption loop, so you can see real point-of-sale data flow in and variance come out the other side, rather than a screenshot of a dashboard? Can it attribute non-sale costs like staff meals, and can you watch where that cost lands? Does back-of-house cost update without a month-end, or is the only cost view a period report? And does it hold one picture across every site, so entering something at one branch changes the group view live?
Judge each of those on what you see happen on screen, not on what the feature list promises. A tool that is thin on the four handoffs above will not get better after you buy it, however long its checklist is.

The honest read is that no single system runs both halves of food and beverage operations. The floor's service, labour and scheduling tools are their own category. Supy sits on the other side of the pass, the back-of-house control layer, where inventory, procurement and recipe costing decide the margin, and it connects to the front-of-house systems that run service rather than trying to replace them. If the back of house is the half of your operation running blind, that is the layer to fix first, and the fastest way to see whether it fits how your kitchens run is to watch it against your own data.