.jpg)


Restaurant Profit and Loss Template: Why Multi-Site Totals Mislead
What a Multi-Site Restaurant Profit and Loss Statement Has to Show
A restaurant profit and loss statement lists revenue at the top, subtracts cost of goods sold and labour to reach prime cost, then subtracts operating and occupancy costs to reach net profit. For a multi-site group, every one of those lines has to exist twice: once consolidated for the group, and once for each location. The consolidated view on its own hides too much to run a group from.
The template itself is not the hard part. Any spreadsheet can hold the rows. What separates a profit and loss statement you can run a group on from one you file and forget is whether each line traces back to a real number, and whether you can pull it for a single site as easily as for the whole group. The table below is the structure most multi-site groups settle on.
| Line item | What it captures | Where the number comes from |
|---|---|---|
| Revenue | Sales per site, net of tax | Point of sale, reconciled to bank |
| Cost of goods sold | Food and beverage used, not purchased | Opening stock plus purchases minus closing stock |
| Gross profit | Revenue minus cost of goods sold | Calculated |
| Labour | Wages, salaries, and on-costs | Payroll, split per site |
| Prime cost | Cost of goods sold plus labour | Calculated |
| Operating expenses | Cleaning, marketing, repairs, supplies | Accounts payable, coded per site |
| Occupancy | Rent, insurance, utilities | Fixed schedule per site |
| Net profit | What remains after every cost | Calculated |
Before you choose or build one, ask a single question of every line: does it have a source you can point to, and can you produce it for one location on its own? A line you cannot trace or cannot split is a line you cannot manage.
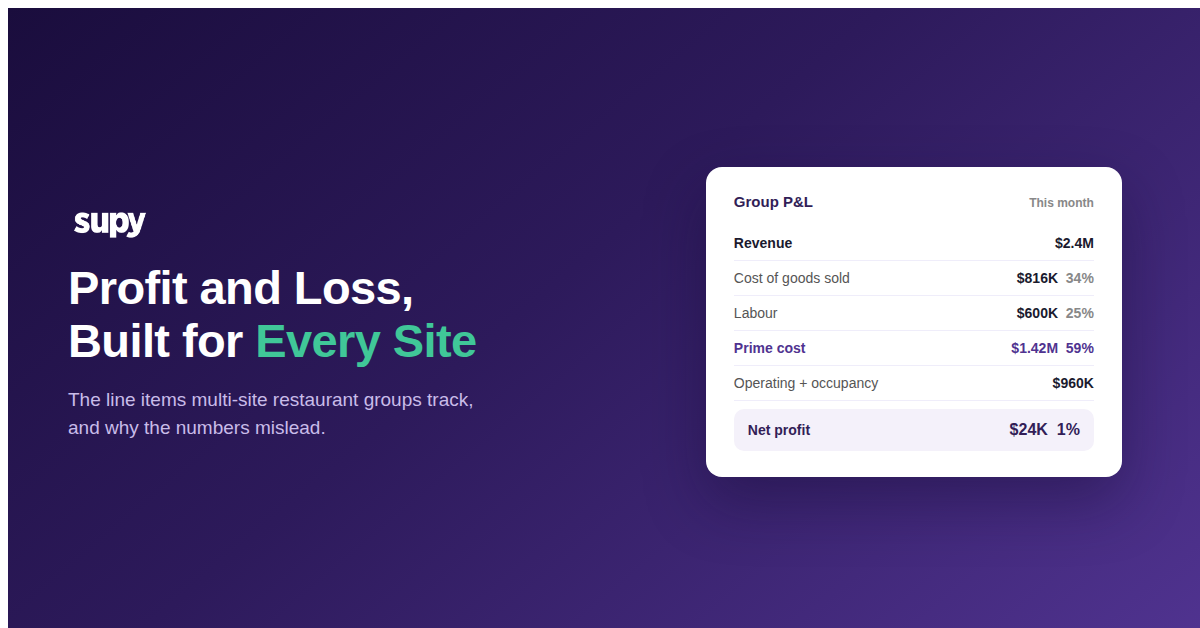
To make that concrete, here is the same structure filled in for one month, using an illustrative group turning over $2.4M a year. This is what a completed statement looks like. Read the percentage-of-revenue column rather than the dollar figures, because the percentages are what stay comparable across sites and across months.
| Line item | Amount | % of revenue |
|---|---|---|
| Revenue | $2,400,000 | 100% |
| Cost of goods sold | $816,000 | 34% |
| Gross profit | $1,584,000 | 66% |
| Labour | $600,000 | 25% |
| Prime cost | $1,416,000 | 59% |
| Operating and occupancy | $960,000 | 40% |
| Net profit | $24,000 | 1% |
Build one column like this for the group, then an identical column for every location. The group column is only the sum of the site columns. A single group net-profit line, 1% here, tells you nothing about whether every site earned it or one site is dragging while another carries the group. Only the per-site columns show that, which is exactly what the margin comparison later in this guide makes visible.
How to Fill In the Template, and How to Read It
A template only earns its place once it is populated from real sources and read in a fixed order. Fill it in line by line, from the top:
- Revenue. Pull net sales per site from your point of sale and reconcile the total to what actually reached the bank. Tax comes out here, not further down.
- Cost of goods sold. Do not type in a purchase figure. Use opening stock plus purchases minus closing stock, per site, and note whether the closing figure is a real count or last month's. That one distinction decides how far you can trust this line.
- Gross profit and prime cost. These are calculated, not entered. Gross profit is revenue minus cost of goods sold; prime cost is cost of goods sold plus labour. Let the sheet compute them so they cannot drift.
- Labour. Take wages, salaries, and on-costs from payroll and split them per site. A shared area manager or central kitchen cost is allocated across sites, not left sitting in a group bucket.
- Operating and occupancy. Code every accounts-payable line to the site it belongs to. Rent, insurance, and utilities sit on a fixed per-site schedule.
- Net profit. Calculated: everything above, subtracted from revenue, for each site and for the group.
Then read the finished statement in the same order every period:
- Percentages before dollars. Cost of goods sold, labour, and prime cost as a share of revenue are what compare across sites and months. The dollar amounts on their own do not.
- Prime cost first. It is the largest controllable block on the statement, so a one-point move there matters more than a move anywhere else. Check it per site before you look at net profit.
- Cost of goods sold with a question attached. Is this line theoretical or actual, and how old is the count behind it? A clean-looking number built on a four-week-old count is describing a restaurant you were running last month.
- Net profit per site, never only blended. The group line is an average, and an average hides its weakest member. Open every site column and find the lowest before you decide the group is healthy.
Why the Cost of Goods Sold Line Rarely Matches Reality
Cost of goods sold is the line operators trust most and should question the hardest. On the statement it looks like one clean figure. Underneath, it rests on recipe costs that drift out of date, waste that never gets logged, and a stock count that may be weeks old. A 4-location group operating at 34% food cost and roughly 1% net profit treated any error in that number as a direct financial risk, and they were right to.
There are two cost-of-goods numbers, not one. Theoretical cost is what your recipes say you should have used, and it is available every day. Actual cost depends on a physical stock count, and most groups count monthly. One operator put it plainly: a monthly count is too late for daily cost control. If your profit and loss statement uses last month's count, its cost line describes a restaurant you were running four weeks ago.
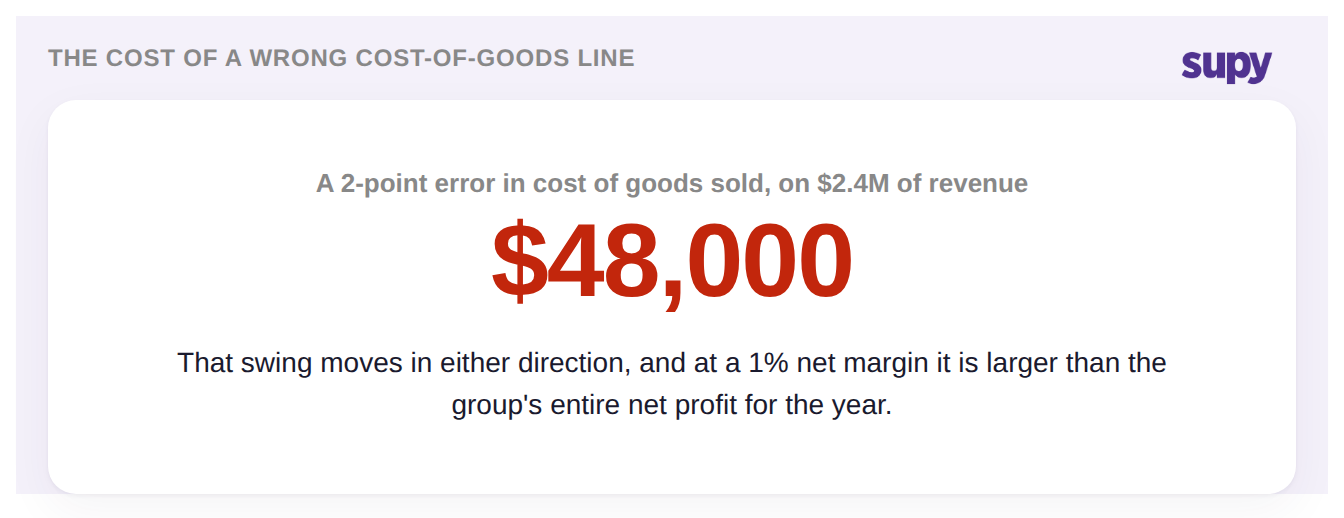
The fix is not a better template. It is knowing which cost-of-goods number a given line represents and how old the count behind it is. Our guide to restaurant cost of goods sold covers the formula itself, and a free food cost calculator checks a single recipe. Before you act on a variance, ask: is this line theoretical or actual, and when was the last count that fed it?
What Actually Reaches Your Accounting System
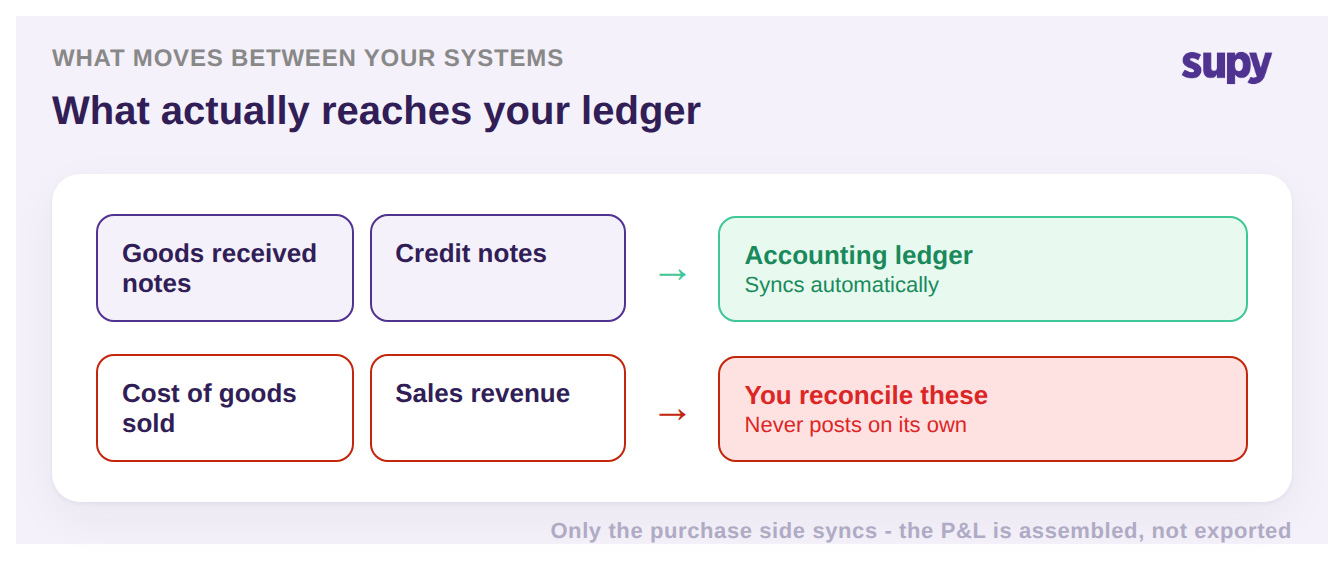
Most operators assume their cost of goods sold and sales revenue flow automatically into their accounting platform. They do not. In most inventory-to-accounting integrations, only goods received notes and credit notes are pushed to the ledger. Cost of goods sold and revenue are not. This is the single most repeated accounting expectation gap operators hit, and it changes how you build the statement.
It means the profit and loss statement is something you assemble, not something you export. Your accounting system holds the purchase side. Your inventory system holds what was actually used. The two have to be reconciled before the cost line is trustworthy. One accounting team found invoice discrepancies between their inventory system and their general ledger that were inflating cost of sales in every downstream dashboard. Another watched beverage items show up as food cost because of how one category was mapped.
This is where the chart of accounts earns its place: it decides which purchases land in which line. Get the mapping wrong once and every statement inherits it. Our guide to a multi-entity restaurant chart of accounts covers how the mapping holds across sites. Before you trust a consolidated statement, ask: which numbers on it came from accounting, and which did I assemble myself?
Reading Margin Across Sites Without Averaging Away the Weak One
A consolidated net margin is an average, and an average hides its worst member. A group can report a healthy-looking net margin and still have one location barely above break-even. The blended number is the one most groups read first, and it is the one most likely to let a failing site run for another quarter.
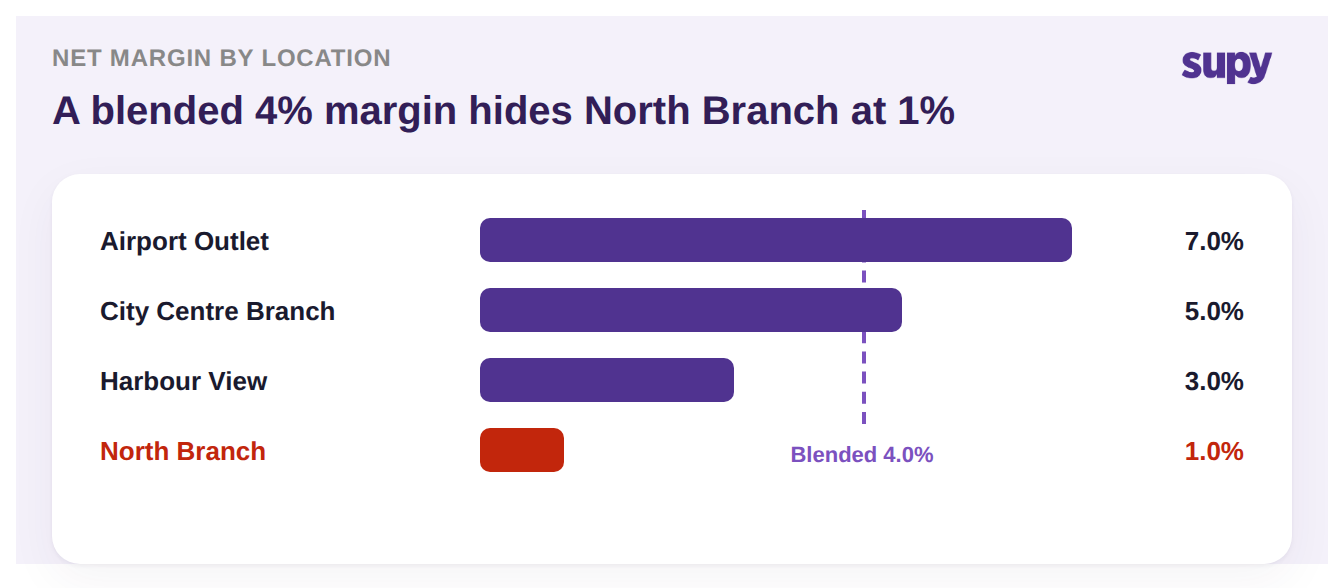
The chart shows the trap. Four locations, a blended 4.0% net margin, and North Branch sitting at 1.0% while Airport Outlet at 7.0% carries the group. Read only the consolidated line and both facts disappear. This is why the per-site column in the template is not optional. You need to see each location against the group, on the same lines, in the same period. Our post on average restaurant profit margin covers where those numbers should land.
So before you trust next month's statement, run four checks on your own numbers. Every line traces to a source you can name, not a manual estimate. The cost-of-goods line says whether it is theoretical or actual, and the count behind it is under a month old. You know which figures came from accounting and which you assembled. And you can pull the whole statement for your weakest location, not just for the group.
This is the point where inventory data and the profit and loss statement meet. Supy gives multi-site operators exportable cost reports they can filter by date range and by any combination of sites, so the per-location column stops being a manual rebuild every month. Purchases, waste, and production costs tag to the accounting categories you define, so what lands in each line is a decision you made once rather than an accident of how an invoice was coded. See how Supy's analytics pulls the per-site view together.