.jpg)


Restaurant Cost of Goods Sold (COGS): Formula, Benchmarks, and How to Reduce It

Most restaurant groups can recite their food cost percentage to one decimal place. Far fewer can reconcile that number against the cost of goods sold line on their P&L - and the gap between those two figures is where margin silently disappears. Operators who close a ten-point COGS gap do it by connecting live purchase prices to standardised recipes, not by running better spreadsheets at month-end. This guide covers the COGS formula, benchmarks segmented by restaurant format, and five operational levers to bring your number down.
What Restaurant COGS Actually Means
Cost of goods sold is the total cost of all food and beverage ingredients consumed during a specific accounting period. It appears as a line item on your profit and loss statement, sitting directly below revenue and before gross profit. The food cost percentage formula you use daily in the kitchen is an operational ratio - COGS is the finance-side expression of the same reality, measured in dollars rather than percentages.
The distinction matters because food cost percentage is calculated in real time from recipes and sales, while COGS is calculated from inventory movements over a full accounting period. When these two numbers diverge, something is leaking - portions are drifting, waste is unrecorded, or purchase prices have moved since the recipe card was last updated.
Across multi-site operators on the platform, the most common source of that divergence is a lag between ingredient price changes and recipe cost updates. A procurement team negotiates new supplier pricing on the first of the month, but recipe cards still reflect last quarter's costs. The food cost percentage dashboard says 29%. The P&L says 34%. Five points of margin evaporated in the gap between theoretical and actual.
The COGS Formula for Restaurants
The standard restaurant COGS formula is straightforward:
COGS = Opening Inventory + Purchases - Closing Inventory
Each component requires accurate data to be useful:
Opening inventory is the dollar value of all food and beverage stock at the start of the period. This must match the closing inventory from the previous period exactly - any discrepancy signals a counting or valuation error.
Purchases covers every ingredient bought during the period, valued at the actual price paid. This includes delivery charges and any credit notes from returns. One common mistake is recording purchases at the contracted price rather than the invoiced price - if a supplier adds a surcharge or substitutes a higher-priced item, the P&L must reflect what was actually paid.
Closing inventory is the dollar value of all stock remaining at the end of the period. This is where most operators introduce error - a rushed stocktake, inconsistent unit conversions, or counting stock at purchase price rather than most recent cost.
Worked Example: Marina Grill
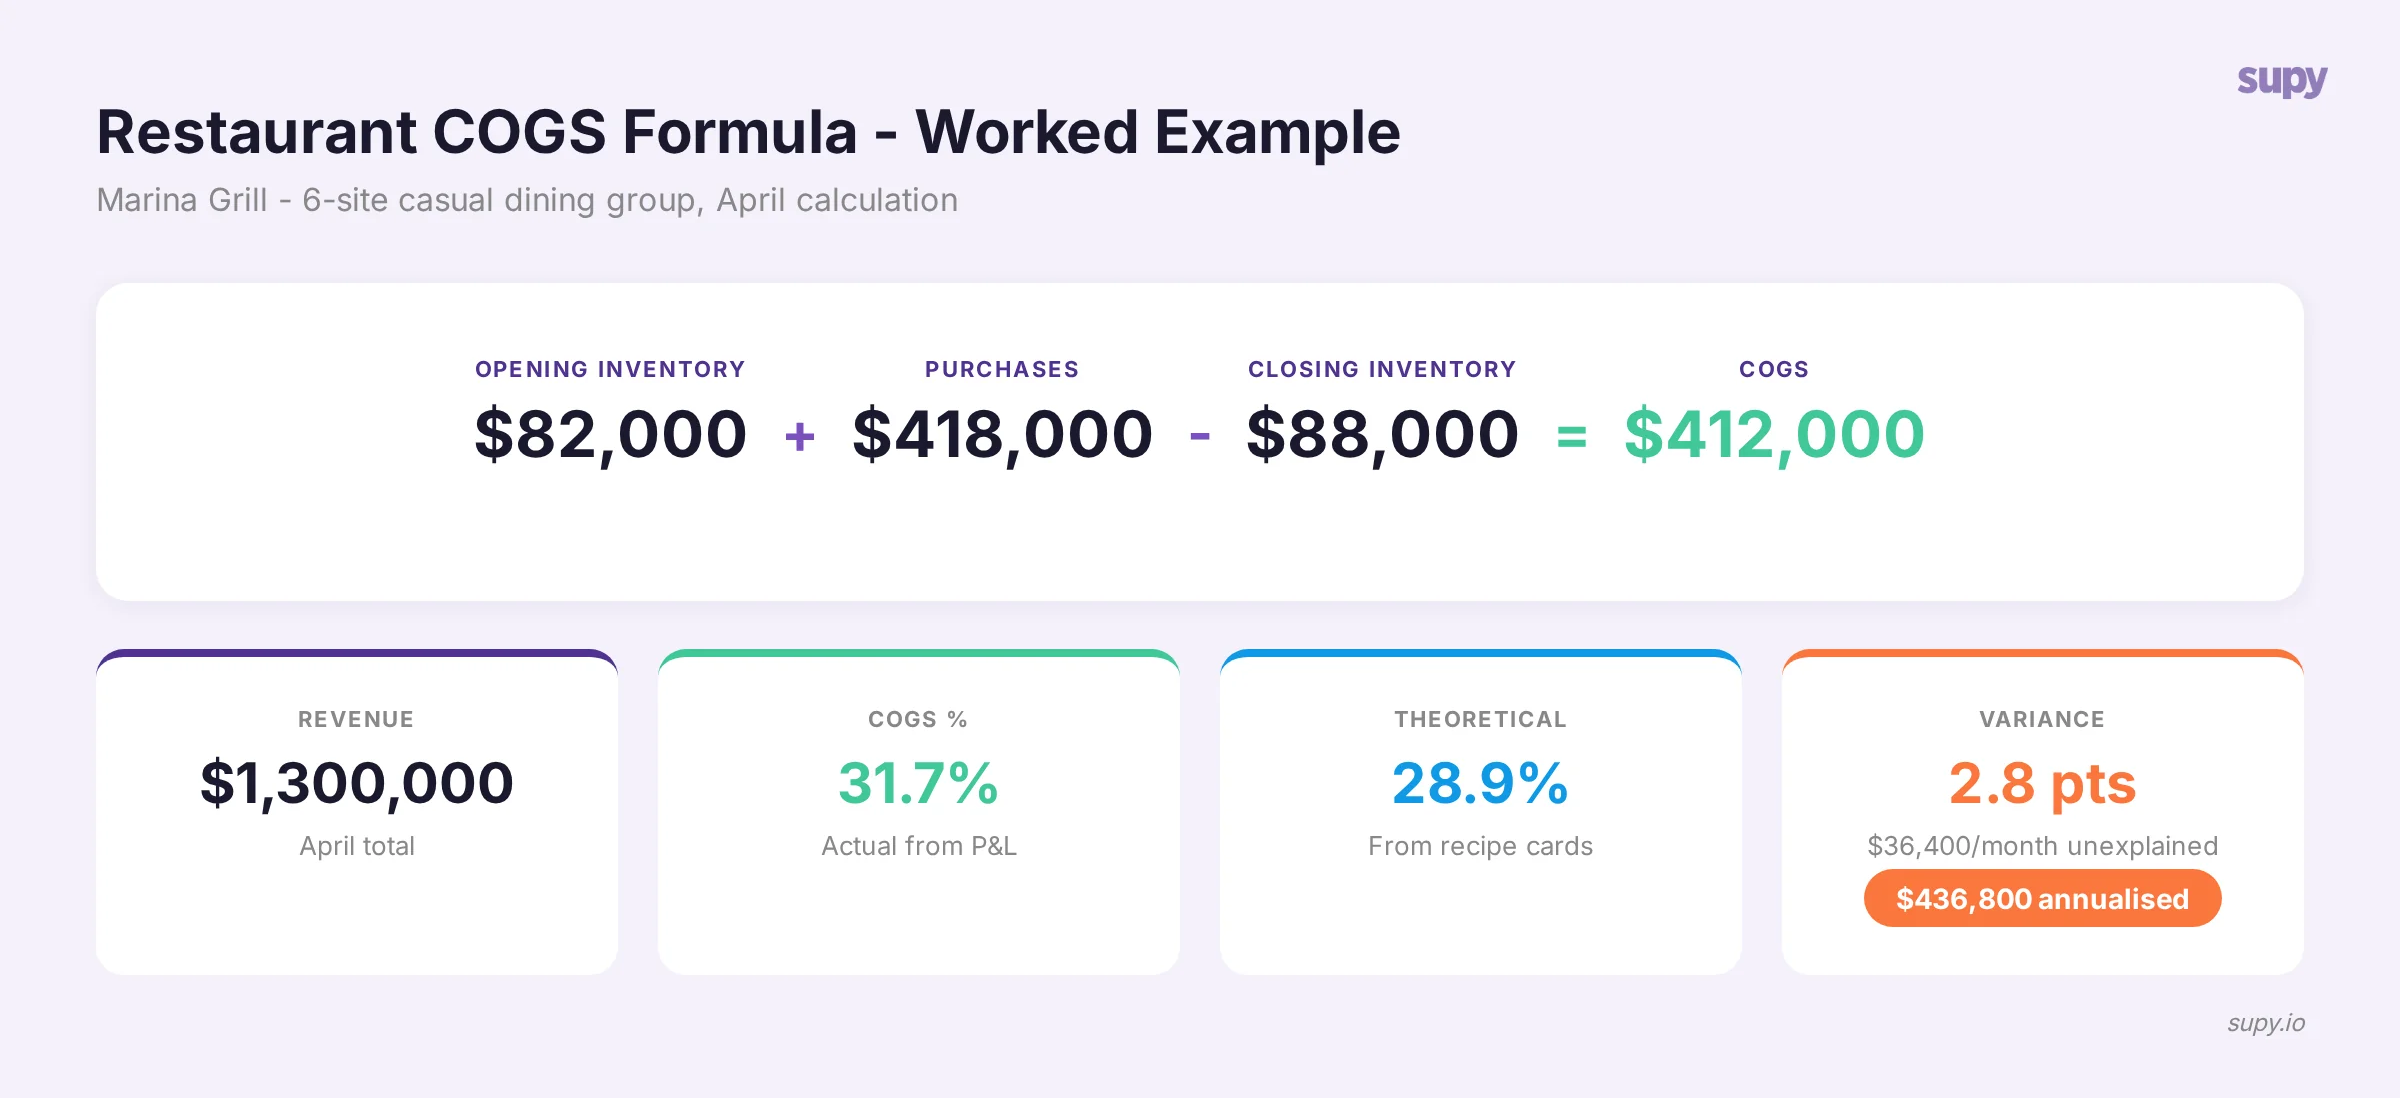
Marina Grill is a 6-site casual dining group running monthly COGS calculations.
COGS = $82,000 + $418,000 - $88,000 = $412,000
Against April revenue of $1,300,000, that gives a COGS percentage of 31.7%.
Now here is the number that matters: Marina Grill's theoretical food cost - calculated from recipe cards multiplied by items sold - was 28.9%. The 2.8-point variance represents $36,400 in unexplained cost over a single month. That is $436,800 annualised, sitting in the gap between what should have been consumed and what was actually consumed.
In Supy, this reconciliation happens automatically. The platform pulls actual purchase prices from processed invoices and maps them to recipe ingredient costs in real time. When a supplier price moves, every recipe that uses that ingredient updates its theoretical cost immediately - so the gap between theoretical food cost and actual COGS becomes visible weekly rather than as a month-end surprise.
COGS Benchmarks by Restaurant Format
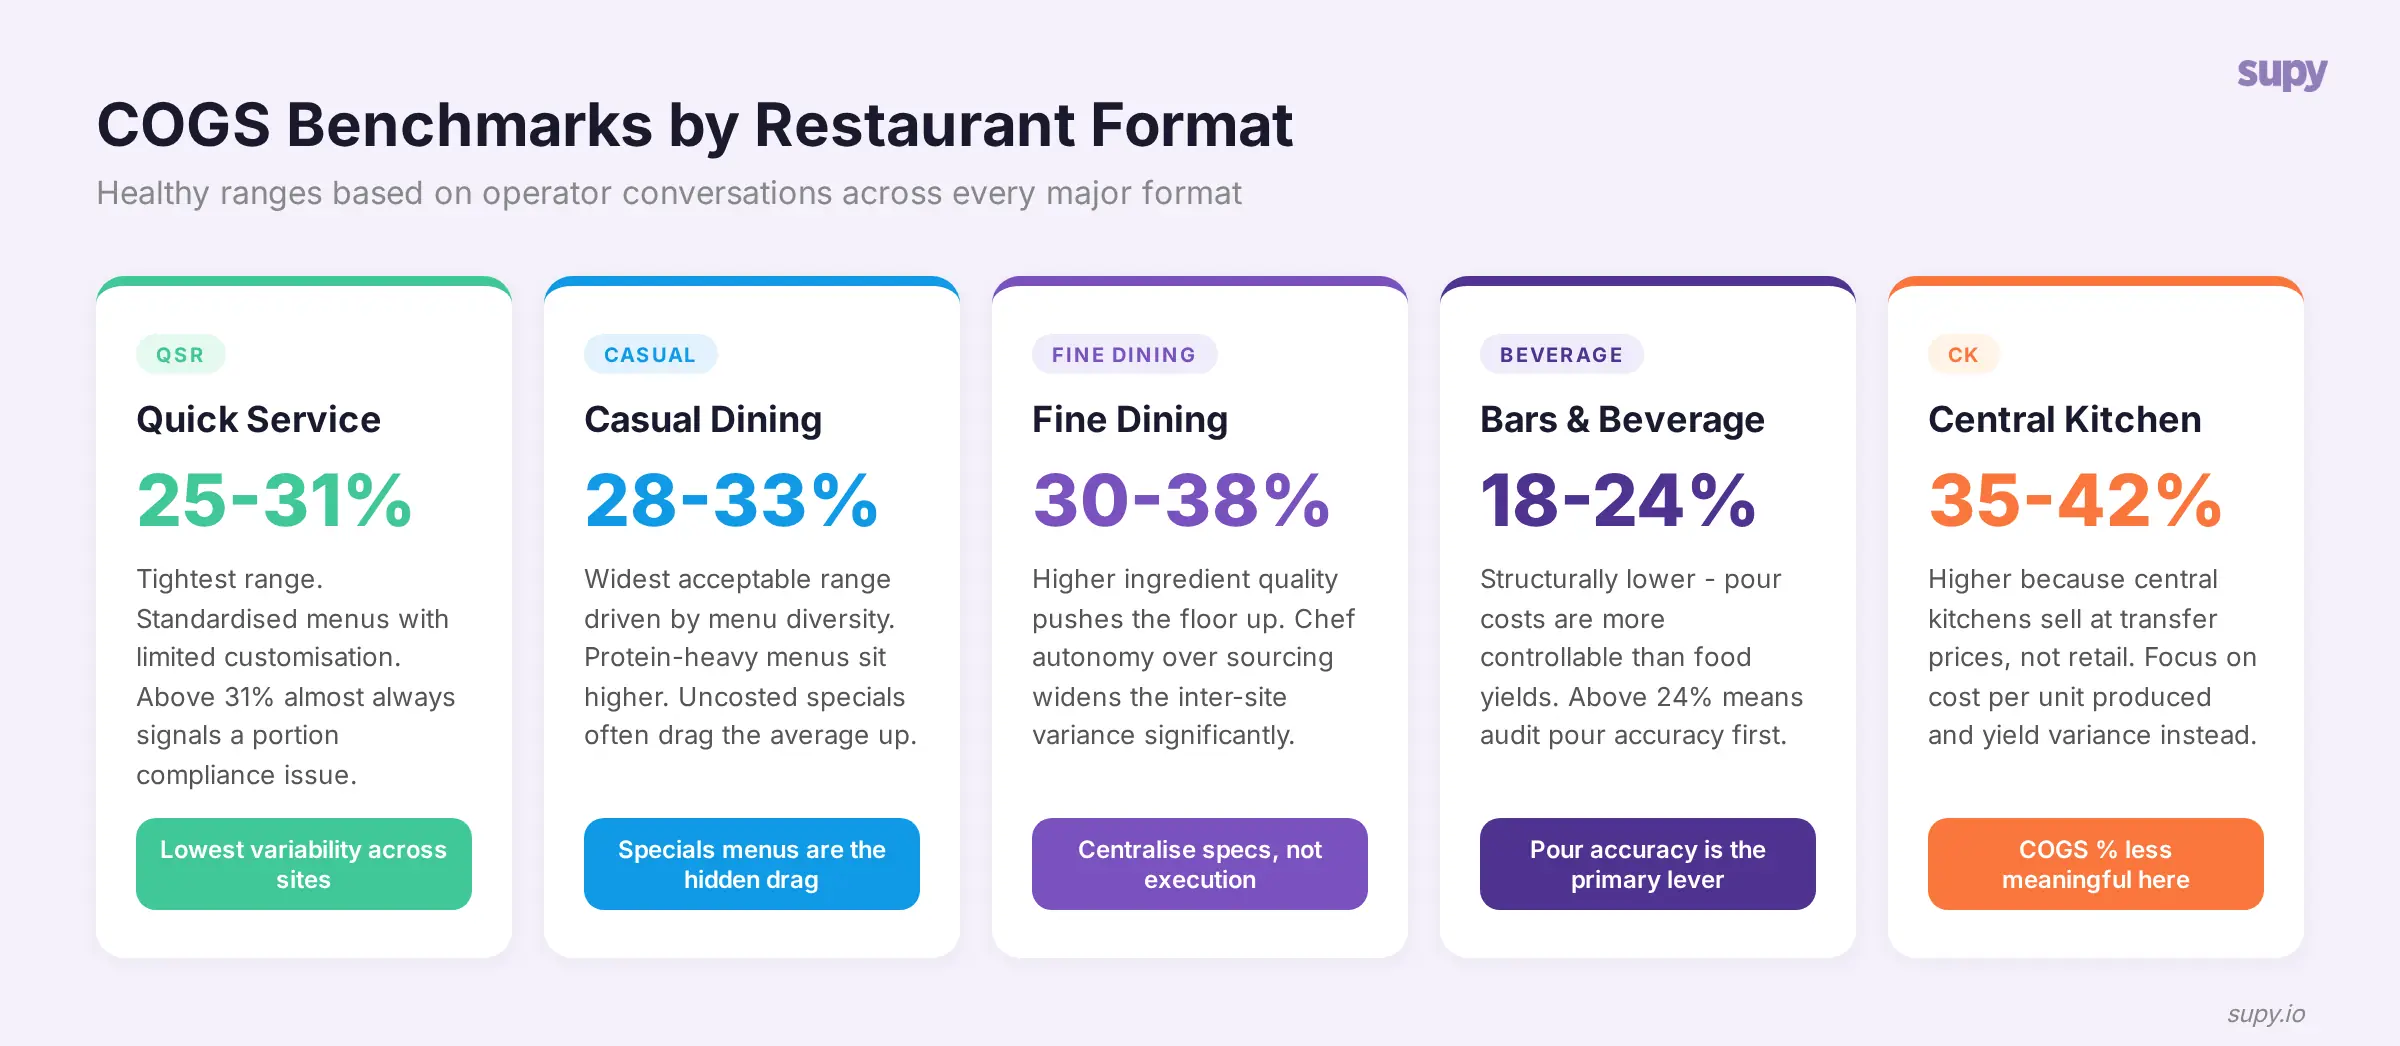
A 34% COGS is catastrophic for a QSR operator and perfectly normal for a fine-dining restaurant. Benchmarks without format segmentation are useless - yet most published COGS guides offer a single range. Here is what healthy looks like, based on conversations with operators across every major format:
Quick-service restaurants (QSR): 25-31% COGS. The tighter range reflects standardised menus with limited customisation. Operators above 31% in QSR almost always have a portion compliance issue - the recipes are costed correctly, but the line is not building them to spec.
Casual dining: 28-33% COGS. The widest acceptable range, driven by menu diversity. Protein-heavy menus (steakhouses, seafood) naturally sit higher. Operators at the top of this range often find that their specials menu - priced intuitively rather than from a costed recipe - is dragging the average up.
Fine dining: 30-38% COGS. Higher ingredient quality and more complex preparations push the floor up. The variance between sites within a fine-dining group tends to be wider than in QSR because chef autonomy over sourcing is greater. Multi-site fine-dining operators who centralise their purchasing specification - while leaving execution to the kitchen - consistently land at the lower end of this range.
Bars and beverage-led venues: 18-24% COGS on beverages. Beverage COGS is structurally lower because pour costs are more controllable than food yields, and premium pricing absorbs supplier cost increases more easily. Operators above 24% should audit their pour accuracy and spillage recording first.
Central kitchens and commissaries: 35-42% COGS. Higher than site-level because central kitchens sell at transfer prices to outlets, not at customer-facing retail prices. The COGS percentage is less meaningful here - focus on cost per unit produced and yield variance instead.
One pattern that surfaces repeatedly across operators on the platform: the gap between the best-performing and worst-performing site within a single group is almost always wider than the gap between good and average operators across the industry. A 12-site group might have one site running 27% COGS and another at 35%. The aggregated group number hides the problem.
Five Levers to Reduce Restaurant COGS
Every COGS reduction ultimately traces back to one of five levers. Understanding which lever to pull first depends on where your variance sits.
1. Recipe Standardisation and Costing Accuracy
The foundation. If your recipe cards do not reflect what the kitchen actually builds, every downstream calculation is fiction. Recipe standardisation means every ingredient has a defined quantity, a defined unit, and a cost that updates when purchase prices change.
The mistake most operators make is treating recipe costing as a one-time exercise. A recipe card built in January with January prices is wrong by March if your chicken supplier has adjusted pricing twice. Across operators we have onboarded over the last twelve months, the average number of ingredient price changes per month exceeds forty for a mid-size group. Static recipe costs cannot keep up.
In Supy, recipe costs update dynamically as new invoices are processed. When the procurement team receives an invoice with a price change, the system recalculates the theoretical cost of every recipe that uses that ingredient - automatically. This means the gap between your recipe-card COGS and your P&L COGS narrows to the variance that actually matters: waste, portioning, and unrecorded consumption.
2. Purchase Price Control
The second-largest COGS lever after recipe accuracy. Purchase price control is not about beating suppliers on price - it is about knowing what you agreed to pay and catching when you pay more.
Most multi-site operators have contracted prices with their key suppliers. But invoice-level compliance is rarely checked systematically. One operator described their process as reviewing a sample of invoices weekly - which means price deviations on the other 80% of invoices go undetected until the monthly P&L shows an unexpected spike.
The operational fix is automated invoice matching against agreed prices. When a delivery arrives at $4.20 per kilogram instead of the contracted $3.90, the variance should surface immediately - not in a month-end reconciliation exercise that is already three weeks too late to dispute.
3. Waste Reduction and Recording
Waste is the most emotionally obvious COGS lever but the hardest to manage with data. The challenge is not reducing waste - every operator knows waste is bad. The challenge is recording it accurately enough to identify patterns.
A common pattern across multi-site operators: waste recording happens diligently for the first two weeks after a new system is introduced, then compliance drops to below 30% within two months. The operators who sustain waste recording are the ones who connect it to something the kitchen team cares about - typically, showing each site how their waste cost compares to the group average. Competition between sites is a more effective motivator than compliance mandates from head office.
When waste is recorded consistently, it becomes a diagnostic tool. Supy's waste tracking connects recorded waste back to the inventory variance calculation, so an operator can see exactly how much of their theoretical-to-actual COGS gap is explained by recorded waste versus unexplained shrinkage. If your variance is 3% and recorded waste accounts for 1.2%, you know the remaining 1.8% is sitting in portioning drift, unrecorded spoilage, or receiving errors.
4. Portion Compliance
This is the lever that surfaced most frequently in conversations with prospects evaluating back-of-house software. One operator put it plainly: their goal was to bring COGS from 40% down to 30%, and they identified portion control as the wedge that would close most of that gap.
Portion compliance is not about portion size - it is about consistency. A recipe that calls for 150 grams of protein served at 180 grams across six sites adds 20% to that ingredient's consumption. Multiply that across a full menu and the COGS impact compounds quickly.
The operational mechanism is straightforward: weigh, record, compare to spec. The challenge is embedding that discipline across every shift at every site. The operators who achieve it treat portion compliance as a kitchen KPI with the same visibility as revenue per cover - not as a back-office audit finding that arrives weeks after the variance occurred.
5. Accurate Stocktakes
The COGS formula requires accurate opening and closing inventory values. A stocktake that is wrong by 3% in either direction can swing your COGS percentage by a full point - enough to mask or exaggerate a real trend.
The most common stocktake errors across operators on the platform fall into three categories: counting errors (miscounting physical stock, especially in walk-in freezers), unit conversion errors (recording 10 cases when the system expects kilograms), and valuation errors (counting stock at the price it was bought rather than the most recent purchase price).
For operators running monthly COGS calculations, a single inaccurate stocktake contaminates two months of data - the current month's closing inventory is next month's opening inventory. This is why operators moving to weekly or fortnightly spot-checks on high-value items see their COGS variance narrow even before changing any operational process. More frequent counting does not reduce waste or improve portions - it reduces the measurement error that hides the real number.
In Supy, stocktake data feeds directly into the COGS calculation. The system flags unusual count movements - a sudden 40% increase in closing stock for an item with stable consumption patterns, for example - before the number gets baked into the P&L.
COGS vs Food Cost Percentage: When to Use Each
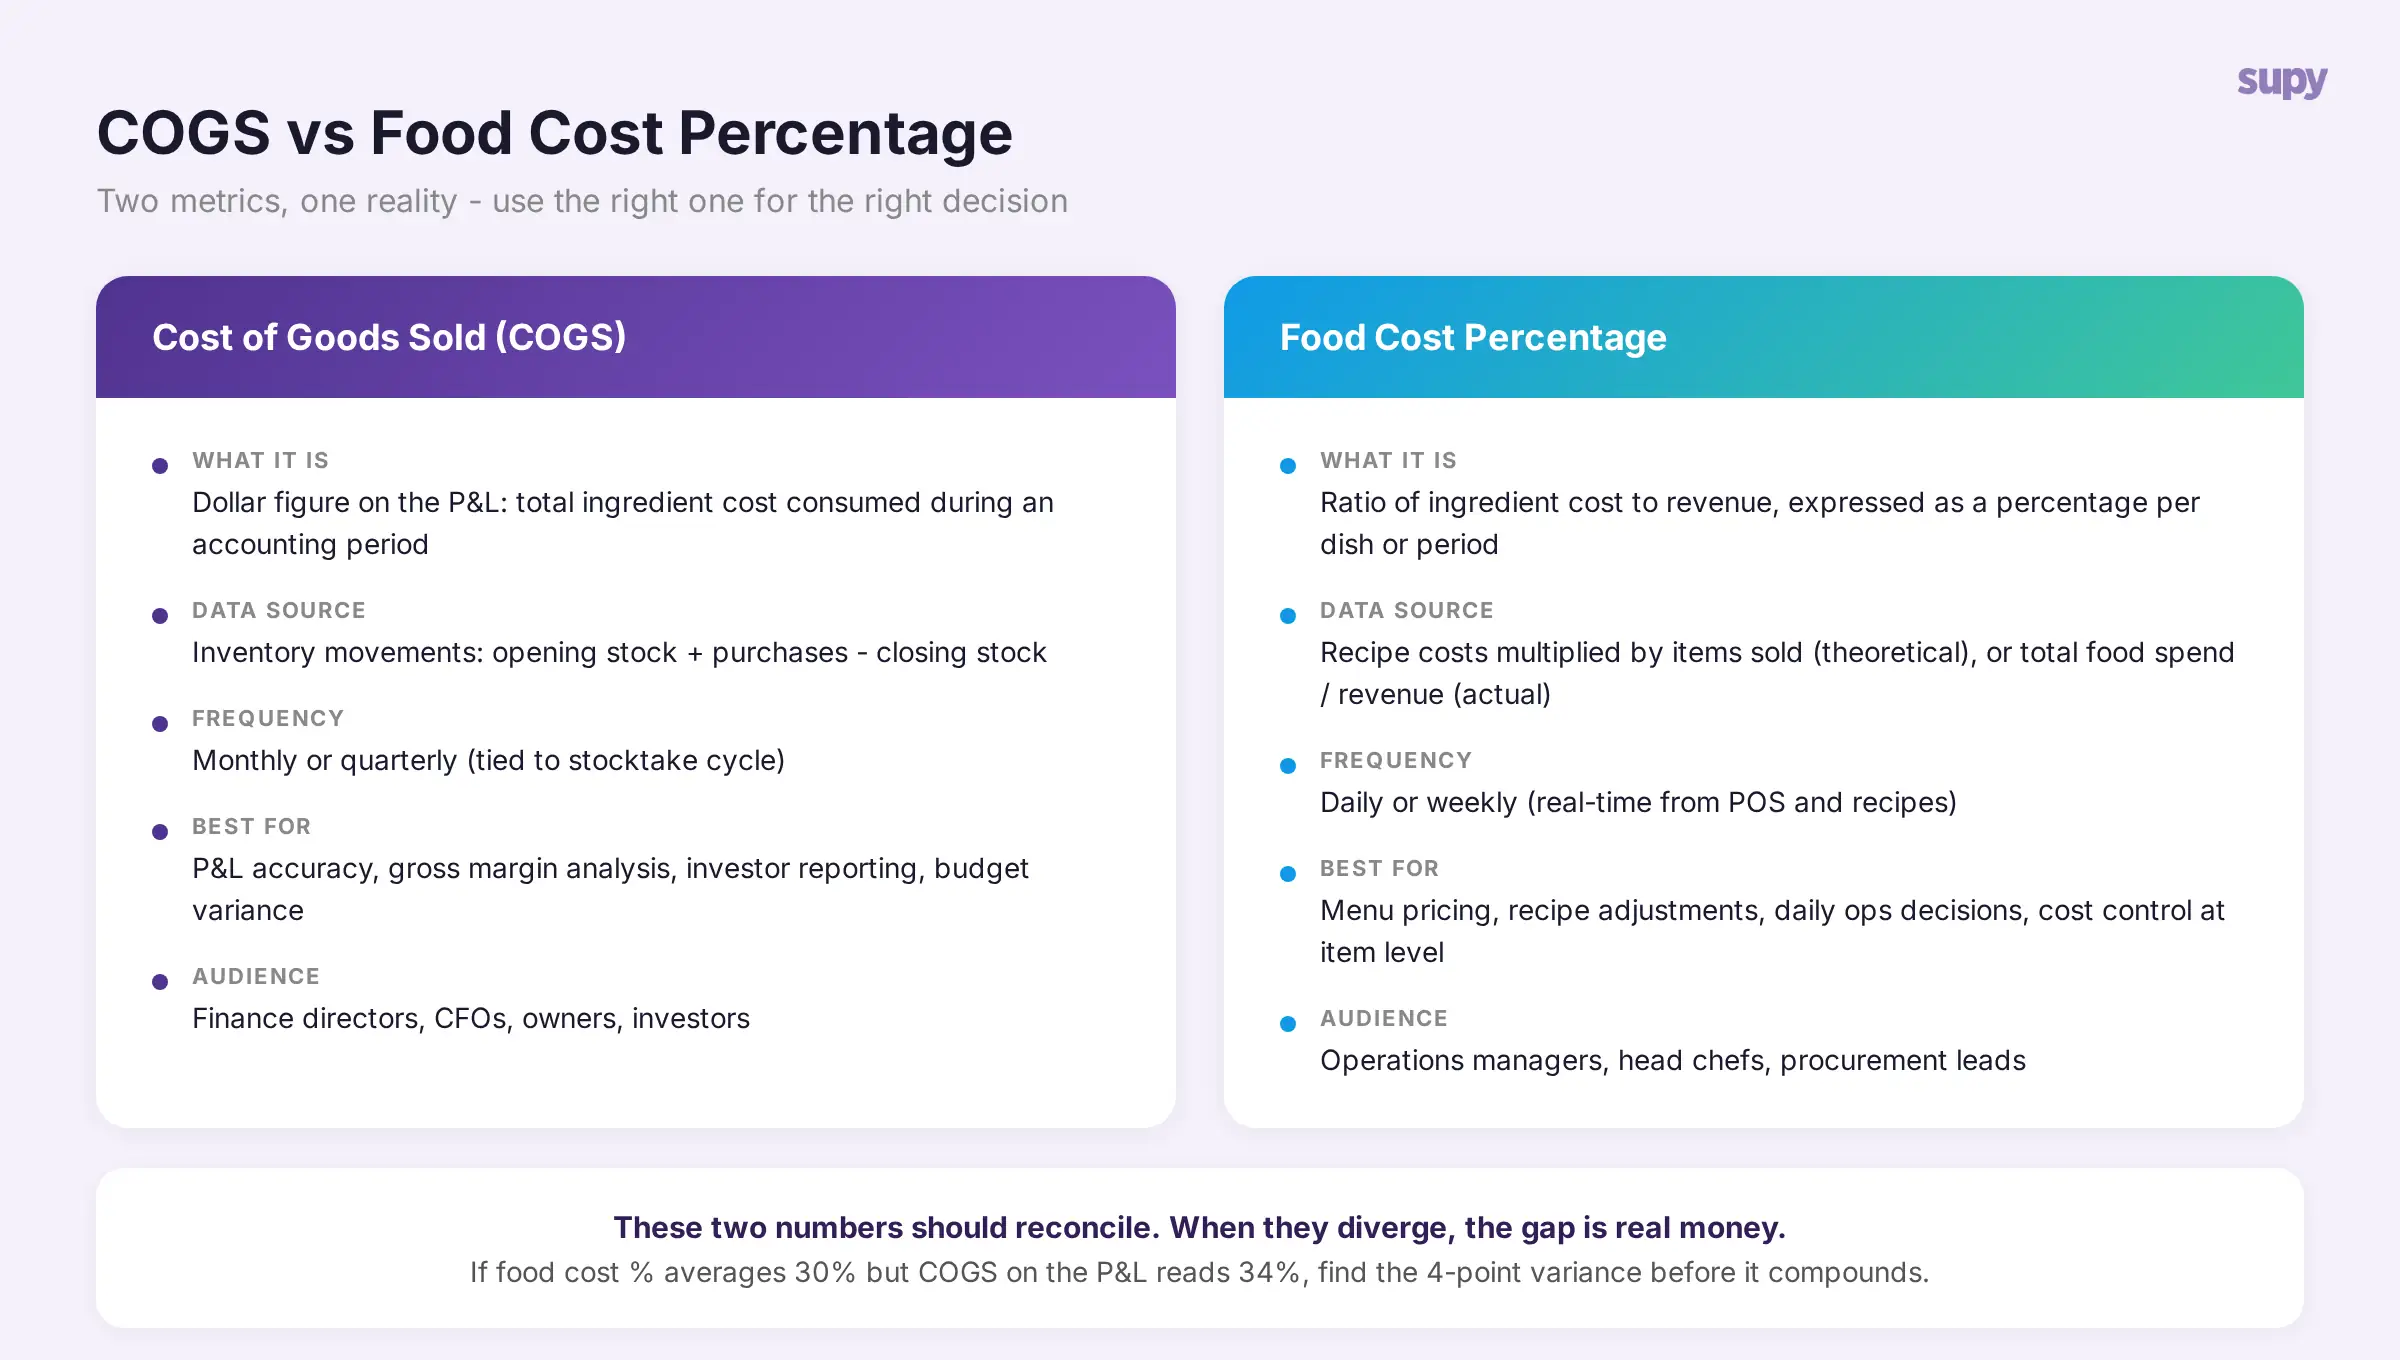
These two metrics describe the same underlying reality from different angles. Food cost percentage is the operational ratio - it tells the kitchen team how much of each dollar of revenue is going to ingredients. COGS is the P&L line - it tells finance how much was spent on ingredients in total during an accounting period.
Use food cost percentage for daily and weekly operational decisions: menu pricing, recipe adjustments, strategies to reduce restaurant food costs at the item level.
Use COGS for monthly and quarterly financial reporting: P&L accuracy, gross margin analysis, investor reporting, budget variance.
The two should reconcile. If your daily food cost percentage averages 30% across the month but your P&L shows COGS at 34%, the 4-point gap is real money. The reconciliation exercise - matching theoretical cost from recipes against actual cost from inventory movements - is where operators find the variance that matters.
Common Mistakes in Restaurant COGS Calculation
Excluding beverage costs. COGS should include all consumable ingredients - food, beverages, and any other items that are consumed in the production of what you sell. Operators who track food COGS and beverage COGS separately for management reporting still need a combined figure for the P&L.
Counting opening inventory at purchase price, closing inventory at current price. Consistency in valuation method - whether FIFO, weighted average, or most-recent-cost - is essential. Mixing methods within a single period produces a COGS number that reflects your valuation methodology more than your actual consumption.
Ignoring inter-site transfers. For multi-location operators, stock transferred between sites is not a purchase and not a sale. It is a lateral movement that must be excluded from the purchasing figure and handled as an internal transfer in both the sending and receiving site's inventory. Operators who do not track transfers separately will overcount purchases at the receiving site and undercount closing inventory at the sending site.
Running COGS monthly when the business moves weekly. A monthly COGS figure is an average of four weeks of operational reality. For a seasonal business or a group running promotions, the monthly average can mask a problem week that would have been caught with weekly COGS tracking. The operators achieving the tightest variance calculate COGS weekly for their top-20 ingredients by cost, even if the full stocktake runs monthly.
About Supy
Supy is the back-of-house operations platform built for multi-location restaurant groups. The platform connects procurement, inventory management, recipe costing, and business intelligence into a single system - giving finance and operations teams a live view of COGS that reconciles theoretical cost from recipes against actual cost from invoices and stocktakes. When a supplier price changes, every recipe updates. When a stocktake completes, the variance surfaces immediately. The result is COGS visibility that moves at the speed of the operation, not the speed of month-end accounting.
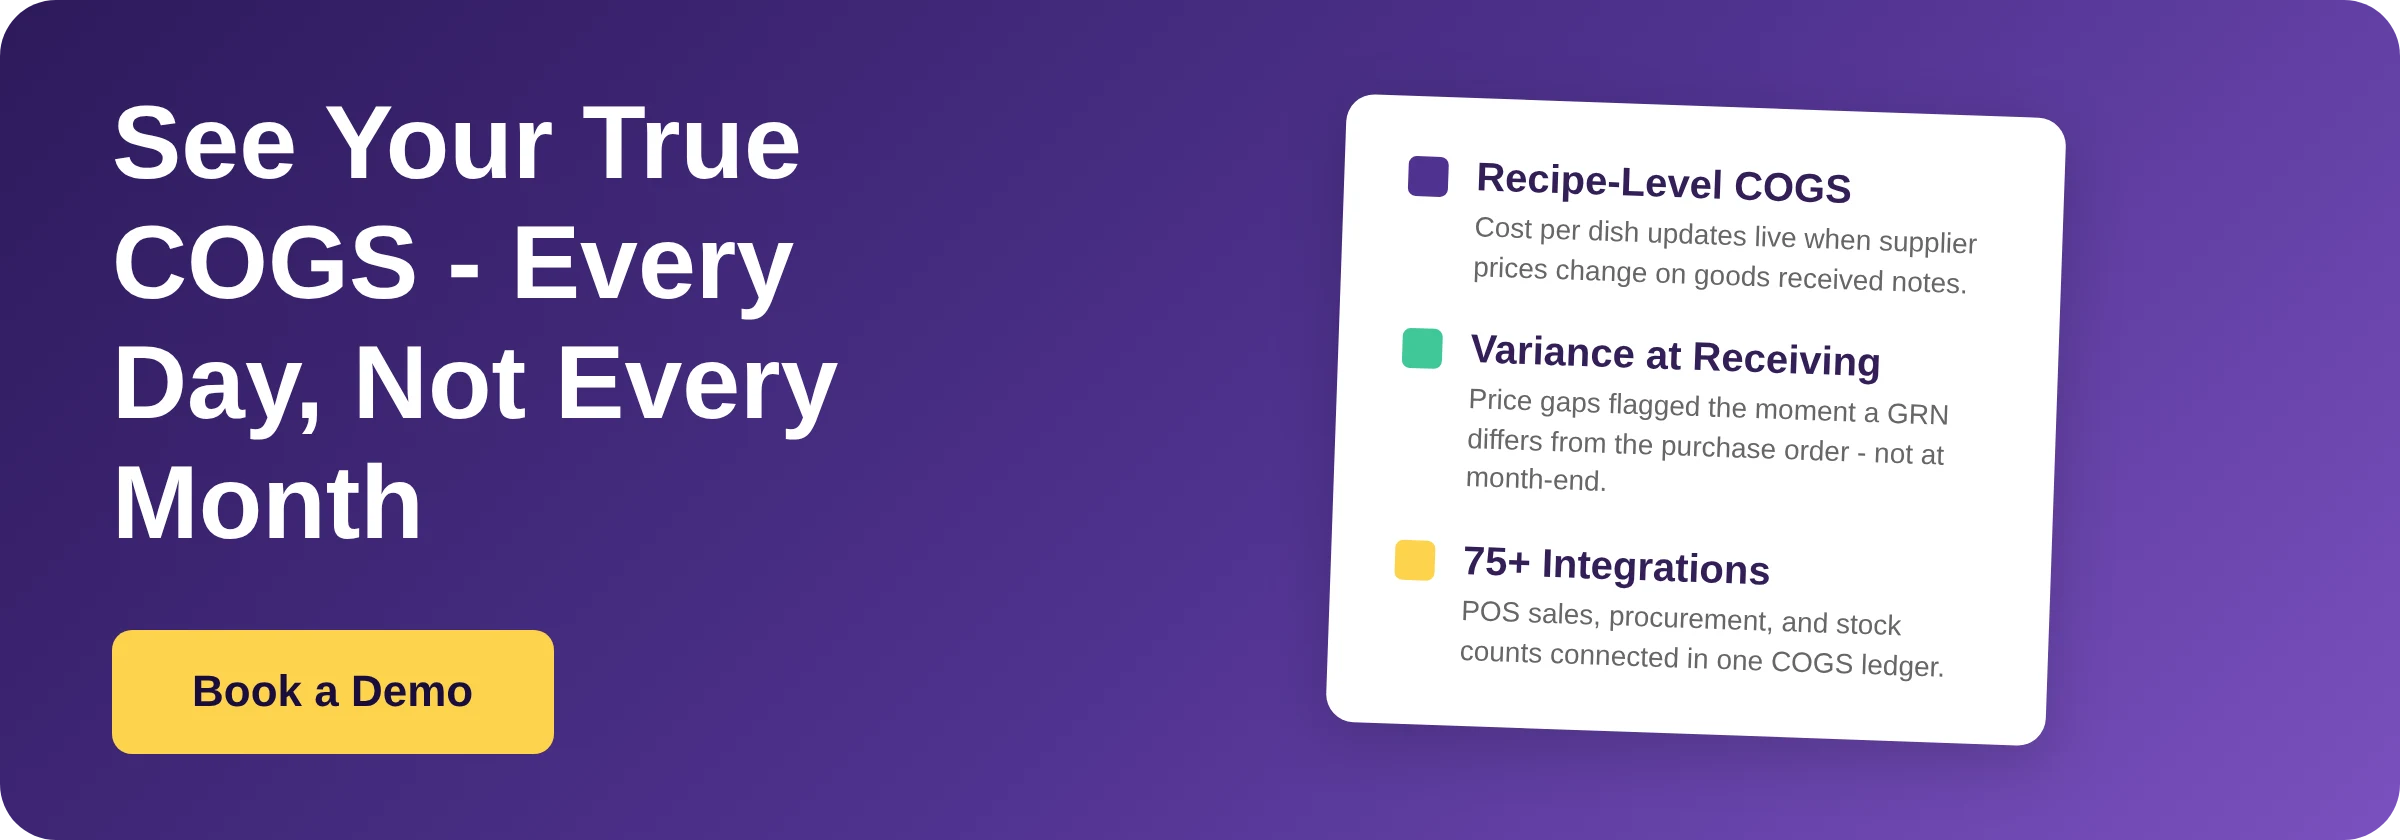
See how Supy keeps your COGS live against real purchase prices - book a demo