.jpg)


Restaurant Stock Counts: When a Spreadsheet Stops Keeping Up
Where a Spreadsheet Still Keeps Up
A spreadsheet can work for a restaurant stock count when one person counts one location on a stable menu: a single site, a fixed shelf order, and the period-end cost read off the same sheet. At that scale its flexibility is a genuine strength and dedicated software is overkill. The strain only starts when any one of those conditions stops being true.
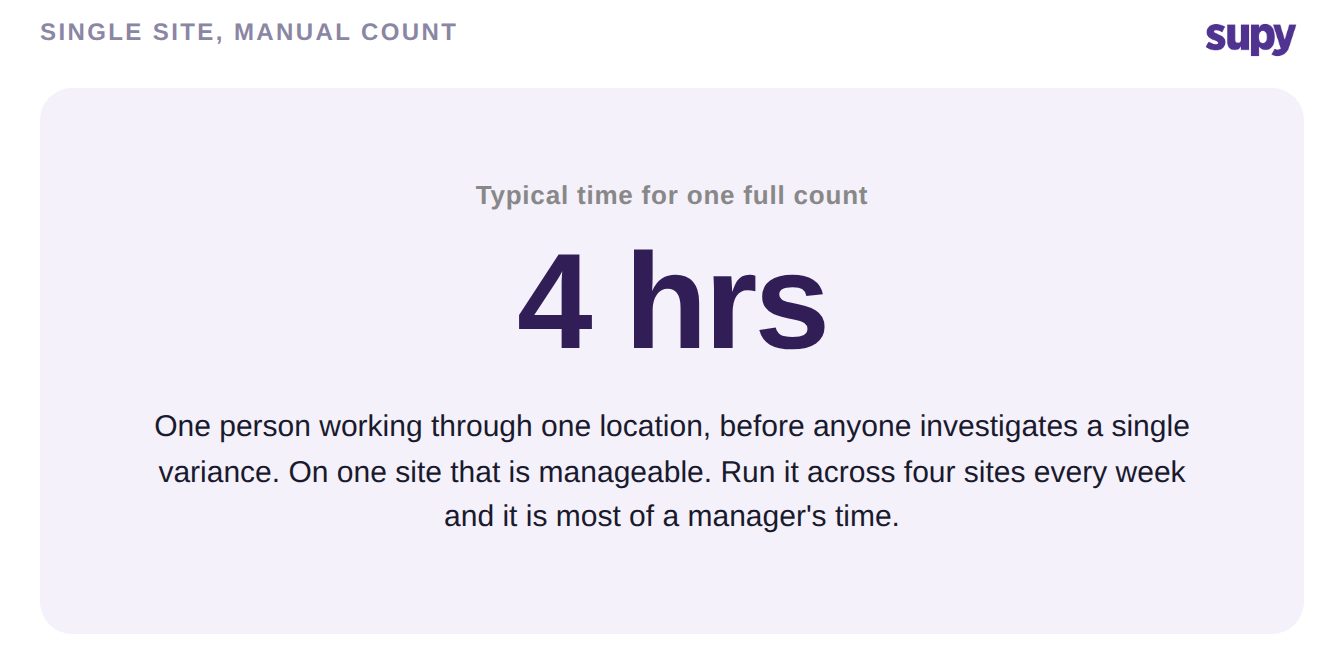
Even then, a single full count is real work. On one site it commonly takes around four hours of one person's day before anyone starts chasing a discrepancy, and longer when staff write counts on paper and re-key them afterwards. That is manageable for one location. The question this comparison answers is what specifically breaks once you are running counts like this across several sites, and where a spreadsheet quietly starts to cost you more than it saves. If you are weighing the move in full, our guide to restaurant stock management software covers the wider picture.
Spreadsheet vs Software, Count by Count
The honest way to compare the two is not feature by feature but job by job: take the things a stock count actually has to do across sites, and see how each option handles them. The pattern is consistent. A spreadsheet is flexible but passive, so it depends on everyone remembering to do the right thing; dedicated stock counting software enforces the structure that a multi-site count needs.
| The job | Spreadsheet | Inventory software |
|---|---|---|
| Several people counting one site | Collide on one file | Split into locked sub-counts that auto-merge |
| Shelf-order list per outlet | One sheet, edited by hand per site | Saved per outlet, picked at count time |
| Starting (theoretical) stock | Typed in, goes stale between counts | Kept current from every delivery and recipe sale |
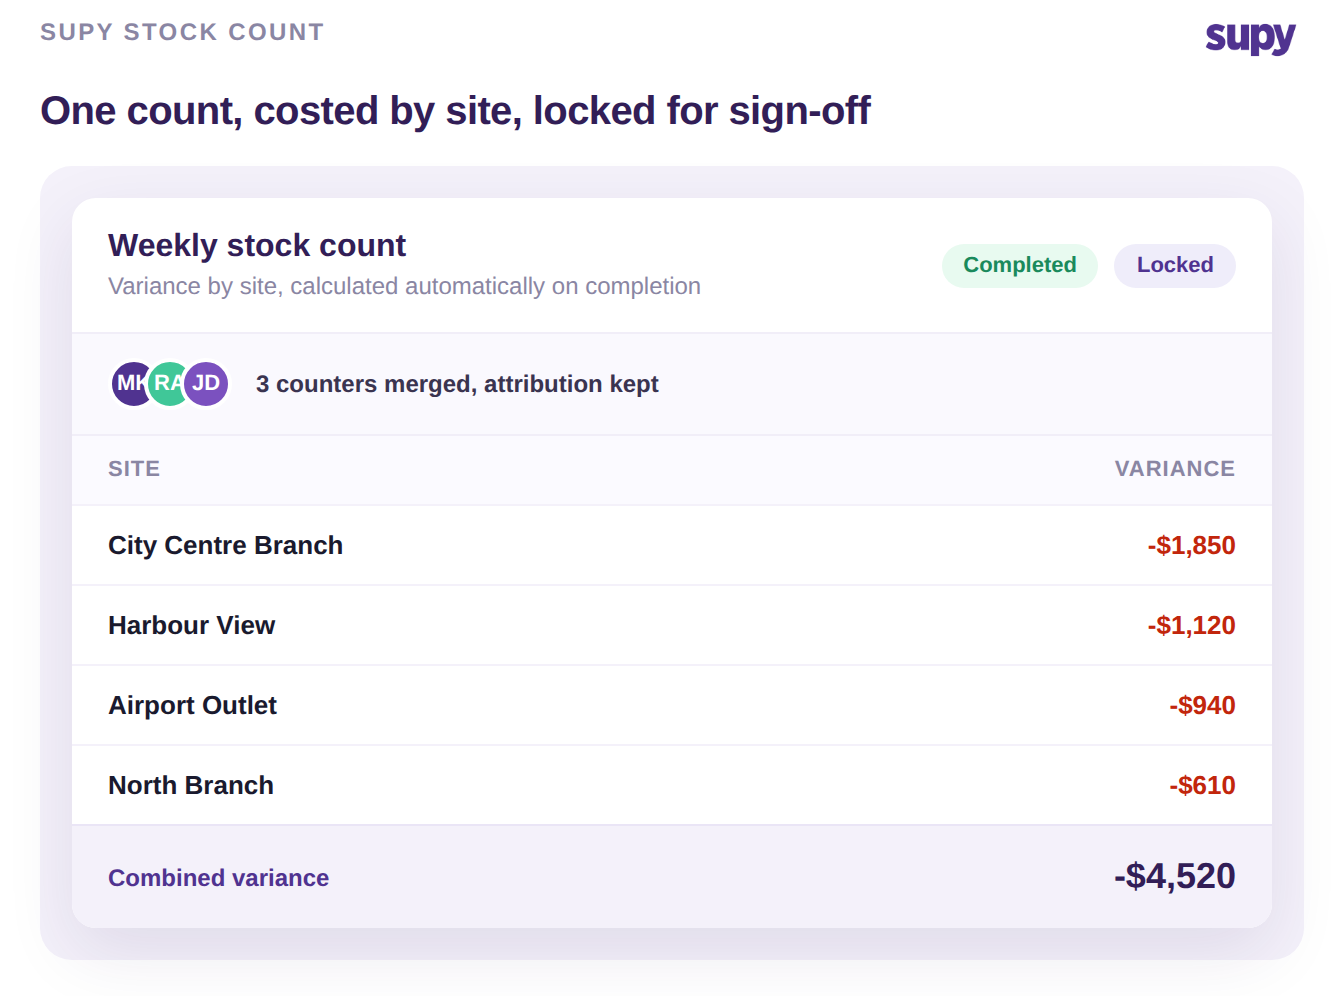
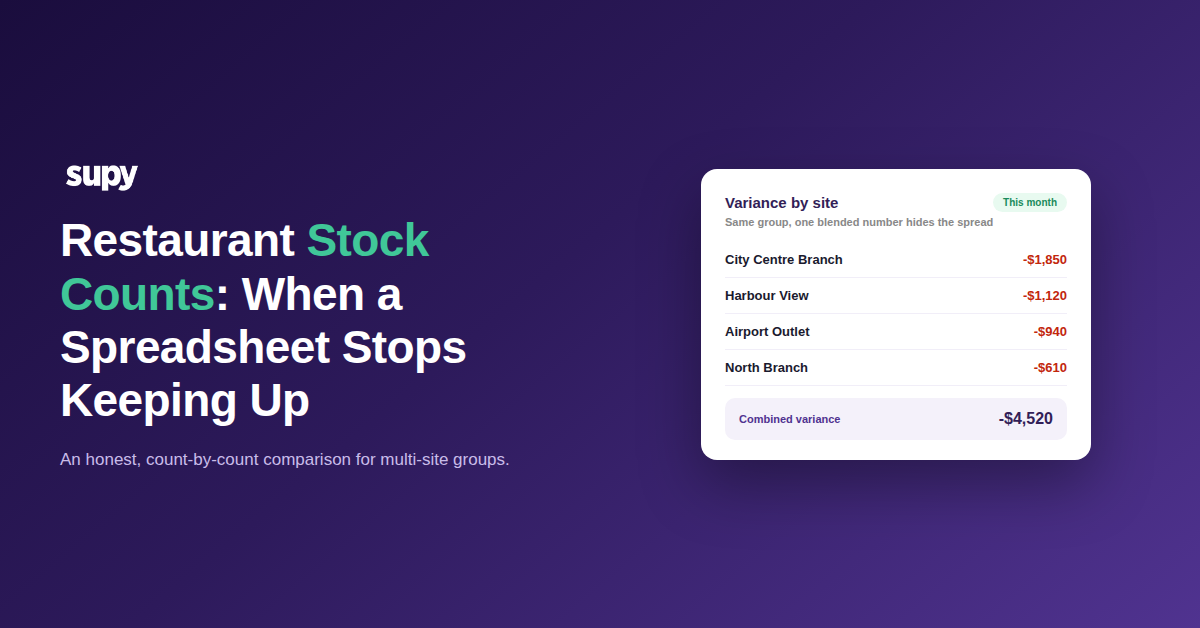
| Variance in money, per site | Re-keyed into a second sheet | Costed per item and per site on completion |
| Locking a count during a dispute | Anyone can edit the cells | Locks after completion, with an audit trail |
| Stock moving between sites | Manual entry at both ends | Recorded once, confirmed at the receiving site |
Why Multi-Site Variance Stops Adding Up
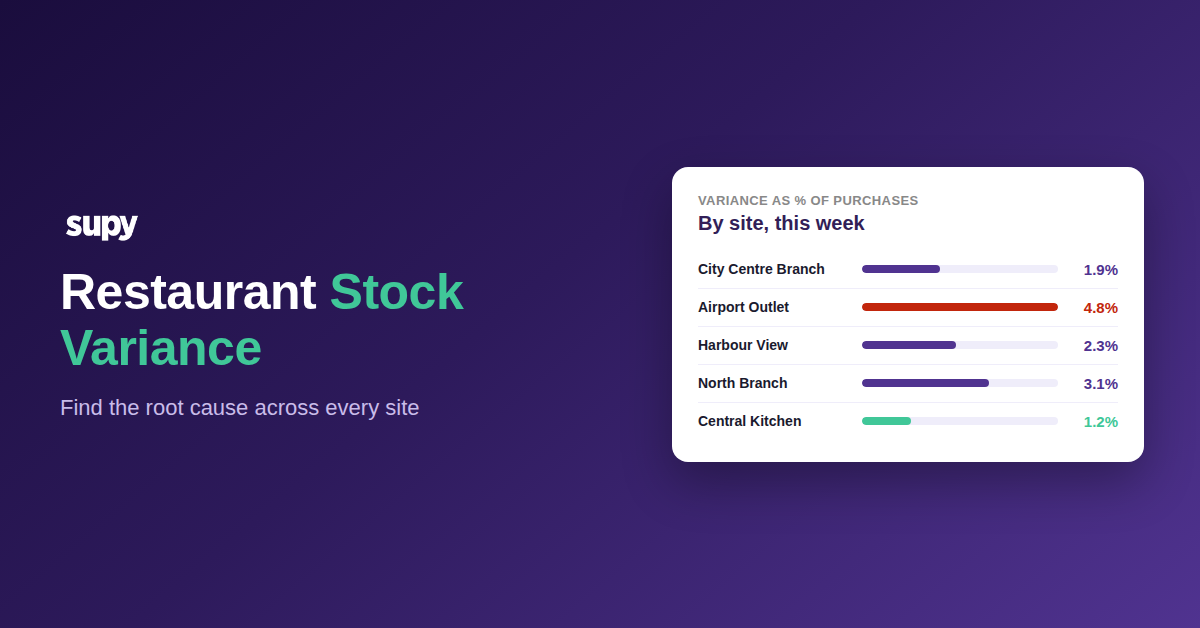
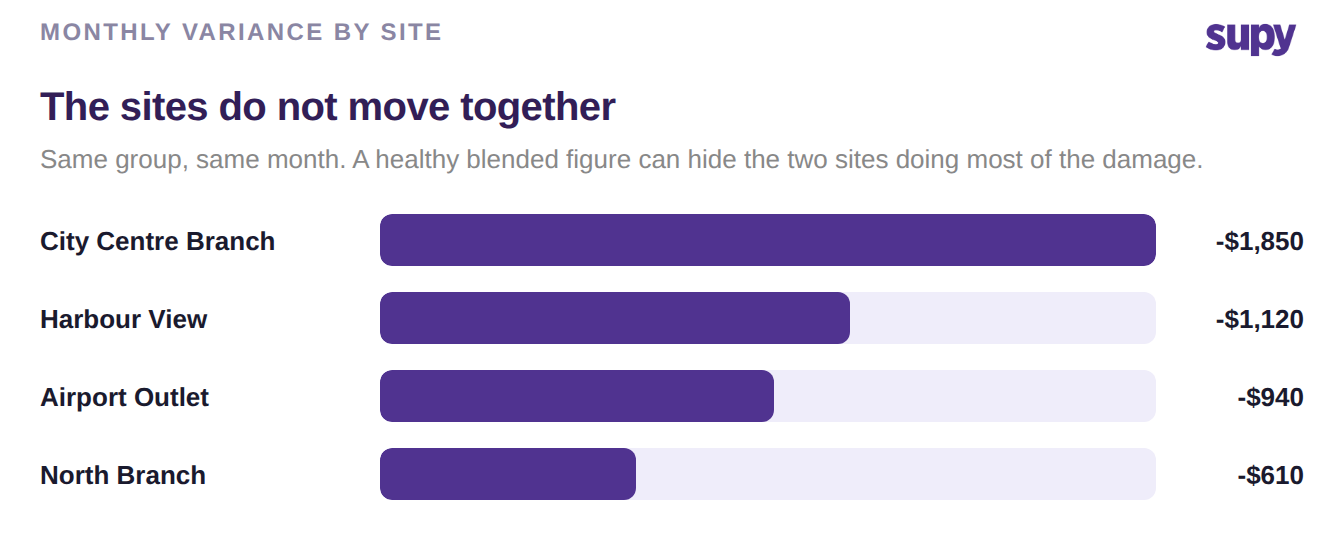
On one site, a spreadsheet variance is easy enough to read. Across a group, the numbers stop cancelling out in ways a sheet cannot explain, because a spreadsheet cannot enforce that every transfer, wastage and delivery is actually logged. Variance then becomes a mix of real loss and missing paperwork, and no one can separate the two.
One multi-branch group ran two counts a month apart and found a net variance in the tens of thousands of units. Tracing it showed the swings were not lost stock at all: sales had been recorded with no matching purchase, and a recipe quantity had been changed without backdating, so months of sales had been depleting the wrong amount. Another operator found their theoretical cost report and their actual margin telling two different stories until they bounded the calculation strictly between two count dates. The lesson is structural, not a matter of counting more carefully: theoretical stock is only trustworthy when it is kept current from every delivery and every recipe sale, and variance is only trustworthy when it is bounded by two real counts. A spreadsheet can do neither on its own.
The Tipping Point: Which One You Have Outgrown
Two things decide which side of the line you are on: how many sites you count, and how much your stock actually moves and changes. One site with a stable menu and a single counter sits comfortably in spreadsheet territory. Add sites, transfers between them, more than one counter, or frequent recipe changes, and you cross into the zone where the real cost is not a software fee but the untraceable variance and the manager hours you are already paying.
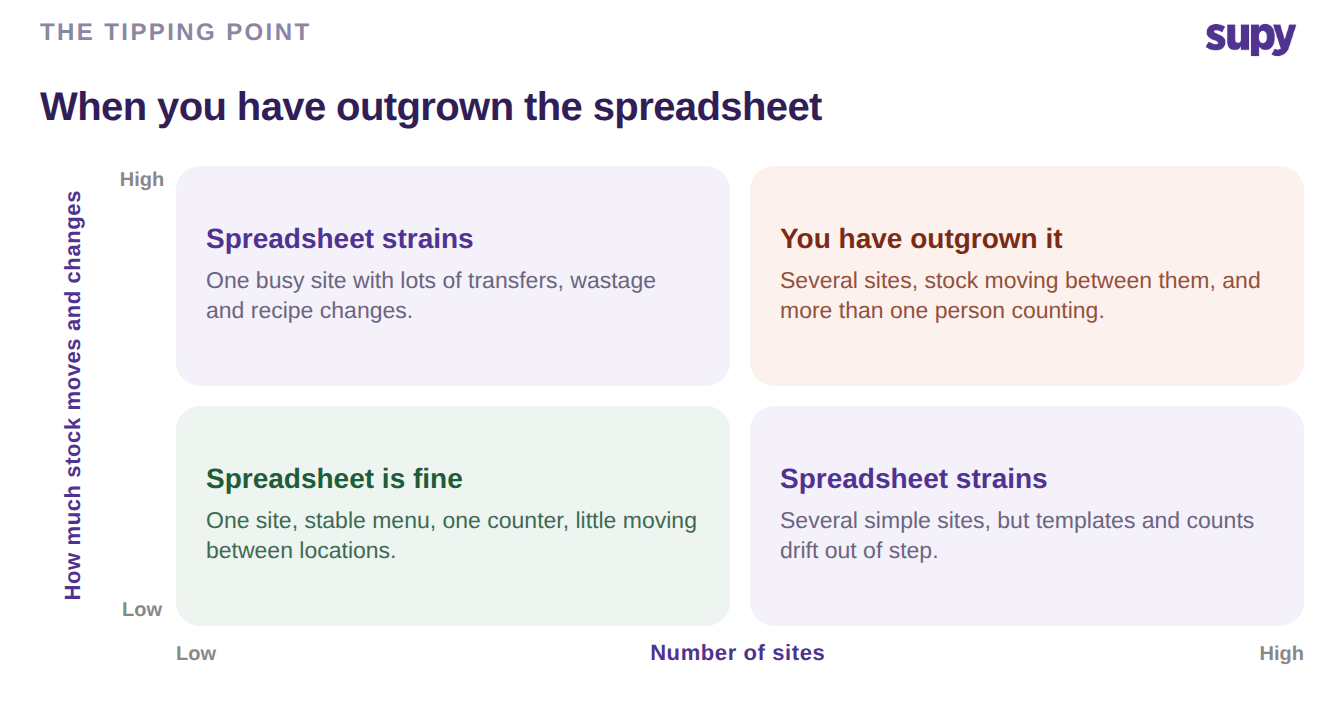
So keep the spreadsheet when you run one site, count to a fixed shelf order, and little moves between locations: it is cheaper and faster than anything you would replace it with. Move to inventory software when you are counting across sites, several people count at once, stock moves between locations, or your recipes change often enough that a typed-in starting number is stale by the next count. The simplest tell is your variance report: if it needs a second spreadsheet to explain it, you have already outgrown the first one. The first move is not to buy anything. It is to pick your most variance-prone site and check whether every transfer, wastage and delivery there is actually being logged, because that is the gap software closes. If you want to put a number on it before switching, an ROI calculator turns those manager hours and that untraceable variance into a figure you can weigh against the cost.
How Supy Makes Multi-Site Stock Counts Easy
None of this makes a spreadsheet wrong for the operator it still suits. It is a plain account of the jobs a multi-site count actually has to do, and how Supy stock counting handles each one, so you can see exactly which gaps close when you switch.
- Several people count one site at once. Where a spreadsheet has everyone colliding on one file, a single count splits into sub-counts so different people take different sections of the same location at the same time. Each person locks their own section while they work, the sub-counts merge automatically when they finish, and the record keeps who counted what.
- Every outlet keeps its own count sheet. Instead of one master sheet edited by hand for each site, count templates are saved per outlet, so each location counts in its own shelf order. Old templates can be archived when a menu changes.
- Your expected stock is always current. A typed-in starting number goes stale between counts. Theoretical stock is kept up to date from every delivery received and every recipe sold, so each count is measured against real expected usage. For kitchens using semi-finished prep, production is tracked automatically when stock runs negative, so that movement is not lost either.
- Variance is worked out for you, per item. Rather than re-keying counts into a second sheet, variance is calculated against expected quantities automatically and shown per item on web and mobile, with a summary total for the whole count.
- You see the cost, not just the units. On completion, each count captures the latest recipe cost for that location and date, so the variance report shows food-cost impact per site and a consolidated picture across the group, rather than one blended number that hides the sites doing the damage.
- Counts hold still while you investigate. A completed count can be locked so the figures cannot drift while ops or finance look into a discrepancy before sign-off, with a full audit trail behind every entry.
That is the difference the earlier sections point to: not that a spreadsheet fails at counting, but that a multi-site group needs every count structured, costed and traceable by default, which is the part a passive sheet cannot do for you.