.jpg)


Restaurant Stock Management Software: A Complete Guide for Multi-Location Operators
Most restaurant groups run stock management on spreadsheets or the stock module buried inside their POS. They discover the problem at month end, when the numbers do not reconcile and no one can explain why. The operators who avoid that conversation have stopped treating stock management as a counting exercise and started treating it as a system - one that connects every stock movement to a purchase order, a recipe, and a variance threshold. This guide covers what restaurant stock management software actually does, where most multi-location groups go wrong in their evaluation, and what to look for if you are buying. If you are new to the practice, restaurant inventory management is the broader operational discipline this software is designed to systematise.
Quick answer: Restaurant stock management software tracks stock in real time across all locations, connects stock counts to purchase orders and recipe costs, flags variances against expected usage, and manages stock transfers between sites. Purpose-built platforms differ from POS stock modules in one key way: they tell you why stock changed, not just what you have. For multi-location operators, the most important capabilities are centralised visibility across all sites, inter-site stock transfer workflows, and location-level variance benchmarking.
What Does Restaurant Stock Management Software Do?
At its core, restaurant stock management software maintains a running record of every ingredient across every location - what came in from suppliers, what was issued to production, what was transferred between sites, and what the counted stock says you have left. That picture updates with every purchase order received and every stock count completed, so your team is never working from week-old data.
The category covers three distinct workflows that most operations teams run in parallel:
Stock counting: Scheduled and spot-count workflows where floor staff count ingredients against expected quantities using a mobile app. The system calculates the variance - the gap between what you should have based on purchases and usage, and what is actually on the shelf.
Stock transfers: When a central kitchen supplies branches, or when a location borrows ingredients from a neighbouring site to cover a shortage, those movements need to be logged and approved. Without a transfer workflow, your stock numbers across locations will never reconcile.
Par level and reorder management: Setting the optimal quantity to hold for each ingredient at each location, and triggering purchase orders when stock falls to the reorder point. This is where stock management connects directly to procurement.
For multi-location groups, getting this right means the difference between a finance director who has real-time COGS visibility and one who finds out at month end that three locations overspent by a combined $12,000 on proteins.
Stock Management vs Basic Inventory Tracking: Why the Distinction Matters
This is where most evaluations go wrong.
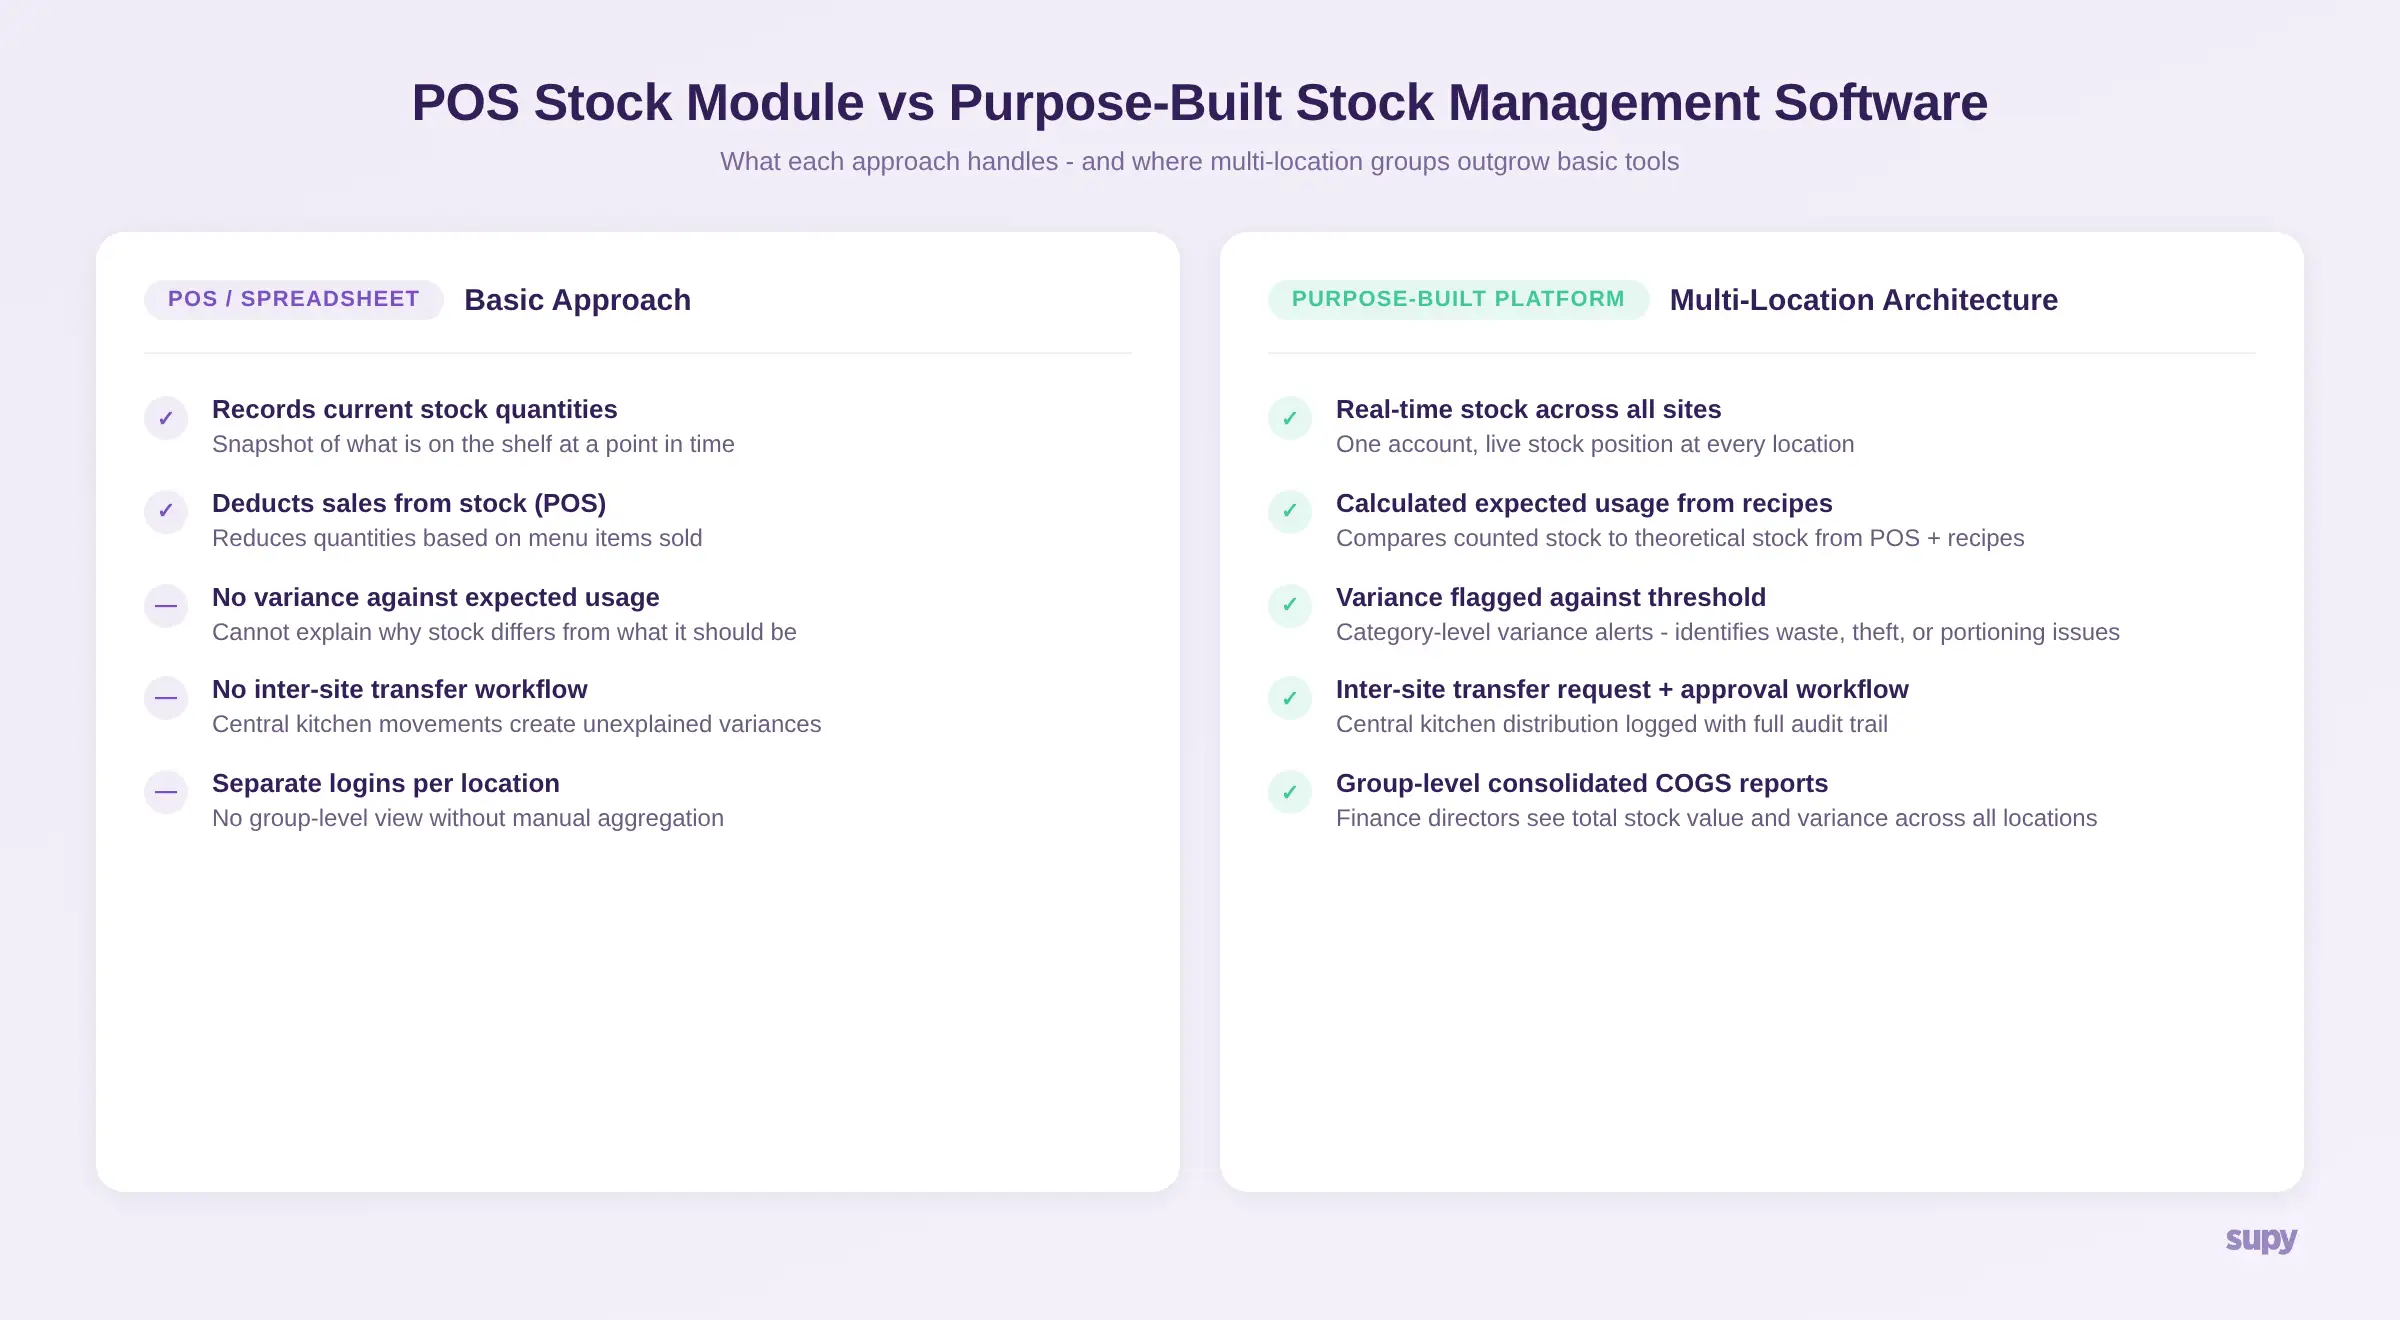
Basic inventory tracking - including the stock module on most POS systems - tells you what you have. Purpose-built stock management software tells you why your stock levels changed and whether the change is expected.
That distinction becomes critical at scale. A single-site operator running manual counts can investigate a discrepancy by walking the kitchen. A group with eight or fifteen locations cannot do that. They need a system that surfaces variance against expected usage automatically, and flags which locations are drifting outside acceptable thresholds before the damage compounds.
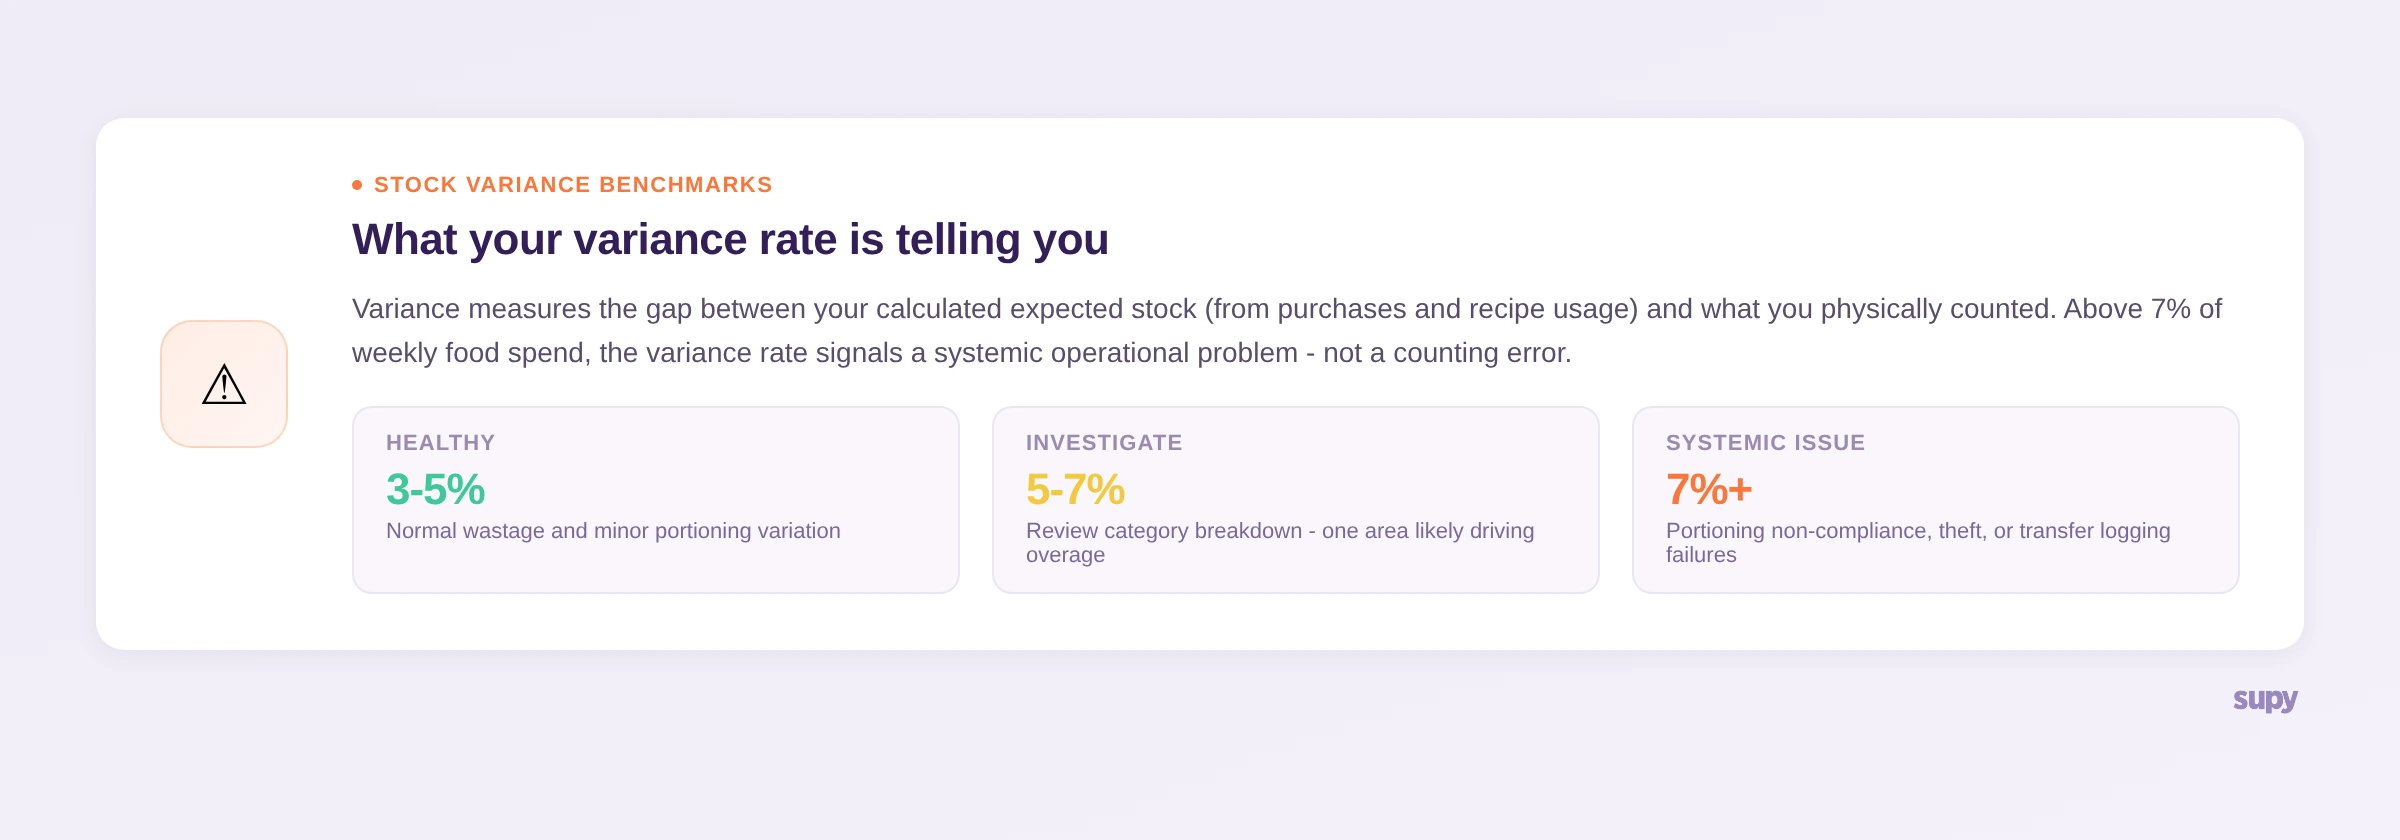
The second distinction is integration. A standalone counting tool captures what was physically on the shelf. A stock management platform connected to your purchasing and recipe data captures the full picture: what was ordered, what was received, what was issued per cover based on your recipe yields, and therefore what should be left. The gap between calculated and counted stock is your variance - and variance above 5-7% of weekly food spend is a signal that something systemic is wrong.
One common pattern across multi-site groups on the platform: operators who migrated from spreadsheet-based counting to integrated stock management discovered their true variance rate was significantly higher than their manual process suggested - because the manual process had no baseline to measure against.
Key Features for Multi-Location Restaurant Groups
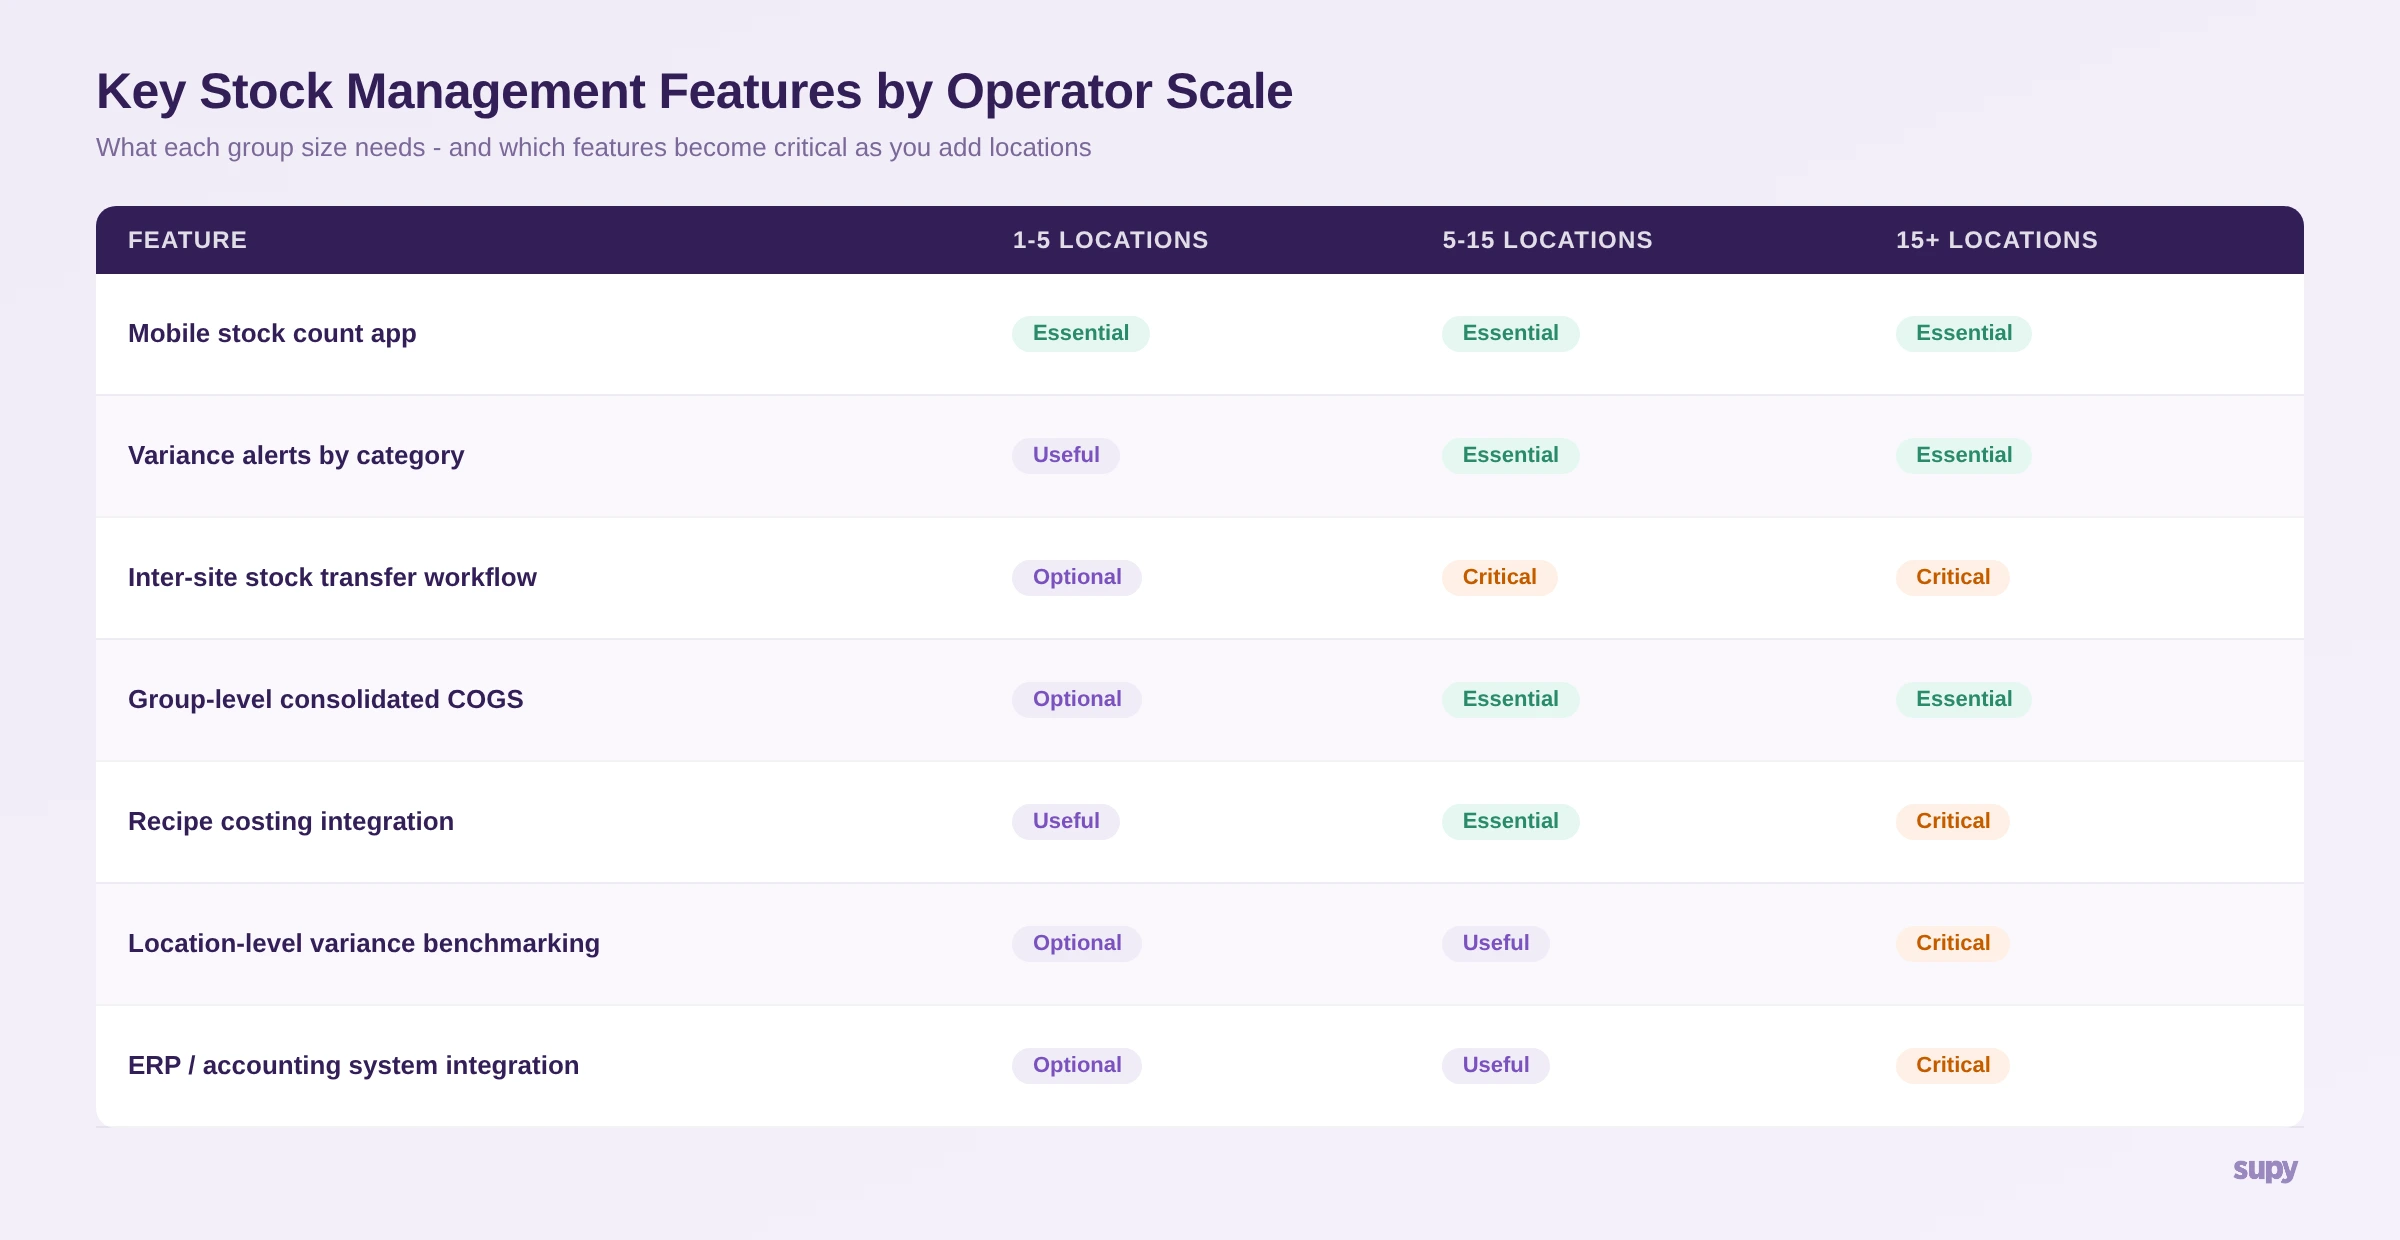
Not every stock management platform is built for groups operating multiple sites. Here is what separates purpose-built multi-location systems from tools that work well for one or two outlets but create problems at scale.
Centralised stock visibility across all sites
Your operations director should be able to see the current stock position at every location from a single dashboard - not by logging in and out of separate accounts for each site. This sounds basic, but it is a genuine operational gap in several mid-market platforms where each location exists as an isolated instance.
Across operators who have migrated to Supy from systems with per-location login requirements, this is consistently cited as the most immediately impactful change to daily operations workflows.
Inter-site stock transfer workflows
When your central kitchen distributes to branches, or when one location covers another during a supply shortfall, those movements need a formal approval and logging workflow. Without one, the distributing location shows a stock loss and the receiving location shows an unexplained gain - and both variances look like problems.
A well-designed transfer workflow captures the quantity sent, the quantity received (which may differ if items were damaged in transit), and the approval chain - giving your finance team a complete audit trail for inter-entity stock movements.
This came up directly in a recent evaluation call: an operations manager described their core requirement as needing "something that can help us understand and manage stock transfers between multiple stores." Without a dedicated transfer module, they were logging movements in a shared WhatsApp group.
Location-level variance benchmarking
At a single site, variance above threshold is a problem. Across a group, variance benchmarking becomes a management tool. Which locations consistently hit 2-3% variance? Which are running at 8-10%? Which have a specific category - proteins, dairy, spirits - that accounts for most of the discrepancy?
In Supy, variance reports segment by location, category, and ingredient, so your ops team can identify patterns rather than investigating every variance independently. A location running high variance on one ingredient category across multiple count periods is almost always a portioning or FIFO compliance issue - and that is a training conversation, not an investigation.
Mobile stock count app for on-floor teams
Stock counts completed on clipboards and transcribed into a system introduce transcription errors and delay. A mobile app lets floor staff count directly from their phone during a live count, with the system updating in real time as each item is logged. Barcode scanning - for operations with barcoded storage - reduces the time per count and the error rate simultaneously.
Consolidated stock reports for finance
Your finance director does not need to pull location reports separately and aggregate them manually. Stock management software should generate consolidated group-level stock reports - total stock value by category, variance by location, and COGS by site - that flow directly into a finance review without manual manipulation.
Common Mistakes When Evaluating Stock Management Software
Choosing the stock module inside your POS
POS stock modules are designed to track inventory depletion from sales - they know that a pizza order used 250g of dough and 80g of mozzarella. What they are not designed for is the procurement side: receiving against a purchase order, counting what is physically on the shelf, logging a stock transfer between sites, or flagging when counted stock deviates from calculated stock.
If your evaluation involves comparing a purpose-built stock management platform against the inventory add-on of your POS, you are comparing different categories of tool.
A useful reference point is the free restaurant inventory management template - if you are currently using something equivalent to that for stock management across multiple locations, a POS stock module is a modest improvement, but a purpose-built platform is a structural one.
Not accounting for inter-site stock transfers in the scope
Many groups scope their stock management evaluation around counting and ordering, and then discover after implementation that their central kitchen distribution is creating unexplained variances at branch level because the transfer workflow was not part of the original configuration.
Define your transfer volumes before you evaluate. How many inter-site transfers does each location process per week? Are they high-frequency small movements (daily mise en place from central kitchen) or lower-frequency bulk transfers? The answer determines what level of transfer workflow sophistication you need.
Overlooking variance threshold configuration
A stock management system that flags every variance is a system your team will stop trusting within a month.
The right configuration sets variance thresholds by ingredient category - accepting 3% on ambient goods but alerting on anything above 1.5% on premium proteins and spirits. If the software you are evaluating does not allow threshold configuration by category or location, your ops team will spend more time investigating false positives than genuine problems.
How to Evaluate Restaurant Stock Management Software
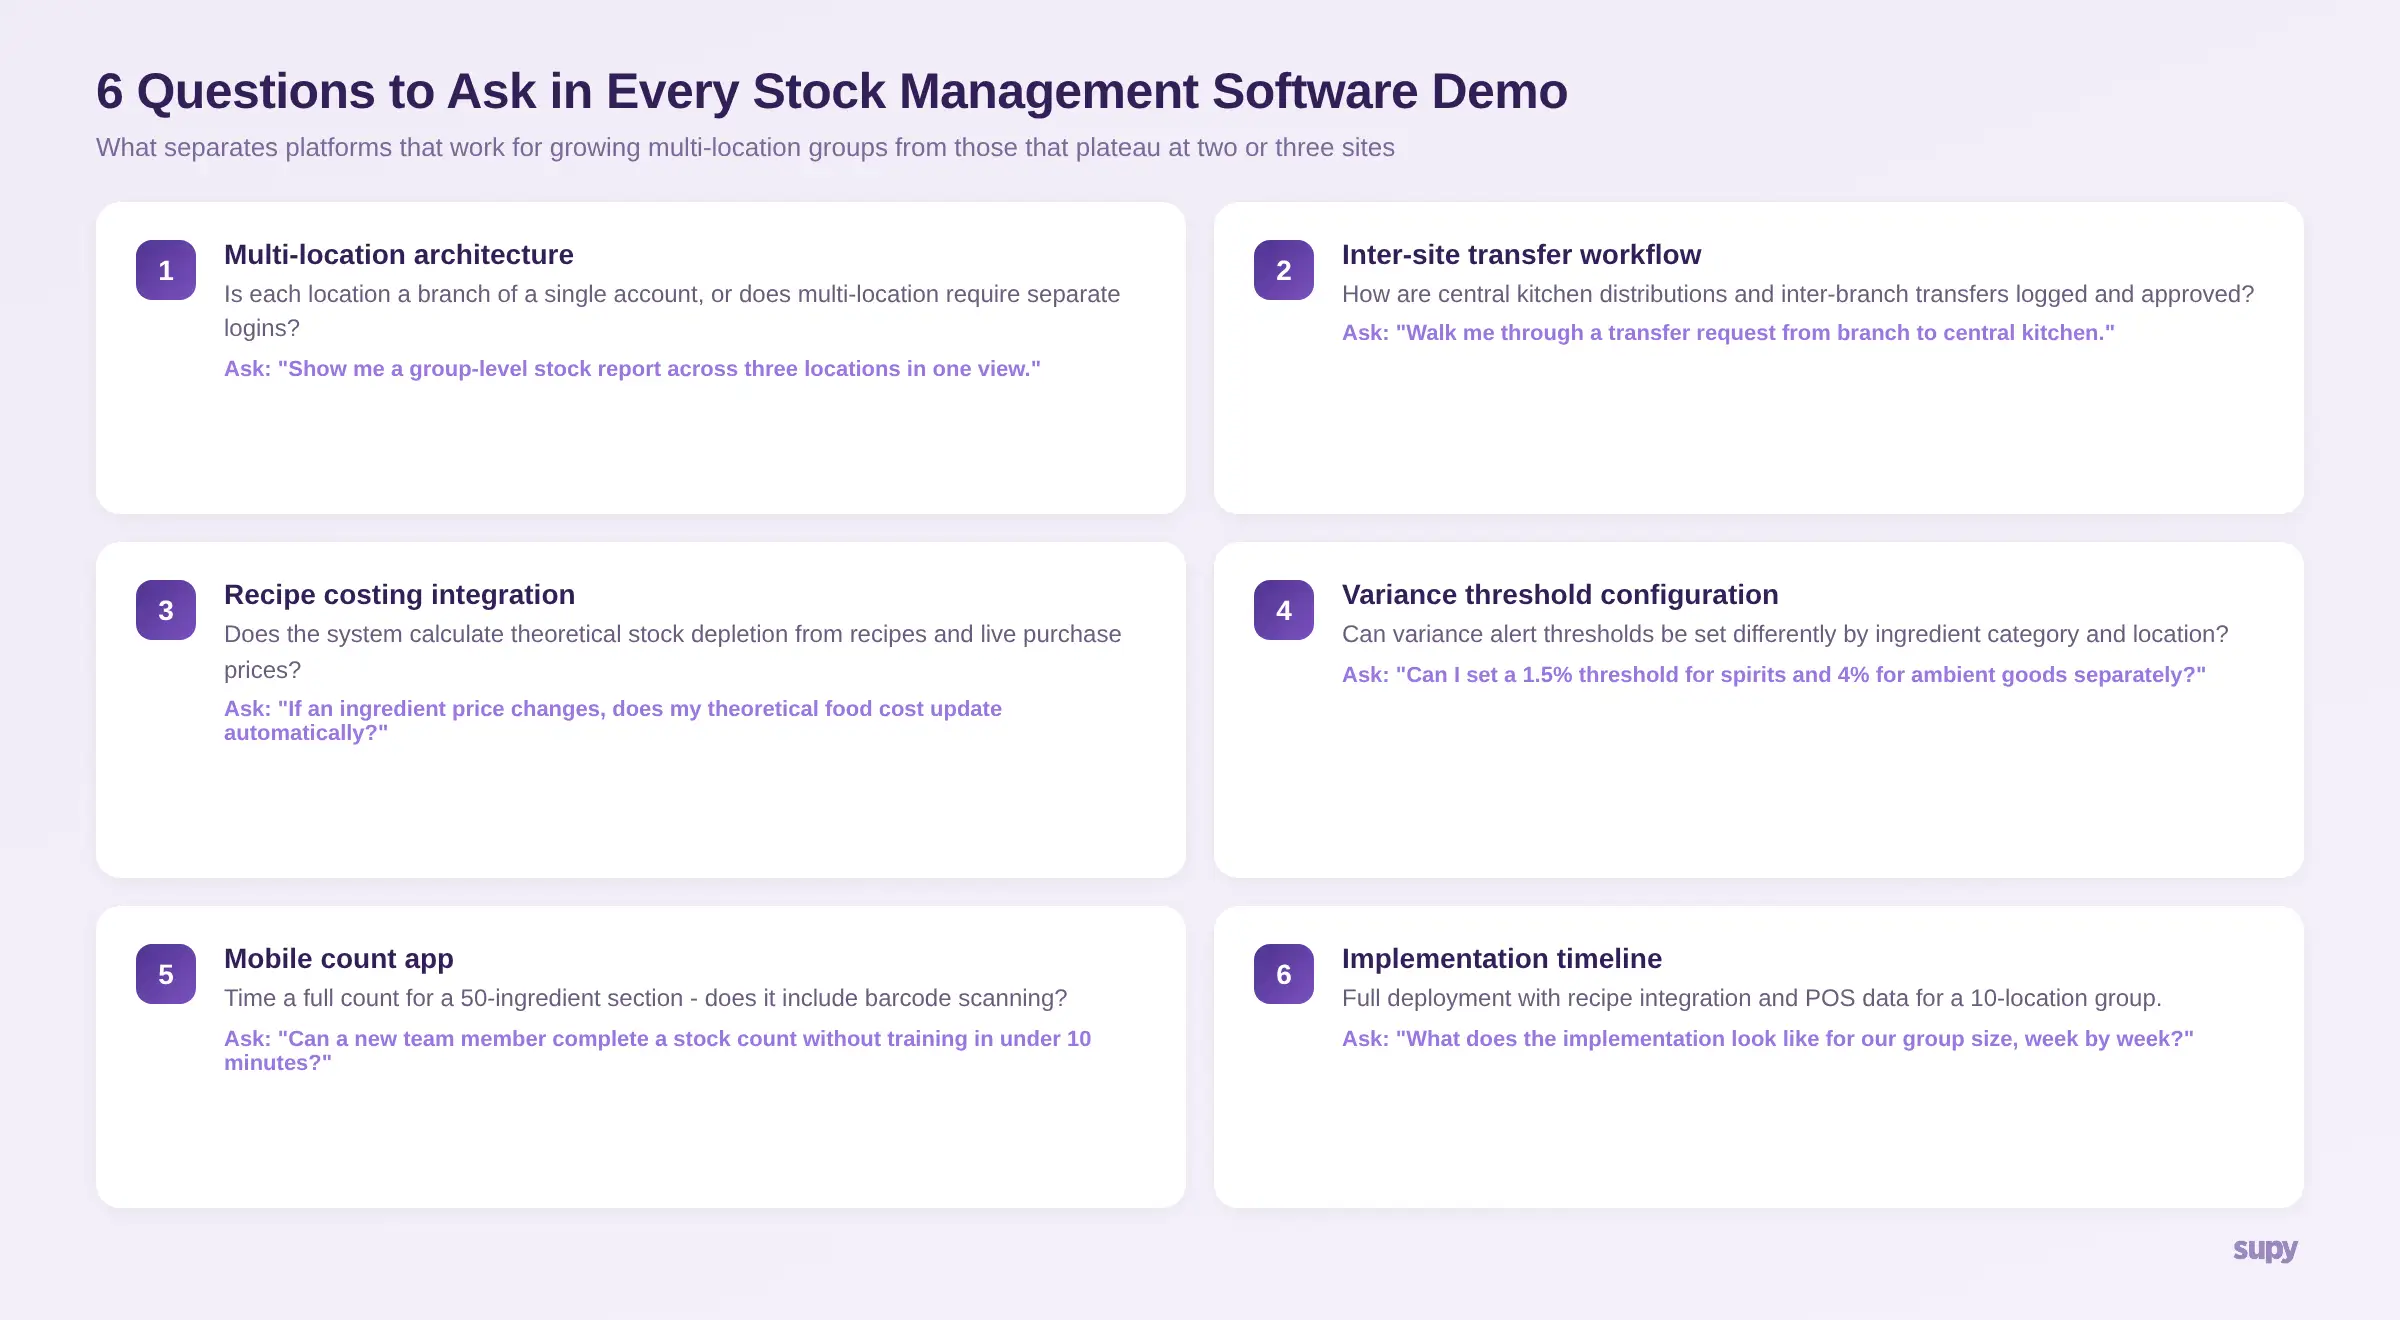
When you reach the shortlist stage of an evaluation, these are the criteria that consistently separate platforms that work well for growing groups from those that plateau at two or three locations.
Multi-location architecture: Is each location a true branch of a single account, or does multi-location require separate logins and manual aggregation? Ask to see a group-level stock report in the demo.
POS and ERP integrations: Your stock management platform needs to receive sales data from your POS (to calculate theoretical depletion against recipes) and push COGS data to your accounting system or ERP. Confirm the specific integration exists before you commit, not as a future roadmap item.
Recipe costing connection: Stock management without recipe cost integration tells you what you have but not what you should have. The platforms that deliver real food cost control connect live stock movements to live recipe costs - so when ingredient prices change, your theoretical food cost updates automatically.
Mobile count application: Request a demo of the mobile count workflow specifically. How long does it take a floor team member to complete a count for a 50-ingredient section? Is barcode scanning supported?
Implementation timeline: Complex multi-location deployments with inter-site transfer workflows and full recipe integration typically take 6-12 weeks to configure correctly. Be wary of quoted timelines under four weeks for groups with more than five locations - they usually mean the configuration is shallow.
For a comparison of evaluated platforms, best restaurant inventory management software covers the leading options across different group sizes and use cases.
How Supy Handles Stock Management Across Multi-Site Groups
Supy's stock management module is built around the assumption that most operators care about two things: knowing what they have at every location right now, and understanding why their stock position is different from what it should be.
Every stock count in Supy runs against a calculated expected quantity - derived from your opening stock, purchase orders received, and theoretical usage from your recipe and sales data. The variance shown is not a raw difference between two counts; it is the gap between calculated and counted stock, expressed as a percentage of weekly food spend by category.
Inter-site stock transfers have a dedicated approval workflow: the requesting location raises a transfer request, the distributing location approves and dispatches, and the receiving location confirms receipt. The transfer logs update both location stock positions automatically, and any quantity discrepancy between dispatched and received is flagged for investigation.
For finance teams, Supy generates group-level consolidated stock and COGS reports that pull across all locations without manual aggregation - giving a finance director the same visibility at group level that a site manager has at location level.
About Supy
Supy is a back-of-house operations platform for multi-location restaurant and hospitality groups. The platform connects stock management, purchasing, recipe costing, and business intelligence in a single system - so the numbers your ops team counts and the costs your finance team reports from the same underlying data. Groups across the UK, Europe, GCC, APAC, and North America use Supy to manage stock, purchasing, and COGS across between 3 and 200+ locations.