.jpg)


How to Attribute Waste and Stock Loss by Outlet in a Multi-Site Group
Attributing waste and stock loss to the outlet responsible is a setup problem, not a counting problem: if your reports only show a group total, no site manager can be asked to own a number they cannot see. This guide walks through five steps to make every shortage traceable to the outlet that caused it, from how your outlets are modelled to the weekly routine that keeps loss attributable.
Step 1: Check Whether You Can See Per-Outlet Numbers at All
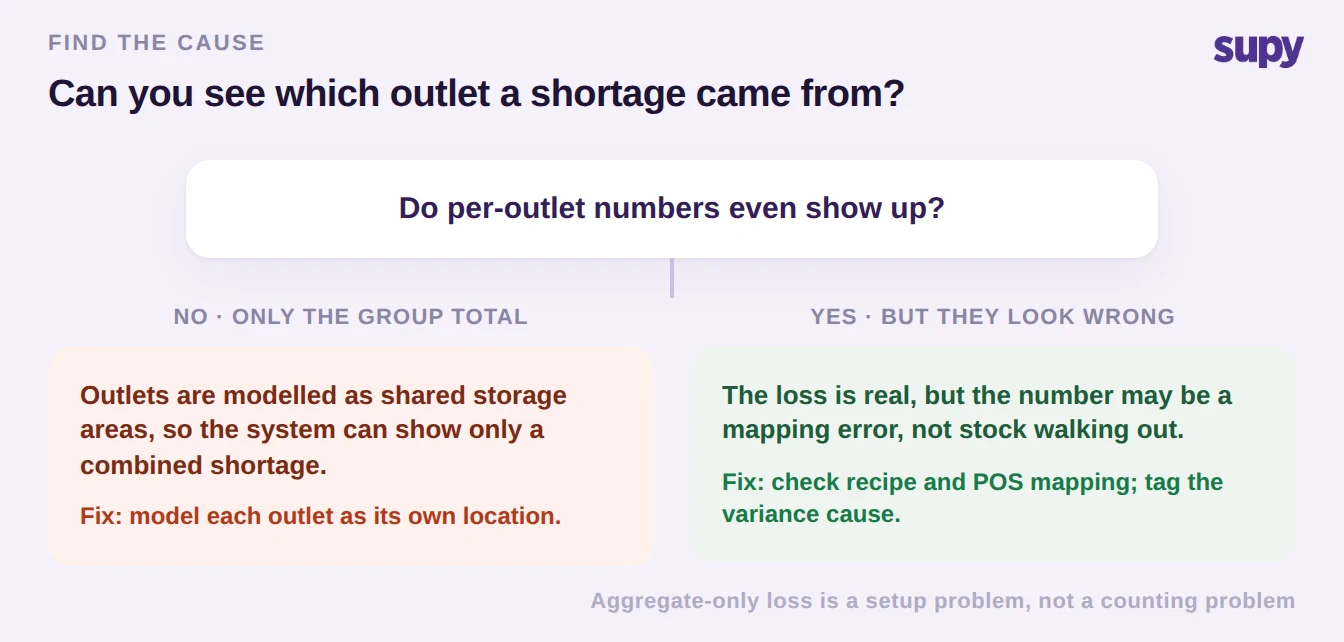
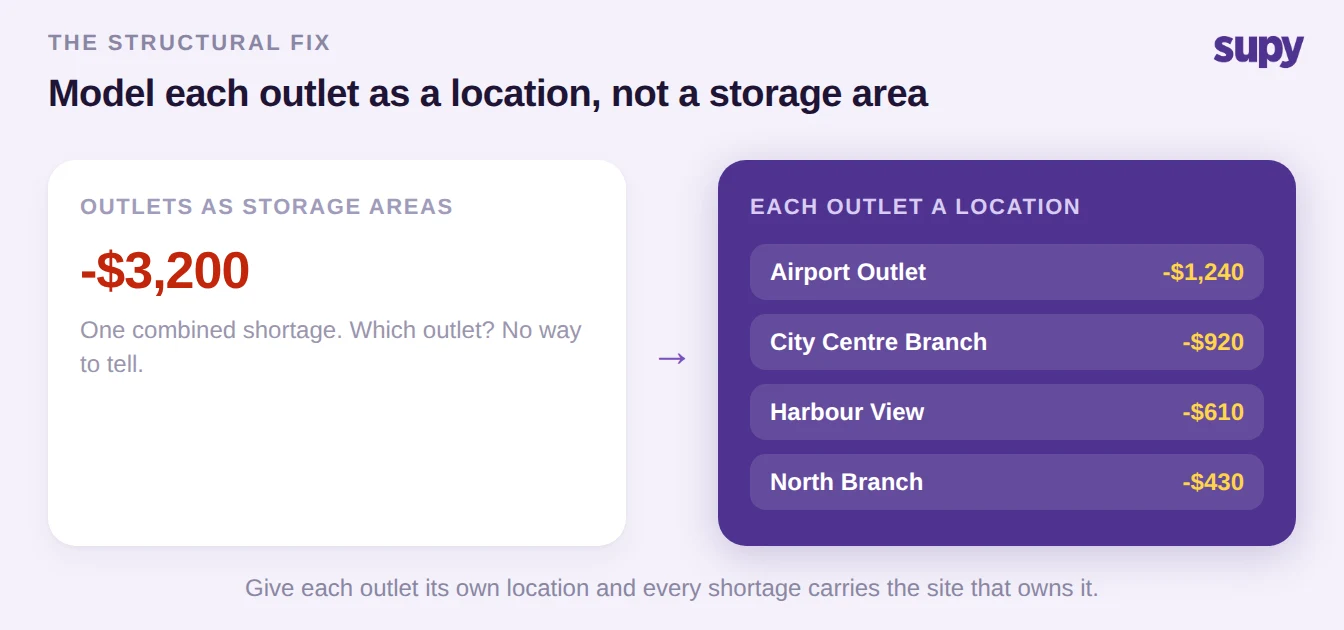
Aggregate-only loss usually means your outlets are modelled as shared storage areas under one location rather than as distinct outlets in their own right. When that is the case, the system can only show a combined shortage, because it was never told which four walls each item sat behind. The fix is structural, not a matter of counting harder: give each outlet its own location so every movement, count, and waste event carries an outlet stamp.
Work the branch that matches your report. If you cannot see per-outlet numbers at all, the model is the problem and Step 2 is where to start. If you can see per-outlet numbers but they look wrong, the loss is real and the question becomes what kind of loss it is, which Steps 3 and 4 break down.
Step 2: Model Each Outlet as a Location, Not a Storage Area
One multi-site catering group could not pinpoint waste or stock loss by outlet because its previous system treated roughly 18 internal sub-locations as storage areas under a single location. Every shortage showed up as a group figure, and inter-outlet movements had nowhere to live. Modelling each outlet as its own location fixes both at once: stock-on-hand, theoretical-versus-actual usage, and waste all resolve to the site that owns them.
Real-time stock is tracked by location, category, and storage unit, and theoretical stock stays continuously up to date from every goods-received note and recipe consumption, so per-site variance is measured accurately at the next count. Once outlets are distinct locations, a genuine movement between them becomes a transfer you can see rather than a shortage you cannot explain. A restaurant inventory management platform that resolves stock to the site is what makes per-outlet attribution possible in the first place.
Step 3: Record Waste by Reason and by Outlet
With outlets modelled correctly, waste stops being one number and becomes a table you can act on. Wastage is logged by item, quantity, reason, and type in seconds on mobile or desktop, each entry auto-deducts from stock and cost, and the cost impact is reported by branch, period, and category with a multi-site comparison. Recipe wastage decomposes to its individual ingredients and deducts each in proportion, so the cost lands on the ingredient and the outlet that recorded it, not on a group average.
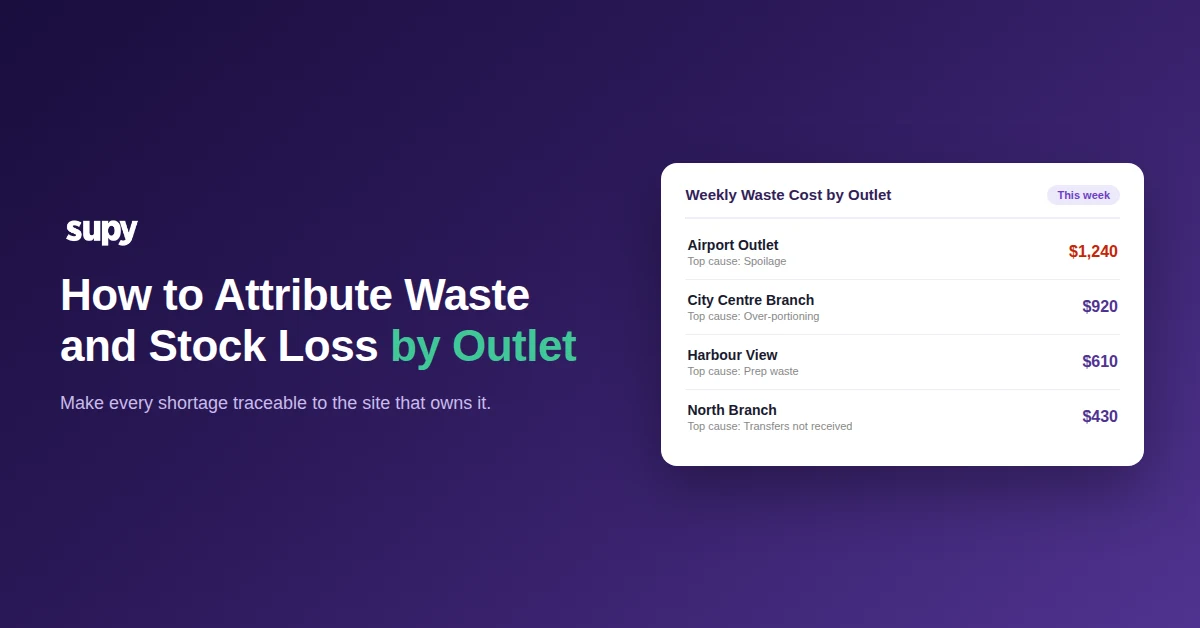
That is what turns "we are losing money somewhere" into "the Airport Outlet is losing $1,240 a week to spoilage." The table below is the shape to aim for: each outlet, its weekly waste cost, and the single biggest cause, so the highest-cost site and reason are obvious at a glance.
| Outlet | Weekly waste cost | Biggest cause |
|---|---|---|
| Airport Outlet | $1,240 | Spoilage |
| City Centre Branch | $920 | Over-portioning |
| Harbour View | $610 | Prep waste |
| North Branch | $430 | Transfers not received |
Read the table top-down: the highest-cost outlet and its main cause is the first thing to hand a site manager this week.
Step 4: Rule Out Mapping Errors Before You Call a Shortage a Loss
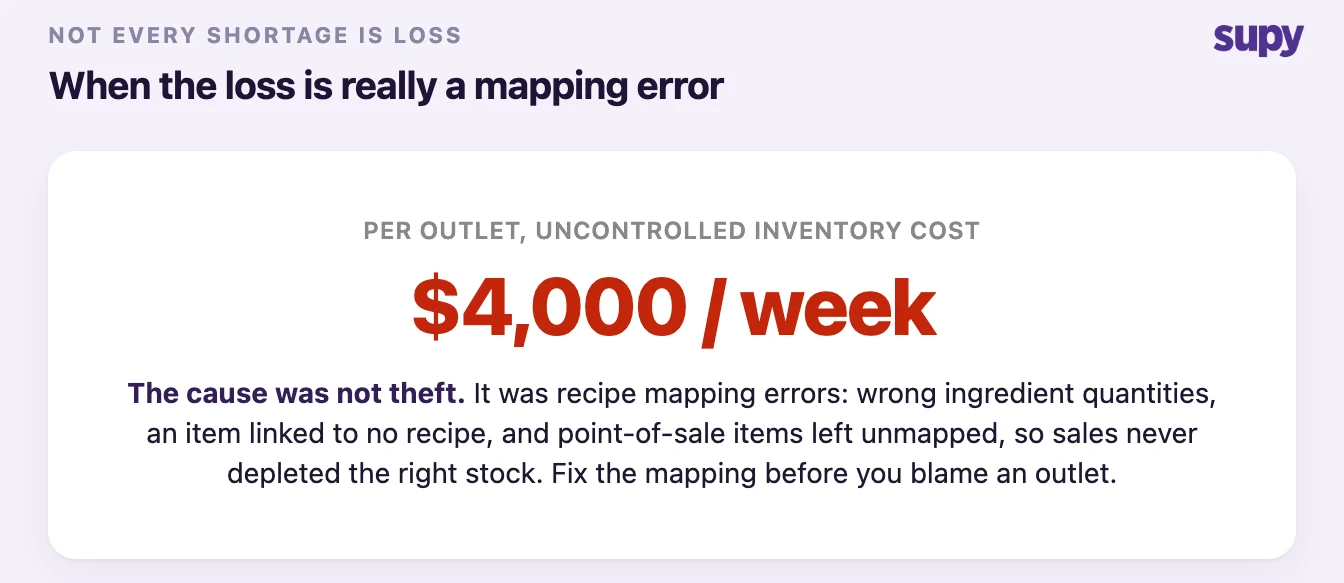
Sometimes a per-outlet number is wrong not because stock walked out, but because the system was never told what a sale consumes. One enterprise quick-service group was seeing around $4,000 per week per store in uncontrolled inventory cost with large day-to-day gaps between expected and counted stock. The cause was not theft: it was recipe mapping errors, including wrong ingredient quantities, an item linked to no recipe at all, and point-of-sale items left unmapped, so sales never depleted the right stock.
Before you chase a shortage as loss, confirm the mapping. Recipes link to point-of-sale menu items, including modifiers, so a sale depletes the correct ingredients; an unmapped item or a wrong quantity quietly misattributes loss until it is corrected. A shortage that vanishes after you fix a recipe was never waste, and treating it as waste would have pointed the finger at the wrong outlet.
Step 5: Run a Weekly Routine to Keep Loss Attributable
Attributing waste and stock loss by outlet is a routine, not a one-off cleanup. Once a week, name the site with the highest waste cost from the multi-site comparison and its biggest cause, and give that outlet's manager one specific thing to fix. Before you record any shortage as waste, check the recipe and point-of-sale mapping for the items involved, because a mapping error masquerades as loss. Confirm each outlet is still modelled as its own location rather than a storage area, so new sites do not slip back into the group total. The goal is not a lower number this week; it is a number that always has an owner.
For the wider setup behind counts you can trust, see our guide to restaurant stock management software, and once your outlets reconcile you can pressure-test each site's margin with our free food cost calculator.